
Living Labs
Legacy Curriculum
Hey there! This curriculum is no longer being curated or supported. It may contain materials that are no longer available or outdated information. Please use this document for reference.
What is a Living Lab?
Scientists and engineers around the world use data to describe and to understand the way the world works. We get these data through observation and experimentation. These Living Labs offer students and teachers a chance to practice analyzing data to solve a problem or answer a question, in much the same way that scientists and engineers do every day. For example, can you use the data in the Renewable Energy Living Lab to decide if your school can be powered with solar energy? How close is your house to a recent earthquake? Science is most fun when you work with others, so be inquisitive and share what you learn. And most importantly, remember to have fun!
Renewable Energy Living Lab
Renewable energy comes from natural resources such as wind, plant material, water (rain or tides), geothermal, or sunlight and is naturally replenished. The United States right now relies heavily on coal, oil, and natural gas for its energy. These fossil fuels are nonrenewable, which means that the sources will eventually dwindle, becoming too expensive or too environmentally damaging to retrieve. Renewable energy technologies have a much lower environmental impact than conventional energy technologies.
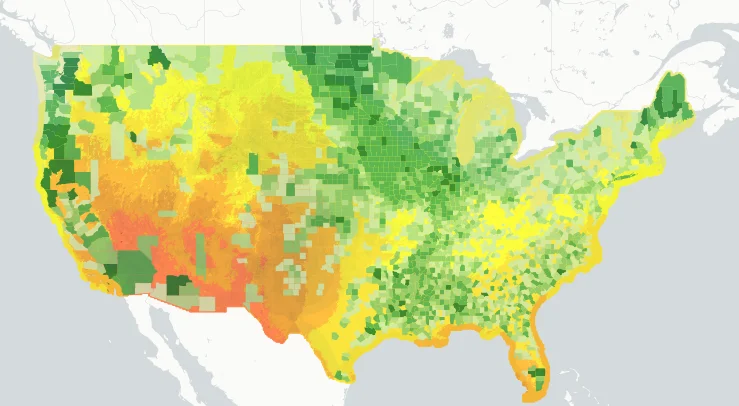
This Living Lab offers you a chance to evaluate the renewable energy sources in the U.S. Both renewable and non-renewable energy sources are used to generate electricity, power vehicles, and provide heating, cooling, and light. Renewable sources of energy vary widely in their cost-effectiveness and in their availability across the United States. Although water, wind, and other renewables may seem free, the cost comes in collecting and transporting the energy to the places where energy is needed. For example, to utilize energy from water, a dam must be built along with electric generators and transmission lines. Explore the energy sources below to look at the available renewable energy sources.
Wind is kinetic energy - a mass of air moving with speed (or velocity). The sun unevenly heats the Earth’s surface throughout the day. The air above the land heats up more quickly than the air over the water. The warm air expands and rises, and the cooler air rushes in to take its place, creating wind. This wind energy (or power) is harnessed using wind turbines. The wind rotates the turbine blades and turns a generator to produce electricity.
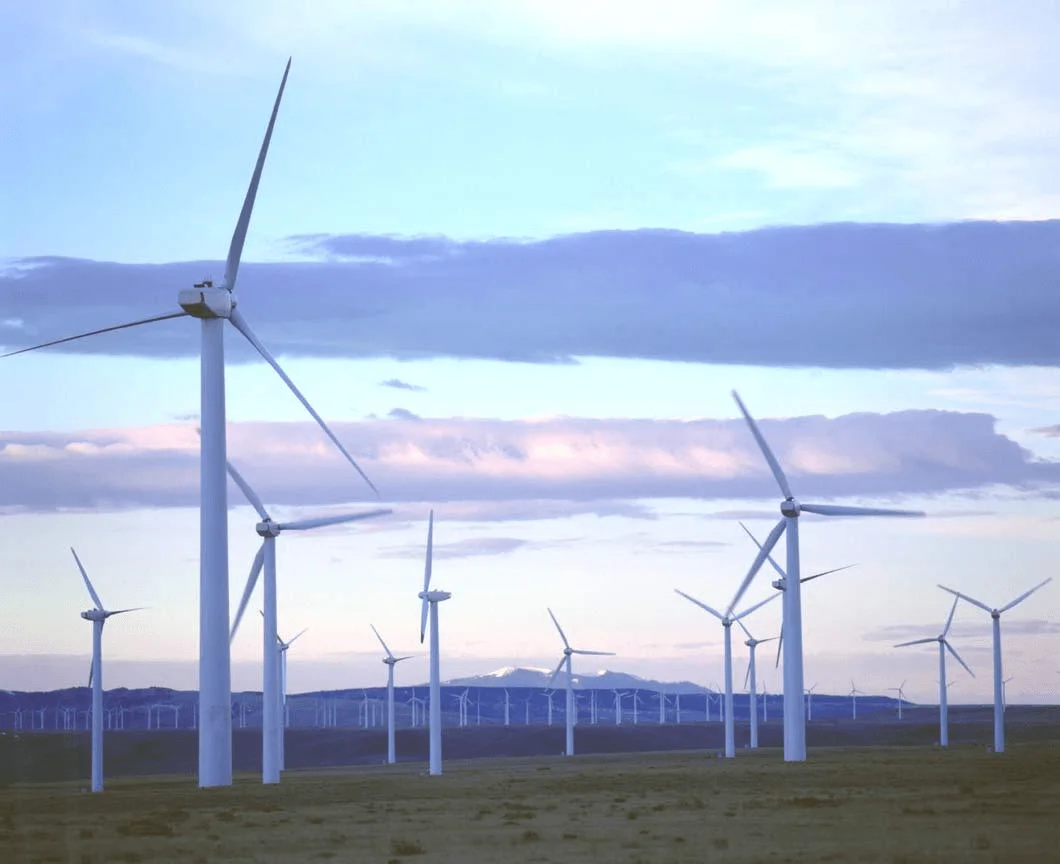
Printable maps:
Learn more:
Biomass is potential energy found in living or recently living organisms (plants, animals, and their waste products). The energy in biomass is stored from the sun through photosynthesis. We have been using biomass as energy since man began burning wood to cook and keep warm. Wood is the largest biomass energy resource today, but food crops, grassy and woody plants, residues from agriculture or forestry, oil-rich algae, and the organic component of municipal and industrial wastes. Even the fumes from landfills (which are methane, a natural gas) can be used as a biomass energy source.
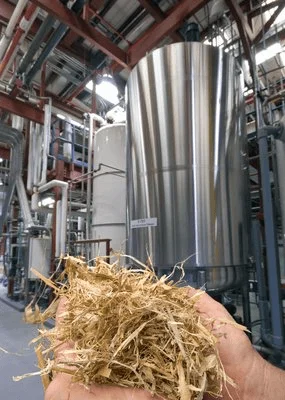
Printable maps:
Learn more:
Flowing water creates energy called hydroelectric power or hydropower. Water constantly moves through a vast global cycle, evaporating from lakes and oceans, forming clouds, precipitating as rain or snow, then flowing back down to the ocean. The energy of this water cycle, which is driven by the sun, can be tapped to produce electricity. Hydropower uses a fuel—water—that is not reduced or used up in the process. The amount of available energy in moving water is determined by its flow (kinetic energy) or fall (potential energy). Swiftly flowing water in a big river carries a great deal of energy in its flow. Water descending rapidly from a very high point also has lots of energy in its flow. In either instance, the water flows through a pipe, or penstock, then pushes against and turns blades in a turbine to spin a generator to produce electricity. In a run-of-the-river system, the force of the current applies the needed pressure, while in a storage system, water is accumulated in reservoirs created by dams, then released as needed to generate electricity.
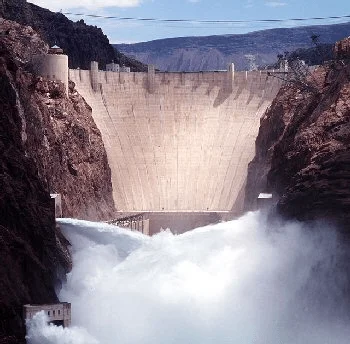
Printable maps:
Learn more:
Geothermal energy is heat energy from the Earth’s core. Rock and underground water absorb this energy and become very hot. Electricity can be generated from this heat energy by drilling deep wells and pumping out the heated underground water. This water is so hot it turns to steam when it reaches the surface of the Earth, like at Yellowstone National Park in Wyoming, where this heat energy comes very close to the surface and creates geysers of hot water and steam.
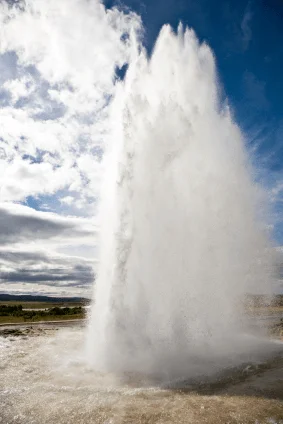
Printable maps:
Learn more:
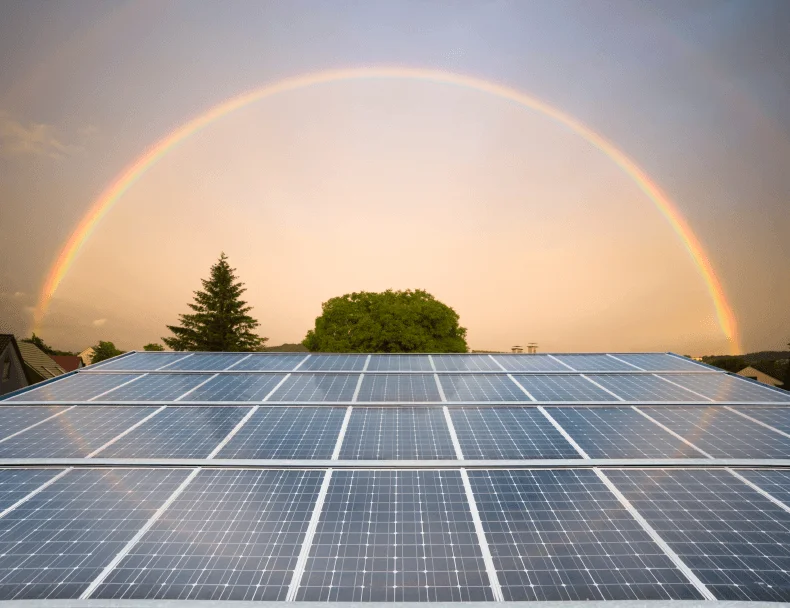
Solar power captures and converts the sun’s radiant energy into energy that can be used to power homes and industry. Solar energy is responsible for heating the Earth’s atmosphere, driving the climate, and providing the foundation of most food chains through photosynthesis. Solar power can be collected using very large mirrors to concentrate sunlight onto receivers that collect the solar energy and convert it to heat. Solar power can also be collected using solar cells to convert sunlight directly into electricity. You have probably seen these cells as panels on the rooftops of houses or other buildings.
Printable maps:
Learn more:
More Renewable Energy Resources
Explore the Data
Renewable Energy Living Lab Activities
K-8 Activities:
- Renewable Energy Living Lab: Energy Experts
- Renewable Energy Living Lab: Power Your School
- Renewable Energy Living Lab: Energy Priorities
- Renewable Energy Living Lab: Smart Solar
9-12 Activities:
Earthquakes Living Lab
Earthquakes occur nearly every day, and they occur around the world! The U.S. Geological Survey estimates that about 500,000 detectable earthquakes occur in the world each year. Of those, 100,000 can be felt and 100 of them cause damage. Earthquakes occur as a result of geology—when two blocks of the Earth's crust suddenly slip past one another along a fault or fault plane. The release of energy takes the form of seismic waves, sort of like ripples on a pond. The seismic waves shake the Earth as they move through it, and when the waves reach the Earth's surface, they shake the ground—and us!
The Earthquakes Living Lab offers you a chance to investigate earthquakes all around the world. You will find that many earthquakes have happened this week! What instruments, methods and data do scientists and engineers use to measure and locate earthquakes? How do scientists use evidence to explain the theory of plate tectonics? What are some effects of earthquakes that influence how much damage they cause? What are the best designs for buildings located in earthquake-prone regions? This Living Lab uses four focus areas (Chile, San Francisco, Japan, and Southern California) to help guide you toward answers to these questions—and many more. Rock your world by looking at real data from around the globe!
Examine these four active seismic areas to inquire about different aspects of earthquakes!
Focus: Measuring and locating earthquakes
In 2010, a magnitude 8.8 earthquake occurred approximately 100 km southwest of Talca, Chile, resulting in a tsunami, major property damage, and over 500 deaths. This earthquake is one of three earthquakes included in the virtual earthquake simulation accessed through the link below (How is an earthquake epicenter located?).
The resources on this page focus primarily on the instruments, methods and data used to measure and locate earthquakes. Start exploring!
- Where did earthquakes occur this week? How many? How big were they?
- How is an earthquake epicenter located, and how is its magnitude determined?
- What is the difference between a P wave and an S wave?
- What else should I know about measuring earthquakes?
- What are the details of the geology and fault system at Talca, Chile?
Focus: Plate tectonics
On January 17, 1994, people in Southern California were jolted by a major earthquake that resulted in approximately $20 billion in damages even though this area had anticipated and designed for earthquake activity. The 6.7 magnitude Northridge earthquake tested many theories related to building structures, highway designs and bridges. This earthquake forced engineers to rethink how they design buildings.
The links on this page focus primarily on how scientists use evidence to explain the theory of plate tectonics, how the Earth changes over time, and the results of powerful natural events such as earthquake activity.
- Use the current earthquake data to plot the latitude and longitude of 10 earthquakes that have happened in the last week. What patterns do you notice regarding where earthquakes take place?
- How have the Earth’s continents changed over time?
- What is the Theory of Plate Tectonics? What evidence supports the Theory of Plate Tectonics?
- General information on plate tectonics, including images, animations and explanations.
- How do scientists use evidence to support the theory of plate tectonics? How do scientists use drilling evidence, fossil evidence and sea floor spreading to support the theory of plate tectonics?
- How do scientists use the fossil record to explain the theory of plate tectonics?
- Describe three ways that tectonic plates move. What are the outcomes of this movement? What causes this movement?
- Using the map, locate two areas in the world that show each of the plate movements. What are the consequences of tectonic plate movement? What geologic features are created and destroyed?
- What are the effects of plates moving against each other? What physical features are created in these areas? How does this affect the West Coast?
- How does subduction change the Earth’s surface?
- What are the effects of plates moving away from each other? What physical features are created in these areas?
- How do scientists explain tectonic plate movement?
Focus: Effects and consequences of earthquakes
On Tuesday, January 17, 1995, at 5.46 AM (local time), a magnitude 7.2 earthquake struck the Kobe region of south-central Japan. This region is the second most populated and industrialized area after Tokyo, with a total population of ~10 million people. Even though the ground shook for only ~20 seconds, more than 5,000 people died, more than 300,000 people became homeless and damage estimated at £100 billion was caused to roads, houses, factories and infrastructure (electricity, gas, water, sewers, phone and internet cables, etc.).
The links on this page focus primarily on the effects of large earthquakes and some of the factors that influence the amount of damage caused by earthquakes.
- Why did the earthquake happen at Kobe? What were the short- and long-term effects of the earthquake?
- What did it look like after the Kobe earthquake? Take a look at these photographs.
- What factors determine the extent of damage from an earthquake?
- What are the details of the geology and fault system in the region of Kobe, Japan?
Focus: Geology and design in earthquake prone areas
On April 18, 1906, at 5:12 AM (local time), the San Francisco Bay area was hit with one of the most significant earthquakes of all time. The shaking lasted from 45 to 60 seconds and was felt from Oregon to Los Angeles and as far east as Nevada. The consequences of this earthquake and the damage it caused have since become known as the most important study of an earthquake because of the great amount of information it provided scientists. Its economic impact is comparable to the damages related to Hurricane Katrina in 2005, nearly 100 years later.
The links on this page explain how engineers study earthquakes and regional geology to determine the best design for buildings located in earthquake-prone areas. Exploring these resources provides information to help you model and test potential earthquake-resistant building designs.
- How do scientists use computer models to try to predict earthquakes?
- What factors influence the magnitude of an earthquake?
- How do soil types and the geology of an area affect the land after an earthquake?
- How do earthquakes affect buildings? Trigger an earthquake simulation to see.
- How do engineers design buildings that withstand the forces of earthquakes? The importance of design, construction materials and location.
- How do engineers use models and earthquake simulations to test designs for earthquake-resistant buildings and structures? (5-minute video)
Want more info on recent earthquakes? Visit the USGS Real-Time Earthquake Map!
 Data provided by USGS
Earthquakes Living Lab Activities
K-8 Activities:
- Earthquakes Living Lab: Geology and the 1906 San Francisco Quake
- Earthquakes Living Lab: Designing for Disaster
- Earthquakes Living Lab: The Theory of Plate Tectonics
9-12 Activities: