Quick Look
Grade Level: 7 (6-7)
Time Required: 45 minutes
Expendable Cost/Group: US $0.00 This activity requires the use of non-expendable (reusable) LEGO Intelligent Bricks and parts; see the Materials List for details.
Group Size: 3
Activity Dependency: None
Subject Areas: Science and Technology
Quick Look 

- Grade Level:
- 7 (6 – 7)
- Time Required:
- 45 minutes
- Group Size:
- 3
- Subject Areas:
-
Science and Technology

Summary
Through investigating the nature, sources and level of noise produced in their environment, students are introduced to the concept of noise pollution. They learn about the undesirable and disturbing effects of noise and the resulting consequences on people's health, as well as on the health of the environment. They use a sound level meter that consists of a sound sensor attached to the LEGO® EV3 Intelligent Brick to record the noise level emitted by various sources. They are introduced to engineering concepts such as sensors, decibel (dB) measurements, and sound pressure used to measure the noise level. Students are introduced to impairments resulting from noise exposure such as speech interference, hearing loss, sleep disruption and reduced productivity. They identify potential noise pollution sources, and based on recorded data, they classify these sources into levels of annoyance. Students also explore the technologies designed by engineers to protect against the harmful effects of noise pollution.
Engineering Connection
Engineers must evaluate a number of quality factors, such as the level of noise produced, while designing new technologies and devices. For some products, noise level reduction is a main concern in the engineering design process. In designing products from transportation vehicles such as aircraft, cars and trains, to household appliances such as refrigerators and air conditioners, engineers strive to reduce the level of harmful noise in order to comply with official safety requirements. To help determine if their products meet these noise level safety requirements, engineers design tools to measure noise levels. Engineers also design appliances to protect against loud sounds such as ear plugs and noise-cancelling headphones, noise reduction windows and doors, and noise reduction materials such as mineral fiber, acoustical foam, glass fiber and ceramic fiber.
During this activity, students construct noise level meters, which is an example of a combination mechanical and electrical engineering project that uses a sensor to convert a physical quantity into an electric signal that is read and interpreted by a computer (the LEGO brick). The activity also presents connections to computer science through the recording program and use of mathematics to produce the results of the measurements and a noise level graphical representation display. By recording and plotting data, students increase their understanding of graphical data displays and how engineers analyze data to solve real-world design challenges.
Learning Objectives
After this activity, students should be able to:
- Explain noise pollution and how engineers measure it.
- Describe and list examples of impairments resulting from noise pollution.
- Describe and list solutions proposed by engineers to protect against unwanted noise.
- Construct a noise level meter to record noise pollution in the classroom.
- Plot and analyze data.
Educational Standards
Each TeachEngineering lesson or activity is correlated to one or more K-12 science,
technology, engineering or math (STEM) educational standards.
All 100,000+ K-12 STEM standards covered in TeachEngineering are collected, maintained and packaged by the Achievement Standards Network (ASN),
a project of D2L (www.achievementstandards.org).
In the ASN, standards are hierarchically structured: first by source; e.g., by state; within source by type; e.g., science or mathematics;
within type by subtype, then by grade, etc.
Each TeachEngineering lesson or activity is correlated to one or more K-12 science, technology, engineering or math (STEM) educational standards.
All 100,000+ K-12 STEM standards covered in TeachEngineering are collected, maintained and packaged by the Achievement Standards Network (ASN), a project of D2L (www.achievementstandards.org).
In the ASN, standards are hierarchically structured: first by source; e.g., by state; within source by type; e.g., science or mathematics; within type by subtype, then by grade, etc.
Common Core State Standards - Math
-
Display numerical data in plots on a number line, including dot plots, histograms, and box plots.
(Grade
6)
More Details
Do you agree with this alignment?
-
Fluently add, subtract, multiply, and divide multi-digit decimals using the standard algorithm for each operation.
(Grade
6)
More Details
Do you agree with this alignment?
-
Use ratio reasoning to convert measurement units; manipulate and transform units appropriately when multiplying or dividing quantities.
(Grade
6)
More Details
Do you agree with this alignment?
-
Investigate patterns of association in bivariate data.
(Grade
8)
More Details
Do you agree with this alignment?
International Technology and Engineering Educators Association - Technology
-
Students will develop an understanding of the relationships among technologies and the connections between technology and other fields of study.
(Grades
K -
12)
More Details
Do you agree with this alignment?
-
Students will develop an understanding of the effects of technology on the environment.
(Grades
K -
12)
More Details
Do you agree with this alignment?
State Standards
New York - Math
-
Represent and interpret data.
(Grade
5)
More Details
Do you agree with this alignment?
-
Display numerical data in plots on a number line, including dot plots, histograms, and box plots.
(Grade
6)
More Details
Do you agree with this alignment?
-
Use ratio reasoning to convert measurement units; manipulate and transform units appropriately when multiplying or dividing quantities.
(Grade
6)
More Details
Do you agree with this alignment?
-
Fluently add, subtract, multiply, and divide multi-digit decimals using the standard algorithm for each operation.
(Grade
6)
More Details
Do you agree with this alignment?
-
Investigate patterns of association in bivariate data.
(Grade
8)
More Details
Do you agree with this alignment?
Materials List
For each group:
- graph paper
- LEGO MINDSTORMS Education EV3 Core Set that is used throughout this unit and available at https://education.lego.com/en-us/products/lego-mindstorms-education-ev3-core-set/5003400#lego-mindstorms-education-ev3
- LEGO MINDSTORMS Sound Sensor, which can be purchased separately at https://www.amazon.com/LEGO-NXT-Sound-sensor/dp/B01L4GN4VU/ref=sr_1_1?dchild=1&keywords=lego+sound+sensor&qid=1595360043&sr=8-1
- LEGO MINDSTORMS EV3 touch sensor, which is also included in the LEGO base set or can be purchased separately at https://education.lego.com/en-us/products/lego-mindstorms-education-ev3-touch-sensor/45507
- computer, loaded with EV3 1.2.1 software
- Measuring Noise Pollution Pre-Activity Survey, one per student
- Measuring Noise Pollution Worksheet, one per student
Note: This activity can also be conducted with the older (and no longer sold) LEGO MINDSTORMS NXT set instead of EV3; see below for those supplies:
- LEGO MINDSTORMS NXT robot, such as the NXT Base Set
- computer loaded with the NXT 2.1 software
To share with the entire class:
- computer and USB cable
Worksheets and Attachments
Visit [www.teachengineering.org/activities/view/nyu_noise_activity1] to print or download.Pre-Req Knowledge
Familiarity with LEGO EV3 kits and software, and ability to read measurements and plot data using graph paper.
Introduction/Motivation
What is noise pollution and why it is considered a source of pollution? People living in big cities are exposed every day to unwanted and harmful sounds such as loud cars and motorcycles, leaf blowers, barking dogs, noisy neighbors, parties, car alarms, police and firefighter sirens. It is common in many neighborhoods to hear people complaining about loud sounds disturbing their personal activities such as rest, sleep, study, entertainment, relaxation and conversation. A sound becomes unwanted when it either interferes with normal activities or disrupts or diminishes a person's quality of life. For example, in a noisy classroom, students may not be able hear the teacher and may become upset or fall behind in learning as a consequence.
How does noise pollution relate to engineering? Environmental engineers measure noise pollution and report recommendations for noise reduction or elimination. Noise control engineers specialize in designing and testing noise insulation technologies and sound-absorbent materials such as acoustical foam and glass fiber. Engineers in various fields ranging from mechanical, aeronautical, industrial, electrical to civil engineering share a common interest in noise pollution reduction. They design new technologies that produce less noise in order to meet recommended standards. Examples of noise protection products are noise neutralizers such as noise-cancelling headphones and noise insulation windows and doors.
Definition and measurement: Noise pollution refers to any unpleasant, damaging or irritating noise that has the potential to harm people, wildlife or the environment. The decibel (dB) is the main unit used to measure the intensity or loudness of sounds. A sound can also be measured by its pitch, which is the frequency of sound vibrations per second. For example, a low pitch produced by a deep voice, makes fewer vibrations per second than a high voice. Sounds with higher pitch, such as a cry or sound from a violin, have a high rate of vibrations. Sound is usually recorded with a microphone. However, in a sound level meter, a sound sensor is used. Sound sensors work like microphones but are much more accurate. 
How does a sound sensor work? The response of a sound sensor to a nearby sound is approximately proportional to the sound pressure, which is the air pressure produced by the propagating sound. For example, if we talk with a piece of paper placed just in front of our mouth, the resulting air pressure causes the paper to move. A similar observation can be made by feeling vibrations from a loud speaker.
What are the sources of noise pollution? Most unwanted sounds are made by transportation vehicles such as airplanes, trains, cars, trucks, buses, motorcycles and construction site equipment such as pneumatic hammers, air compressors, bulldozers, loaders, dump trucks and pavement breakers. Noise can also come from household appliances such as music and television sets, air conditioning, refrigerator, lawn mowers, leaf blowers, loudly talking neighbors or a crowd of people.
Health hazard: According to the World Health Organization (WHO), exposure to levels of noise exceeding safe limits (anything over 50 decibels), can be detrimental to hearing and has the risk of contributing to high blood pressure, strokes and even heart attacks. In fact when the body is exposed to high levels of noise, it reacts by releasing stress hormones and keeping the body in a perpetual level of tension. Long time exposure to loud sounds may result in side-effects such as irritation and anger, lack of concentration, interrupted sleep and hearing-related damage such as tinnitus. The human ear feels pain at 120-140 decibels, and for that reason, we are tend to protect our ears with our hands when listening to sounds in or above that decibel range.
Environmental threat: Plants require cool and peaceful environments to grow, and noise pollution causes poor crop quality. Noise has ripple effects on long-lived plants such as trees and the consequences could last for decades, even after the source of the noise goes away, according to lead author Clinton Francis of the National Science Foundation. Birds and other animals change their behaviors in response to human noise, such as the din of traffic or the hum of machinery. Noise creates sound waves that indirectly weaken the edifice of buildings, bridges and monuments and over time, can put buildings in dangerous condition. (See more information at https://www.sciencedaily.com/releases/2012/03/120320195747.htm.)
Engineering controls: Due to the increasing concern about noise pollution, engineering controls are designed to eliminate or reduce the level of noise generated, isolate workstations exposed to excessive noise or insulate noisy work areas. For example, noisy equipment and machinery are replaced with newer models that are quieter or isolated in separate rooms equipped with sound-absorbent materials, dampers, mufflers, silencers or barriers. The same materials are used in construction to keep outside noise from coming into homes and classrooms. Today, most cars are equipped with mufflers, aircraft engines are designed to make less noise, and modern subway systems are less noisy.
Procedure
Before the Activity
- Gather materials and make copies of the Measuring Noise Pollution Pre-Activity Survey and Measuring Noise Pollution Worksheet.
- Set the system in place by making sure all the components are connected to the appropriate ports (touch sensor to port 1, sound sensor to port 3) of the LEGO EV3 Intelligent Brick.
- Check to make sure the battery level is good.
- Calibrate the sound sensor: In a silent room with the air conditioner or heater turned off, classroom lights turned off (if they make any noise when on), and all windows and doors closed, follow the following three steps:
- Run the program noiseMeter.ev3.
- Press the button attached to the touch sensor to start recording data.
- The screen must display less than 4.5 dB.
Note: The sound sensor can measure sound pressure level up to 90 dB. The following range value must be obtained while measuring sound pressure: 3.6 to 4.5 dB in a silent room, 4.5 to 9 dB for someone talking approximately 20 feet away, 9 to 27 dB for a normal conversation, and 27 to 90 dB for people shouting or music at a high volume. One might consider a margin error of about 5 dB.
With the Students: Measuring Sound Level
- Administer the pre-activity survey.
- Present to students the Introduction/Motivation material.
- Hand out the worksheets.
- Divide the class into groups of three students each.
- Give the groups all the necessary materials and have them repeat steps 2 and 3 of the "Before the Activity" steps.
- Open the noiseMeter.ev3 program on your computer (if for any reason the sensor ports are changed, please do so in the program).
- Connect the USB cable and upload the program onto the LEGO Intelligent Brick.
- Run the program on the LEGO brick by selecting the correct program and pressing the orange button twice.
- Start recording the sound by pressing the touch button.

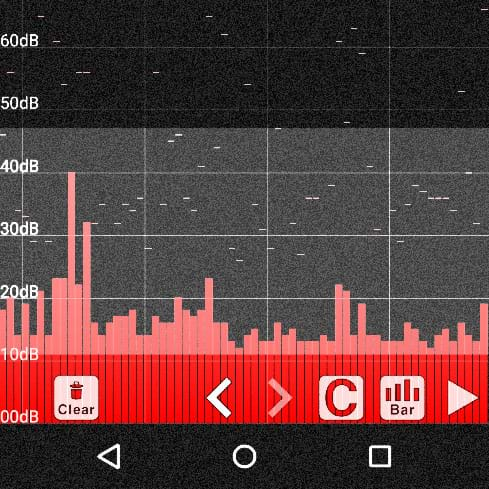
- Note that while the program executes, the amplitude of the measured sound is instantaneously displayed and also saved to a file.
- When the program ends, students connect the brick to the computer, open the file where the data is saved and record it in their worksheet tables.
- Students compare their results with the average standards on the same type of noise.
- If a difference of more than 5 dB is observed when comparing the results from the activity with the average standards, then repeat the experiment one more time. If the difference is small (less than 5 dB), mention some factors such as context, environment and accuracy of the measurement instrument that might explain the difference. In fact, professional measurement instruments are very expensive and operated by well-trained engineers and technicians. Thus, some error is anticipated in this activity due to using less precise measuring devices in an environment that is more difficult to control with students learning to use the instruments.
- Student plot their data as a bar chart using graph paper and an appropriate scale.
- Students analyze the data based on the plot and answer the worksheet questions. Through a class discussion, have students draw conclusions about dangerous sources of noise pollution. Based on what noise level values they measured in the activity, students should list sources they believe produce a sound over a threshold of 85 dB. Students should cite 2 or 3 engineering methods to protect against harmful noise from these sources.
Vocabulary/Definitions
decibel (dB): The SI (International System of Units) unit of measure of sound intensity.
environment: The air, water and land in or on which people, animals and plants live.
hertz (Hz): The SI unit of measure of frequency.
impairment: Physical or mental damage.
mean: Statistical unit computed as the sum of all measures divided by the number of records. Also known as the average.
noise: A sound of any kind.
noise pollution: Annoying or harmful noise.
pollution: An undesirable state of the environment.
sample: A small number of measures.
sensor: A device converting a physical factor into an electrical signal.
sound level meter: A device used to measure the noise intensity.
source: A point of origin or procurement.
Assessment
Pre-Activity Assessment
Pre-Activity Survey: Before providing any information, ask students to complete the Measuring Noise Pollution Pre-Activity Survey to the best of their abilities. Reassure students that this is not for a grade so they feel comfortable writing down their ideas, even if they are unsure. Tell them that even if they do not know all the answers at the start of class, they will know them by the end of the activity.
Informal Discussion: Ask students some questions about the subject matter, covering the questions and correct answers to the pre-activity survey. Refer to the Measuring Noise Pollution Pre-Activity Survey Answer Key. Ask the students:
- What is pollution? Have you ever heard of noise pollution? What is noise pollution?
- What tools might we use to record sound? What can we use to measure sound level?
- What unit of measure do we use to measure sound level?
Activity Embedded Assessment
Analysis: While the experiments are being conducted, have students complete the Measuring Noise Pollution Worksheet and a bar graph of their data. Ask students to comment on the procedure to measure the sound intensity during each experiment. To make sure the graph is completed correctly, ask students what they must display on the horizontal axis and what they must display on the vertical axis. Check that students use an appropriate scale that can fit all the recorded data.
Post-Activity Assessment
Formal Discussion: Ask students to explain the entire procedure in their own words, as if they were explaining the activity to a family member. In particular, ask them to explain noise pollution, its causes, the unit used to measure sound intensity, and the measurement tools used to measure sound levels. Expect students to be able to cite at least three sources of noise pollution, two health hazards related to noise pollution and two manufactured products to reduce noise pollution. Based on the noise levels they measured in the activity, ask students to list noise pollution sources they believe to be over 85 dB. Also discuss with students the role of each individual component in the experiment (that is, the sensor, the brick, the program and the graph).
Troubleshooting Tips
Make sure the equipment is set up correctly, the battery levels are good and sensors are connected to the correct brick ports.
Make sure the noiseMeter.ev3 program is running.
Always calibrate the sensor before gathering data.
Refer to the EV3 website for any other issues: https://www.lego.com/cdn/cs/set/assets/bltbef4d6ce0f40363c/LMSUser_Guide_LEGO_MINDSTORMS_EV3_11_Tablet_ENUS.pdf
Subscribe
Get the inside scoop on all things TeachEngineering such as new site features, curriculum updates, video releases, and more by signing up for our newsletter!More Curriculum Like This

Students learn the decibel reading of various noises and why high-level readings damage hearing. Sound types and decibel readings are written on sheets of paper and students arrange the sounds from the lowest to highest decibel levels.

Students learn the physics of sound and how it travels, as well as how noise impacts human health. Then they devise an experimental procedure and teams collect data in their classroom, school and near a loud noise source (such as a busy road or construction site) using smart phones/tablets, micropho...
References
Brüel & Kjær. Environmental Noise Measurement. Cafe Foundation. Accessed January 3, 2013. (This booklet answers many basic questions about environmental noise criteria and environmental noise measurements.) http://cafefoundation.org/v2/pdf_tech/Noise.Technologies/PAV.Environ.Noise.B&K.pdf
Human Noise Has Ripple Effects on Plants: Clamor affects more than birds and other animals. Published March 20, 2012. National Science Foundation. Press Release 12-052. Accessed January 7, 2013. http://www.nsf.gov/news/news_summ.jsp?cntn_id=123538
Noise Control Act of 1972. U.S. Environmental Protection Agency. Accessed January 3, 2013. http://www.epa.gov/air/noise/noise_control_act_of_1972.pdf
Copyright
© 2013 by Regents of the University of Colorado; original © 2012 Polytechnic Institute of New York UniversityContributors
Violet Mwaffo; Jerib Carson and Qianqian Lin at the Madiba Prep Middle SchoolSupporting Program
AMPS GK-12 Program, Polytechnic Institute of New York UniversityAcknowledgements
This activity was developed by the Applying Mechatronics to Promote Science (AMPS) Program funded by National Science Foundation GK-12 grant no. 0741714. However, these contents do not necessarily represent the policies of the NSF, and you should not assume endorsement by the federal government.
Last modified: August 11, 2022
User Comments & Tips