Quick Look
Grade Level: 8 (6-8)
Time Required: 15 minutes
Lesson Dependency: None
Subject Areas: Earth and Space, Science and Technology
NGSS Performance Expectations:

| MS-ESS2-5 |
Summary
Students consider how weather forecasting plays an important part in their daily lives. They learn about the history of weather forecasting — from old weather proverbs to modern forecasting equipment — and how improvements in weather technology have saved lives by providing advance warning of natural hazards.Engineering Connection
People have forecasted the weather since ancient times; however, thanks to the work of engineers during the past 100 years, we now have advanced weather forecasting equipment such as weather balloons, satellites, Doppler radar and computer simulation programs. Today, people around the world rely on the information provided by these weather forecasting technologies, in the form of weather forecasts broadcast multiple times daily, to help us choose clothes to wear, plant crops at optimal times, and survive natural disasters, such as hurricanes, floods and tornadoes.
Learning Objectives
After this lesson, students should be able to:
- Describe how weather forecasting has evolved from the observation of patterns to modern forecasting equipment.
- Explain how engineering advancements in weather forecasting improve the quality of people's lives around the world.
- List several examples of technology behind modern forecasting equipment (weather balloons, satellites and weather radars).
Educational Standards
Each TeachEngineering lesson or activity is correlated to one or more K-12 science,
technology, engineering or math (STEM) educational standards.
All 100,000+ K-12 STEM standards covered in TeachEngineering are collected, maintained and packaged by the Achievement Standards Network (ASN),
a project of D2L (www.achievementstandards.org).
In the ASN, standards are hierarchically structured: first by source; e.g., by state; within source by type; e.g., science or mathematics;
within type by subtype, then by grade, etc.
Each TeachEngineering lesson or activity is correlated to one or more K-12 science, technology, engineering or math (STEM) educational standards.
All 100,000+ K-12 STEM standards covered in TeachEngineering are collected, maintained and packaged by the Achievement Standards Network (ASN), a project of D2L (www.achievementstandards.org).
In the ASN, standards are hierarchically structured: first by source; e.g., by state; within source by type; e.g., science or mathematics; within type by subtype, then by grade, etc.
NGSS: Next Generation Science Standards - Science
| NGSS Performance Expectation | ||
|---|---|---|
|
MS-ESS2-5. Collect data to provide evidence for how the motions and complex interactions of air masses results in changes in weather conditions. (Grades 6 - 8) Do you agree with this alignment? |
||
| Click to view other curriculum aligned to this Performance Expectation | ||
| This lesson focuses on the following Three Dimensional Learning aspects of NGSS: | ||
| Science & Engineering Practices | Disciplinary Core Ideas | Crosscutting Concepts |
| Collect data to produce data to serve as the basis for evidence to answer scientific questions or test design solutions under a range of conditions. Alignment agreement: | The complex patterns of the changes and the movement of water in the atmosphere, determined by winds, landforms, and ocean temperatures and currents, are major determinants of local weather patterns. Alignment agreement: Because these patterns are so complex, weather can only be predicted probabilistically.Alignment agreement: | Cause and effect relationships may be used to predict phenomena in natural or designed systems. Alignment agreement: |
International Technology and Engineering Educators Association - Technology
-
Explain how knowledge gained from other content areas affects the development of technological products and systems.
(Grades
6 -
8)
More Details
Do you agree with this alignment?
-
Develop innovative products and systems that solve problems and extend capabilities based on individual or collective needs and wants.
(Grades
6 -
8)
More Details
Do you agree with this alignment?
State Standards
Colorado - Science
-
Differentiate between basic and severe weather conditions, and develop an appropriate action plan for personal safety and the safety of others
(Grade
8)
More Details
Do you agree with this alignment?
-
Use models to develop and communicate a weather prediction
(Grade
8)
More Details
Do you agree with this alignment?
Worksheets and Attachments
Visit [www.teachengineering.org/lessons/view/cub_weather_lesson04] to print or download.Introduction/Motivation
What were you thinking about when you dressed for school this morning? Specifically, how did you decide what to wear today? Did you glance out the window to see what the weather was doing? If you looked out the window, what were your clues? (Possible answers: Clouds, sunshine, wind blowing through the trees, birds in the sky, etc.) So, without even thinking about it this morning, you were forecasting the weather! In the same way, people around the world have been forecasting the weather for thousands of years. For a long time, people relied on weather patterns to predict the weather. Who has heard the following expression?
"Red skies in the morning, sailors take warning? Red skies at night, sailors' delight."
Well, although this rhyme is not entirely true, ancient sailors used it as a rule of thumb, due to the fact that a red morning sun did indeed often bring rain (because the red sky occurred when the air was full of dust and water vapor).
Besides sailors navigating on the open water and you wanting to dress right for the weather, why do we care about weather forecasting? (Note: Show students the weather section of the day's newspaper.) Why is there a weather section in the newspaper? When you do see people consulting the weather forecast, either in the newspaper or on television? (Possible answers: Before planning a trip, a sporting event, going on a picnic, doing outside chores, etc.) What about people who grow food? Do any of you have a garden at your house? It is certainly helpful to understand the weather when taking care of a garden.
For farmers, whose crops are their livelihood, the ability to predict the weather is crucial. Before the advent of modern weather forecasting technology, which we will discuss later, how do you think farmers predicted the weather? (Note: If possible, show the students a copy of the Farmer's Almanac.) Some of you may have heard of The Farmer's Almanac, a book — used since 1792 — that uses a complex series of natural cycles to devise a secret weather forecasting formula, traditionally said to be 80% accurate. Before modern weather technology, farmers relied heavily on the Almanac to plan their crop growing seasons. People around the country still read the Almanac to learn about farming, the weather and to understand astronomical events and ocean tides (see Additional Multimedia Support section for a website link to a Farmer's Almanac video).
How do you think people forecast the weather today? (Possible answers: Satellites, weather balloons, computers.) Students can use their senses to describe what the weather is doing and cast future predictions with the associated activity Backyard Weather Station. During the past 100 years, engineers and scientists have worked to design modern forecasting equipment such as weather balloons, satellites, Doppler radars and more to help predict the weather. Fortunately, modern equipment has made it much easier to predict weather, climate and water-related hazards around the world, which account for nearly 90% of all natural disasters. Modern weather forecasting technology provides vital information for advance warnings of natural disasters such as tornadoes, hurricanes and floods. Improved technology has saved many lives and reduced damage to property and the environment.
Lesson Background and Concepts for Teachers
History of Weather Forecasting
Humans have always attempted to predict the weather. In 650 BC, people living in Babylonia, an ancient state in the southern part of Mesopotamia (modern day Iraq), predicted the weather from cloud patterns. The ancient Chinese predicted the weather by observing patterns of events. If the sunset was unusually red, it was often an indication of good weather for the following day. Although these ancient methods of weather forecasting were used for centuries, they were not always reliable. Another limitation was that information about the current state of the weather could not be communicated to places far away. So, if a community of Babylonians were experiencing a terrible storm, they had no way to warn their neighbors downwind that trouble was coming!
The most basic weather forecasting is still based on the observation of weather patterns, which over the years has led to folklore about the weather (see the Pre-Lesson Assessment section). You are probably familiar with Groundhog Day, celebrated on February 2 in the US. This folklore originated from ancient Celtic people who believed that if the winter's midpoint was sunny and clear, a long, cold winter would follow. Today, people celebrate this day with a groundhog named Punxsutawney Phil, who resides in Philadelphia. The tradition is that every year, on the morning of February 2, Punxsutawney Phil leaves his home under the ground. If it is sunny and clear enough for little Punxsutawney Phil to "see his shadow," a long winter is predicted. Unfortunately, this weather folklore is only accurate about half the time!
Modern Forecasting Equipment
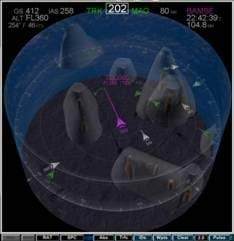
Today, we rely on modern forecasting technology and engineering to predict weather patterns. The modern age of weather forecasting began with the invention of the telegraph in 1837, which allowed forecasts to be made by knowing the actual weather conditions in distant places.
Even more progress was achieved during the 20th century when engineers and scientists designed computers to make numerical weather predictions (computer simulations) of the atmosphere (see Figure 2). These simulations take information about the present weather and use the computational tools of physics and fluid dynamics to predict future atmospheric states. Basically, the complicated equations used by the computer project how the working fluids of the atmosphere (that is, wind and water) are expected to change with different atmospheric conditions (that is, temperature, humidity and pressure).
It is important to note that before any fancy computer simulations can be made, "raw" weather data (actual weather measurements) must be collected.
Weather Balloons
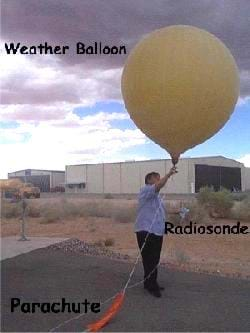
Weathers balloons carry instruments high up into the atmosphere. The balloons, launched every day all over the world, carry a radiosonde high up into the atmosphere. The radiosonde is a small, battery powered device that collects information about atmospheric pressure, humidity, and temperature. These data are then transmitted to a ground antenna via specific radio frequencies. Wind speed and direction are calculated by tracking the weather balloon using GPS or radio direction finding. The flight of a weather balloon doesn't last very long. The weather balloon is filled with either helium or hydrogen, which lifts the device into the atmosphere at a rate of about 1000 feet per minute. In its flight, the weather balloon can ascend to over 35 km (115,000 feet) and drift more than 300 km (about 180 miles) from where it was launched. As the balloon ascends, the pressure decreases, which causes the balloon to expand from an initial diameter of 1.5 feet to 6-8 feet. Eventually the balloon expands so much that it ruptures. The radiosonde has a parachute attached to it so that it is less likely to cause damage when it returns to earth. Most radiosondes are not found after they return to earth. Of the approximately 70,000 radiosondes deployed every year, only about 20% are found and returned to the National Weather Service for reconditioning and reuse.
Satellite Technology
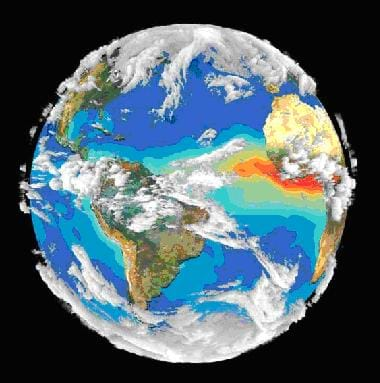
What about the big picture? Weather satellites are another engineering marvel that enable us to see what the Earth and clouds look like from space and give us a more comprehensive view of Earth's interrelated systems and climate. Figure 4 was created using data from four different satellites. The red dots you see are fires burning on land areas, and the large aerosol clouds over the Atlantic Ocean are from the burning of biomass in Africa. You can also see dust and clouds wrapped around the planet.
Weather Radars
What if we wanted to see inside a large cloud or storm to analyze its structure and gauge its potential to cause severe weather? Is this possible? Military radar operators asked this same question during World War II, when they noticed noise in returned radar echoes due to weather elements such as rain, snow and sleet. When the war was over, many of these military radar operators became engineers to develop a use for the noisy echoes. Now, we have weather radar, a special type of radar that uses radio waves to "see" how precipitation is behaving in a cloud and how it might change.
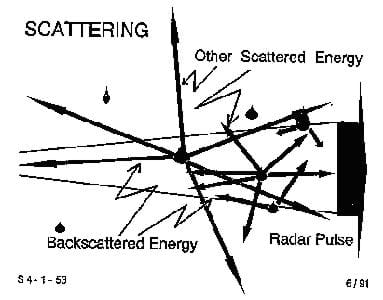
RADAR stands for radio detection and ranging. Basically, a radar is an electronic instrument used to determine the direction and distance of objects that reflect radio energy back to the radar site. Weather radars use radio waves to locate precipitation and determine its type (rain, snow, sleet or hail). They also calculate the motion of precipitation and forecast its future position and intensity.
All weather radars work by the process of scattering, in which radiation energy is reflected by small particles, as shown in Figure 5. So, when weather radar sends a radar beam out into space, the precipitation particles in the atmosphere cause the radiation energy to scatter. The motion and behavior of the scattered radiation is read by the radar site and translated into important weather information.
The Doppler Radar
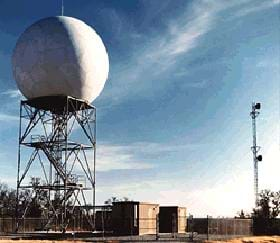
Most weather radars are Doppler radars, which can also detect the motion of rain droplets. Doppler radar gets its name from the Doppler effect. Have you ever listened to an ambulance siren or a train whistle as it was coming toward you? You probably noticed that the pitch of the whistle changed as the train passed you and moved away. This change in the frequency of sound is called the Doppler effect.
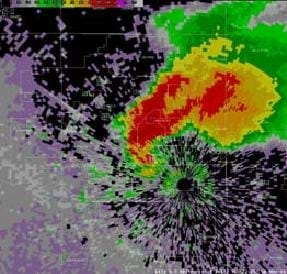
A Doppler radar measures the changes in the frequency of the signal it receives to detect the intensity of precipitation, estimate wind direction and speed, and predict hail size and rainfall amounts. Doppler radar gives forecasters the capability of providing early detection of severe thunderstorms that may bring strong damaging winds, large hail, heavy rain and possibly tornadoes. Figure 7 shows the radar reflectivity image of the Oklahoma City/Twin Lakes Doppler radar taken on May 8, 2003, just before a tornado hit the General Motors plant in the area. Because the Doppler radar (shown is the early formation of the tornado) provided the NOAA National Weather Service with 30 minutes advance warning, officials were able to move the 1,200 employees to a shelter before the tornado hit.
Who Uses the Information?
We can certainly appreciate the staggering advances in weather forecasting equipment since the telegraph was used 100 years ago. What about the people who use the equipment? Who looks at all this weather data? Who checks to see if it makes sense?
One international organization is the World Meteorological Organization (WMO), an agency of the United Nations. WMO works to verify and standardize weather data and make it available to national meteorologists, local forecasters and other people interested in weather science and forecasting. This weather data is then put into maps by computers, which can make forecasts based on certain conditions and mark them on weather maps. Then, it is the meteorologist's job to read and interpret these maps to make forecasts about the weather. You can obtain daily weather information for your city from the World Meteorological Organization by visiting http://worldweather.wmo.int/.
It is interesting to note that, according to NASA, the US statistically has the world's most violent weather. In a typical year, the US endures about 10,000 violent thunderstorms, 5,000 floods, 1,000 tornadoes, and several hurricanes. For this reason, improving weather prediction has been a high priority of meteorologists for a very long time. Engineers and scientists continue to work to improve weather forecasting technology to provide more accurate weather forecasts for the benefit of society, the economy and the environment.
Associated Activities
- Backyard Weather Station - Students use their senses to describe what the weather is doing and predict what it might do next.
Lesson Closure
Now that we have learned how weather forecasting has come a long way from the basic observation of weather patterns, we can appreciate the work of engineers who have worked so hard to develop modern forecasting equipment. Advanced technology such as weather balloons, satellites and Doppler radars have improved the quality of people's lives around the world by helping us plan our days, plant our crops, and prepare for natural hazards, such as hurricanes, tornadoes and floods.
Vocabulary/Definitions
Doppler effect: The change in frequency of a wave (that is, a sound wave) perceived by an observer moving relative to the source of waves.
meteorologist: A person who uses scientific principles to explain, understand, observe or forecast the Earth's atmospheric phenomena and/or how the atmosphere effects the Earth and life on the planet.
radar: An electronic instrument used to determine the direction and distance of objects that reflect radio energy back to the radar site.
satellite: Any object that has been put into orbit by human endeavor.
scattering: The process by which radiation energy is reflected by small particles.
weather balloon: A durable helium — or hydrogen — filled balloon that carries instruments to obtain information about atmospheric conditions.
weather satellite: A type of satellite used to monitor the weather and climate of the Earth.
Assessment
Pre-Lesson Assessment
Weather Proverbs: Read the following list of weather proverbs to students. In small groups or as a class, try to guess what each weather proverb means and what it might tell us about the weather.
- If crows fly low, winds are going to blow; if crows fly high, winds are going to die.
- No weather is ill if the wind is still.
- News and weather... they travel together.
- A sunshiny shower won't last half an hour.
- Clear moon, frost soon.
- From twelve 'til two tells what the day will do.
- It rains as long as it takes rain to come.
- When sea birds fly to land there truly is a storm at hand.
Post-Introduction Assessment
Worksheet: Before the introduction, give each student a copy of the attached Cool Weather Forecasting Facts Worksheet. Have students take notes while listening to the introduction and lesson (using the information from the Lesson Background section). At the end of the lesson, have students share their cool weather forecasting facts with the class. This worksheet can also be used as a lesson organizer.
Lesson Summary Assessment
Explaining Weather Proverbs: Return to the list of weather proverbs listed in the Pre-Lesson Assessment. Now have students explain how they could test these proverbs. What forecasting equipment might students use to determine if the proverbs are true?
Lesson Extension Activities
Understanding the Doppler Effect: Conduct the following demonstration to show students how the Doppler effect works and how Doppler radar helps meteorologists predict the weather.
You will need:
- battery-powered razor or horn (something with a steady tone)
- cassette recorder with a microphone
Procedure:
- Record the sound of the razor or horn.
- Play the recording to make sure it sounds exactly like the original sound.
- Record the razor or horn again. This time, move the razor or horn towards and past the microphone several times.
- Play the recording back and listen to the pitch of the razor or horn go up as it gets closer to the microphone and go down as it moves further away.
Explanation: The change in the frequency of sound is called the Doppler effect. Doppler radar measures the changes in the frequency of the signal it receives to detect the intensity of precipitation, estimate wind direction and speed, and predict hail size and rainfall amounts.
Additional Multimedia Support
Hands-on weather experiments for kids, http://www.srh.noaa.gov/bmx/?n=kidscorner_weatherexperiments
Farmer's almanac website with activities, videos and long-range weather forecasts, http://www.farmersalmanac.com.
Subscribe
Get the inside scoop on all things TeachEngineering such as new site features, curriculum updates, video releases, and more by signing up for our newsletter!More Curriculum Like This

Students use their senses to describe the weather and predict it. After learning the basics of weather patterns, students act as state park engineers and design/build backyard weather stations to gather data so they can make real weather forecasts.

Students learn about the remote sensing radio occultation technique and how engineers use it with GPS satellites to monitor and study the Earth's atmospheric activity.

Students learn that wind and storms can form at the boundaries of interacting high and low pressure air masses. They learn the distinguishing features of the four main types of weather fronts (warm fronts, cold fronts, stationary fronts and occluded fronts) and how these fronts are depicted on a sur...

Students are introduced to the basics of the Earth's weather. Concepts include fundamental causes of common weather phenomena such as temperature changes, wind, clouds, rain and snow. The different factors that affect the weather and the instruments that measure weather data are also addressed.
References
Annenberg Media, Learner.org, Interactives: Weather, "Forecasting," accessed December 12, 2007. http://www.learner.org/exhibits/weather/forecasting.html
Farmer's Almanac, accessed December 14, 2007. http://www.farmersalmanac.com
NASA Ames Research Center, Flight Desk Display Research Laboratory, Implementations, "3D Cockpit Situation Display (CSD)," accessed December 12, 2007. http://human-factors.arc.nasa.gov/groups/FDDRL/technologies/3dcdti.php
National Weather Service Forecast Office, El Paso Office, Kid's Weather, "Experiments," accessed December 14, 2007. http://www.srh.noaa.gov/bmx/?n=kidscorner_weatherexperiments
National Aeronautics and Space Administration, SP-4312 Dreams, Hopes, Realities, "Chapter 5: Exploring the Earth," accessed December 14, 2007. http://history.nasa.gov/SP-4312/ch5.htm
National Oceanic and Atmospheric Administration, accessed December 14, 2007. http://www.crh.noaa.gov/fsd/science/doppler/images/scat.gif
National Oceanic and Atmospheric Administration, accessed August 13, 2014. Radiosonde Observations. http://www.ua.nws.noaa.gov/factsheet.htm
Tarp, Keli. National Oceanic and Atmospheric Administration, "NOAA Provides Expertise For Development Of New Radar Network," accessed December 14, 2007. http://www.noaanews.noaa.gov/stories/s2097.htm
Copyright
© 2007 by Regents of the University of Colorado.Contributors
Lauren Cooper; Malinda Schaefer Zarske; Janet YowellSupporting Program
Integrated Teaching and Learning Program, College of Engineering, University of Colorado BoulderAcknowledgements
The contents of this digital library curriculum were developed under a grant from the Fund for the Improvement of Postsecondary Education (FIPSE), U.S. Department of Education and National Science Foundation GK-12 grant no. 0338326. However, these contents do not necessarily represent the policies of the Department of Education or National Science Foundation, and you should not assume endorsement by the federal government.
Last modified: April 30, 2021


User Comments & Tips