Quick Look
Grade Level: 7 (6-9)
Time Required: 3 hours
(can be split into different sessions)
Lesson Dependency:
Subject Areas: Measurement, Physical Science
NGSS Performance Expectations:

| MS-PS2-2 |

Summary
Based on what students have already learned about friction, they formulate hypotheses concerning the effects of weight and contact area on the amount of friction between two surfaces. In the associated activities (Does Weight Matter? and Does Area Matter?), students design and conduct simple experiments to test their hypotheses, using procedures similar to those used in the previous lesson (Discovering Friction). Their data analyses reveal the importance of weight to normal friction (the friction that occurs as a result of surface roughness) and the importance of surface area to the friction that occurs between smooth surfaces due to molecular attraction. Students also use their data to calculate coefficients of friction for the tested materials and compare these to published values for various materials.Engineering Connection
Engineers must understand how friction affects a number of situations, from the bottom of skis in which friction is a disadvantage to hiking boots where friction provides traction. Scientists must think like engineers when designing experiments as the they do in both of the associated activities.
Learning Objectives
After this lesson, students should be able to:
- Describe the effects of weight on normal friction, that is, the friction due to surface roughness.
- Describe the effects of contact area on the friction that occurs as a result of molecular attraction.
Educational Standards
Each TeachEngineering lesson or activity is correlated to one or more K-12 science,
technology, engineering or math (STEM) educational standards.
All 100,000+ K-12 STEM standards covered in TeachEngineering are collected, maintained and packaged by the Achievement Standards Network (ASN),
a project of D2L (www.achievementstandards.org).
In the ASN, standards are hierarchically structured: first by source; e.g., by state; within source by type; e.g., science or mathematics;
within type by subtype, then by grade, etc.
Each TeachEngineering lesson or activity is correlated to one or more K-12 science, technology, engineering or math (STEM) educational standards.
All 100,000+ K-12 STEM standards covered in TeachEngineering are collected, maintained and packaged by the Achievement Standards Network (ASN), a project of D2L (www.achievementstandards.org).
In the ASN, standards are hierarchically structured: first by source; e.g., by state; within source by type; e.g., science or mathematics; within type by subtype, then by grade, etc.
NGSS: Next Generation Science Standards - Science
| NGSS Performance Expectation | ||
|---|---|---|
|
MS-PS2-2. Plan an investigation to provide evidence that the change in an object's motion depends on the sum of the forces on the object and the mass of the object. (Grades 6 - 8) Do you agree with this alignment? |
||
| Click to view other curriculum aligned to this Performance Expectation | ||
| This lesson focuses on the following Three Dimensional Learning aspects of NGSS: | ||
| Science & Engineering Practices | Disciplinary Core Ideas | Crosscutting Concepts |
| Plan an investigation individually and collaboratively, and in the design: identify independent and dependent variables and controls, what tools are needed to do the gathering, how measurements will be recorded, and how many data are needed to support a claim. Alignment agreement: Science knowledge is based upon logical and conceptual connections between evidence and explanations.Alignment agreement: | The motion of an object is determined by the sum of the forces acting on it; if the total force on the object is not zero, its motion will change. The greater the mass of the object, the greater the force needed to achieve the same change in motion. For any given object, a larger force causes a larger change in motion. Alignment agreement: All positions of objects and the directions of forces and motions must be described in an arbitrarily chosen reference frame and arbitrarily chosen units of size. In order to share information with other people, these choices must also be shared.Alignment agreement: | Explanations of stability and change in natural or designed systems can be constructed by examining the changes over time and forces at different scales. Alignment agreement: |
Common Core State Standards - Math
-
Fluently add, subtract, multiply, and divide multi-digit decimals using the standard algorithm for each operation.
(Grade
6)
More Details
Do you agree with this alignment?
-
Solve real-world and mathematical problems involving area, surface area, and volume.
(Grade
6)
More Details
Do you agree with this alignment?
-
Use ratio and rate reasoning to solve real-world and mathematical problems, e.g., by reasoning about tables of equivalent ratios, tape diagrams, double number line diagrams, or equations.
(Grade
6)
More Details
Do you agree with this alignment?
-
Display numerical data in plots on a number line, including dot plots, histograms, and box plots.
(Grade
6)
More Details
Do you agree with this alignment?
-
Decide whether two quantities are in a proportional relationship, e.g., by testing for equivalent ratios in a table or graphing on a coordinate plane and observing whether the graph is a straight line through the origin.
(Grade
7)
More Details
Do you agree with this alignment?
-
Construct and interpret scatter plots for bivariate measurement data to investigate patterns of association between two quantities. Describe patterns such as clustering, outliers, positive or negative association, linear association, and nonlinear association.
(Grade
8)
More Details
Do you agree with this alignment?
-
Solve linear equations in one variable.
(Grade
8)
More Details
Do you agree with this alignment?
-
Summarize, represent, and interpret data on a single count or measurement variable
(Grades
9 -
12)
More Details
Do you agree with this alignment?
International Technology and Engineering Educators Association - Technology
-
Brainstorming is a group problem-solving design process in which each person in the group presents his or her ideas in an open forum.
(Grades
6 -
8)
More Details
Do you agree with this alignment?
-
Apply the technology and engineering design process.
(Grades
6 -
8)
More Details
Do you agree with this alignment?
State Standards
North Carolina - Math
-
Solve real-world and mathematical problems involving area, surface area, and volume.
(Grade
6)
More Details
Do you agree with this alignment?
-
Use ratio and rate reasoning to solve real-world and mathematical problems, e.g., by reasoning about tables of equivalent ratios, tape diagrams, double number line diagrams, or equations.
(Grade
6)
More Details
Do you agree with this alignment?
-
Display numerical data in plots on a number line, including dot plots, histograms, and box plots.
(Grade
6)
More Details
Do you agree with this alignment?
-
Fluently add, subtract, multiply, and divide multi-digit decimals using the standard algorithm for each operation.
(Grade
6)
More Details
Do you agree with this alignment?
-
Decide whether two quantities are in a proportional relationship, e.g., by testing for equivalent ratios in a table or graphing on a coordinate plane and observing whether the graph is a straight line through the origin.
(Grade
7)
More Details
Do you agree with this alignment?
-
Solve linear equations in one variable.
(Grade
8)
More Details
Do you agree with this alignment?
-
Construct and interpret scatter plots for bivariate measurement data to investigate patterns of association between two quantities. Describe patterns such as clustering, outliers, positive or negative association, linear association, and nonlinear association.
(Grade
8)
More Details
Do you agree with this alignment?
-
Summarize, represent, and interpret data on a single count or measurement variable
(Grades
9 -
12)
More Details
Do you agree with this alignment?
North Carolina - Science
-
Predict the effect of a given force or a change in mass on the motion of an object.
(Grade
5)
More Details
Do you agree with this alignment?
-
Understand motion, the effects of forces on motion and the graphical representations of motion.
(Grade
7)
More Details
Do you agree with this alignment?
-
Explain the effects of balanced and unbalanced forces acting on an object (including friction, gravity and magnets).
(Grade
7)
More Details
Do you agree with this alignment?
-
Understand the relationship between forces and motion.
(Grades
9 -
12)
More Details
Do you agree with this alignment?
-
Classify frictional forces into one of four types: static, sliding, rolling, and fluid.
(Grades
9 -
12)
More Details
Do you agree with this alignment?
-
Explain work in terms of the relationship among the applied force to an object, the resulting displacement of the object and the energy transferred to an object.
(Grades
9 -
12)
More Details
Do you agree with this alignment?
Pre-Req Knowledge
- A familiarity with the information about friction covered in the Discovering Friction lesson, and the experimental method for measuring friction used in the Sliding and Stuttering associated activity.
- Also, it is helpful if students know how to prepare a line graph from data consisting of two variables.
Introduction/Motivation
In the previous lesson (Discovering Friction) and its associated activity (Sliding and Stuttering), students found that friction is a force that impedes motion, and that static friction is greater than kinetic friction. They also found that surface roughness can be an important source of friction, but their experiments should have revealed that a lot of friction could also occur between two very smooth surfaces. The discussion following their experiments should also have raised questions about the roles of weight and contact area in the amount of friction that occurs between two surfaces.To introduce this lesson, remind students of these observations and questions from the previous lesson.
Then, ask them to meet in their groups and formulate two hypotheses. The first hypothesis should state what they think the effect of adding weight to the cup will have as it slides across a surface. Example of such hypotheses might be, "When more weight is added to the cup, more friction will be measured when we slide it across the table," or "Weight will not affect the friction measured." Ask students also to write the reasoning behind their hypotheses. For the first example, students might say, "We think we will measure more friction because the extra weight will make the cup press down on the surface more, so more of the tiny surface bumps will be in contact." For the second example, students might argue that, "Weight will not affect the amount of friction because the same amount of surface on the bottom of the cup will be in contact with the table's surface. We think that to get more friction, more surface area must be in contact."
The second hypothesis each group should make concerns the effect of contact area on the friction measured. Students will probably suggest that, "The more surface area in contact, the more friction we will measure." Their reasoning will most likely be along the lines of, "The more surface area in contact, the more tiny bumps there are to get in each other's way between the two surfaces." Or, if they are familiar with the notion of friction due to molecular attraction, they might also argue that, "The more surface area that is in contact, the more places that exist for molecules of the two surfaces to be attracted to each other."
At this point, you need not discuss their hypotheses or their reasoning. However, do check to see that the explanations they give for their hypotheses are reasonably complete.
Once groups have formulated their hypotheses and explained their reasoning (in writing), let them know that they will be able to test their hypotheses using the same basic method they used in the previous lesson.
Lesson Background and Concepts for Teachers
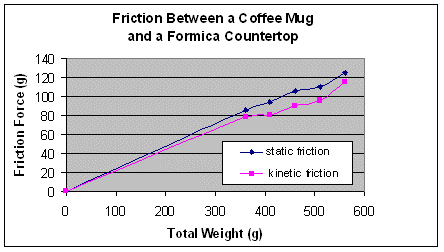
The effects of weight and contact area on friction are complicated because there are two major mechanisms of friction at work. The classical view of friction is that it is caused solely by surface irregularities, called "asperities", and that weight correlates directly with the amount of friction that occurs. Refer to the Does Weight Matter? activity to help students illustrate this correlation. For a single object moving across a single surface, when additional weight is added to the object, the frictional force measured is in direct proportion to its total weight. A graph of the friction measured versus the total weight will produce a reasonably straight line such as the one drawn from student data shown below . This will be true for both static and kinetic friction, although the line for static friction should be a little steeper than the line for kinetic friction.

The slope of the line corresponds to the coefficient of friction for the two particular surfaces involved. In physics and engineering, the coefficient of friction is denoted by the Greek letter mu (μ), followed by either the subscript s or k. Thus, μs and μk represent the coefficients for static and kinetic friction, respectively. The force F needed to overcome friction and set a body of weight W in motion on a flat surface is given by F = μsW. Likewise, once the body is in motion, the force needed to keep it in motion is F = μkW.
Every pair of surfaces has a unique, empirically obtained set of coefficients. For example, dry steel on dry steel has a static coefficient of about 0.6 and a kinetic coefficient of 0.4. When oil or grease is added, the coefficients drop to about 0.1 and 0.05, respectively. These coefficients were obtained by measuring the force needed to move an object made of steel resting on a flat steel surface, and then dividing that force by the weight of the steel object. In other words, the equation given above was rearranged to give μ = F/W.
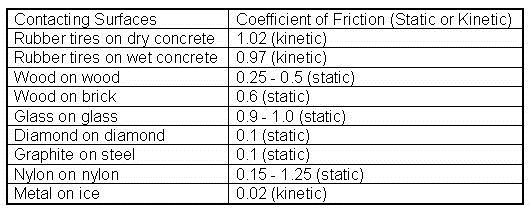
The table below lists some examples of coefficients of friction. Since it is mainly engineers who use these values, most coefficients found in reference materials are related to machinery and automotive applications.

Since the frictional force measured varies in direct proportion to the weight of the object being moved, some physical mechanism must be underlying this observation. Given that this friction is due to surface irregularities, it makes sense that additional weight presses the peaks and valleys of one surface more firmly into the valleys and peaks of the other surface, so more force is required to disengage them and set the body in motion. Similarly, more force is required to keep the body in motion when gravity acting on the added weight tends to re-engage the peaks and valleys.
But what about contact area? How does it affect friction? Returning to the equations for friction given above, F = μsW and F = μkW, we can see that friction only depends on the weight of the object being moved and the coefficient of friction that exists between the two surfaces. The amount of surface area in contact does not appear in the equations anywhere. So, the amount of area in contact does not seem to matter when it comes to friction. Refer to the Does Contact Area Matter? activity to solidify students understanding of this concept.
This might not seem to make sense at first. However, consider that as long as some surface imperfections are present on one or both surfaces, friction will occur. And as long as a few peaks and valleys are getting hung up on each other, it makes no difference if other peaks and valleys are also getting hung up simultaneously—as long as these additional peaks and valleys are not bigger than the original set of some peaks and valleys. The force required to free up any number of peaks and valleys is the force needed to free up the largest of the peaks and valleys. No matter how many smaller peaks and valleys exist, the larger force is enough to free up all of them. The coefficient of friction between two surfaces, because it is empirically derived and based on numerous experiments, reflects the largest peaks and valleys typical of the two surfaces involved. So, as long as the surfaces are relatively uniform, meaning they do not change in microscopic texture from one region to another, the amount of area in contact does not affect the frictional force.
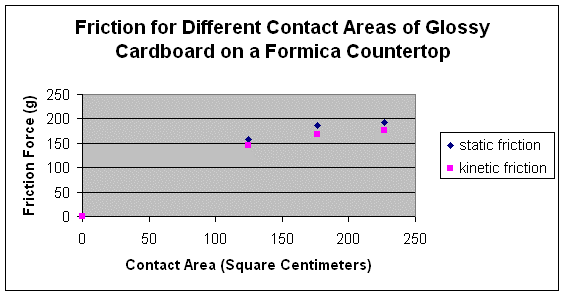
At least that is the theory, and in fact, it holds true for the classical type of friction, sometimes known as "normal" friction, which is the result of surface roughness. However, in the last several decades an entirely new class of very smooth, lightweight, synthetic materials have been invented and manufactured for a variety of applications. And while they may be very smooth, even on a microscopic level, some of these modern materials (mostly plastics) show an astonishing amount of friction. For these materials, the classic view of friction does not apply in its entirety. Although the amount of friction measured can still be affected by weight, friction due to molecular attractions between the two surfaces appears to be just as important. For these materials, the amount of friction that occurs can, in fact, be affected by the amount of surface area in contact, although at this point the nature of the molecular attractions involved is poorly understood. An example of a graph created from student data showing the effects of contact area on friction between two smooth, synthetic surfaces is shown below.

Associated Activities
- Does Weight Matter? - Working in small groups, students design and conduct simple experiments to test for the effects of weight on friction.
- Does Contact Area Matter? - In small teams, students design and conduct simple experiments to test for the effects of contact area on friction.
Lesson Closure
Also, have students calculate the coefficients of friction between surfaces they tested using the method explained in the Lesson Background & Concepts for Teachers section. Show students a copy of the coefficients of friction table included in this section for comparison. Be sure to point out how the coefficient of friction between a car's tires and the pavement is reduced when the pavement is wet, which is why smart (and safe) drivers slow down on wet roads to avoid skidding. Advise students to remember this fact after they get their driving licenses!
Students may find some of the other friction coefficients surprising, such as the comparison between glass and diamond. Ask the students to speculate on why these two materials, which are similar in appearance, have such different coefficients of friction. They might want to do a little research in an effort to find out why. They should easily be able to find information about what these materials are made of, but it is unlikely they will be able to find out much about how they behave with respect to friction. Point out to students that many aspects of friction are still poorly understood and are being researched by scientists and engineers throughout the world. Nevertheless, the similarities and differences between glass and diamond are such that students should be able to come up with some plausible explanations, or hypotheses, especially since they are armed with knowledge about the importance of molecular attractions in smooth-surface friction.
Vocabulary/Definitions
coefficient of friction: An empirically derived quantity for a pair of surfaces that is equal to the amount of friction measured divided by the weight of the object being moved.
frictionA: A resistance to motion that occurs when two surfaces are in contact with each other.
kinetic friction: The resistance to motion that occurs once one surface is in motion, sliding against another surface.
static friction: The resistance to motion that must be overcome in order to allow one surface to begin sliding against another surface.
Assessment
Writing: Ask students to individually write paragraphs explaining how and why weight affects normal friction, and how and why contact area affects friction due to molecular attraction.
Calculations: Give students some data consisting of the weights and frictional forces measured for several pairs of surfaces, and ask them to calculate the coefficient of friction of each.
Lesson Extension Activities
Rolling friction is another type of friction, and it is generally much lower than the sliding friction students experimented with in this and the previous lesson. Have students conduct additional research, both in the form of library/internet research and experimental research, to learn about this type of friction.
Subscribe
Get the inside scoop on all things TeachEngineering such as new site features, curriculum updates, video releases, and more by signing up for our newsletter!More Curriculum Like This

With a simple demonstration activity, students are introduced to the concept of friction as a force that impedes motion when two surfaces are in contact. Then, in the associated activity, Sliding and Stuttering, they work in teams to use a spring scale to drag an object such as a ceramic coffee cup ...

High school students learn how engineers mathematically design roller coaster paths using the approach that a curved path can be approximated by a sequence of many short inclines. They apply basic calculus and the work-energy theorem for non-conservative forces to quantify the friction along a curve...

In this hands-on activity, students learn about two types of friction — static and kinetic — and the equation that governs them. They also measure the coefficient of static friction and the coefficient of kinetic friction experimentally.

Students learn about two types of friction—static and kinetic—and the equation that governs them. They also measure the coefficient of static friction experimentally.
Copyright
© 2013 by Regents of the University of Colorado; original © 2004 Duke UniversityContributors
Mary R. HebrankSupporting Program
Techtronics Program, Pratt School of Engineering, Duke UniversityAcknowledgements
This content was developed by the MUSIC (Math Understanding through Science Integrated with Curriculum) Program in the Pratt School of Engineering at Duke University under National Science Foundation GK-12 grant no. DGE 0338262. However, these contents do not necessarily represent the policies of the NSF, and you should not assume endorsement by the federal government.
This lesson and its associated activity were originally published, in slightly modified form, by Duke University's Center for Inquiry Based Learning (CIBL). Please visit the http://ciblearning.org/ website for information about CIBL and other resources for K-12 science and math teachers.
Last modified: June 7, 2019


User Comments & Tips