Quick Look
Grade Level: 10 (10-11)
Time Required: 45 minutes
Expendable Cost/Group: US $0.00
Group Size: 3
Activity Dependency: None
Subject Areas: Chemistry, Data Analysis and Probability
NGSS Performance Expectations:

| HS-PS1-1 |

Summary
The Periodic Table is an icon of organizing for chemistry as well as other disciplines including chemical engineering. The table also represents an important way to understand how to sort and identify objects based on specific criteria. In this activity, students submit a picture of a unique “one-of-a-kind” item they own. They then create diagrams that sort these various items based on categories of their choosing. They discuss the process as a class, drawing upon similarities to the creation of the Periodic Table: identifying individual characteristics of an object/element, and sorting objects/elements into rows and columns based on similar characteristics.Engineering Connection
Sorting objects by specific criteria is a fundamental engineering skill, which is paired here with the scientific concepts in the Periodic Table. Using the Periodic Table as a model for categorizing and sorting objects, students can develop critical thinking and problem-solving skills. This process is commonly found in everyday engineering, such as product design, where engineers identify and sort different materials based on their properties and functions. In chemistry for example, substances may be classified by viscosity, reactivity, toxicity, etc. The Periodic Table provides a useful model for this process, with elements sorted into groups based on similar properties.
Learning Objectives
After this activity, students should be able to:
- Describe the basic shape of the Periodic Table using appropriate vocabulary.
- Identify and explain the information contained in a single square on the Periodic Table.
- Explain how elements are categorized, based on their locations on the Periodic Table.
- Predict characteristics of an element based on its location on the Periodic Table.
Educational Standards
Each TeachEngineering lesson or activity is correlated to one or more K-12 science,
technology, engineering or math (STEM) educational standards.
All 100,000+ K-12 STEM standards covered in TeachEngineering are collected, maintained and packaged by the Achievement Standards Network (ASN),
a project of D2L (www.achievementstandards.org).
In the ASN, standards are hierarchically structured: first by source; e.g., by state; within source by type; e.g., science or mathematics;
within type by subtype, then by grade, etc.
Each TeachEngineering lesson or activity is correlated to one or more K-12 science, technology, engineering or math (STEM) educational standards.
All 100,000+ K-12 STEM standards covered in TeachEngineering are collected, maintained and packaged by the Achievement Standards Network (ASN), a project of D2L (www.achievementstandards.org).
In the ASN, standards are hierarchically structured: first by source; e.g., by state; within source by type; e.g., science or mathematics; within type by subtype, then by grade, etc.
NGSS: Next Generation Science Standards - Science
| NGSS Performance Expectation | ||
|---|---|---|
|
HS-PS1-1. Use the periodic table as a model to predict the relative properties of elements based on the patterns of electrons in the outermost energy level of atoms. (Grades 9 - 12) Do you agree with this alignment? |
||
| Click to view other curriculum aligned to this Performance Expectation | ||
| This activity focuses on the following Three Dimensional Learning aspects of NGSS: | ||
| Science & Engineering Practices | Disciplinary Core Ideas | Crosscutting Concepts |
| Use a model to predict the relationships between systems or between components of a system. Alignment agreement: | Each atom has a charged substructure consisting of a nucleus, which is made of protons and neutrons, surrounded by electrons. Alignment agreement: The periodic table orders elements horizontally by the number of protons in the atom's nucleus and places those with similar chemical properties in columns. The repeating patterns of this table reflect patterns of outer electron states.Alignment agreement: | Different patterns may be observed at each of the scales at which a system is studied and can provide evidence for causality in explanations of phenomena. Alignment agreement: |
State Standards
California - Science
-
Use the periodic table as a model to predict the relative properties of elements based on the patterns of electrons in the outermost energy level of atoms.
(Grades
9 -
12)
More Details
Do you agree with this alignment?
Materials List
For the homework assignment, each student needs:
- image of a personal, one-of-a-kind object of their choosing
- An electronic device capable of taking photos and submitting online work
For the group activity, each group needs:
- whiteboard markers
- large whiteboard (Recommended size: 1 m x 0.6 m)
- 15 pictures of one-of-a-kind objects (see Before the Activity)
- paper clip (used to bind the pictures of objects)
- Intro to the Periodic Table Worksheet, 1 per student
- An electronic device capable to taking photos and submitting online work
Worksheets and Attachments
Visit [www.teachengineering.org/activities/view/ucb-2791-periodic-table-intro-elements-activity] to print or download.Pre-Req Knowledge
- Students should know the three subatomic particles of an atom (proton, electron, neutron), and how these particles contribute to an atom’s overall mass or charge.
- Students should know that the number of protons determines the element of a given atom.
Introduction/Motivation
[Show the Sorting Activity Slides PowerPoint, Slide 4.]

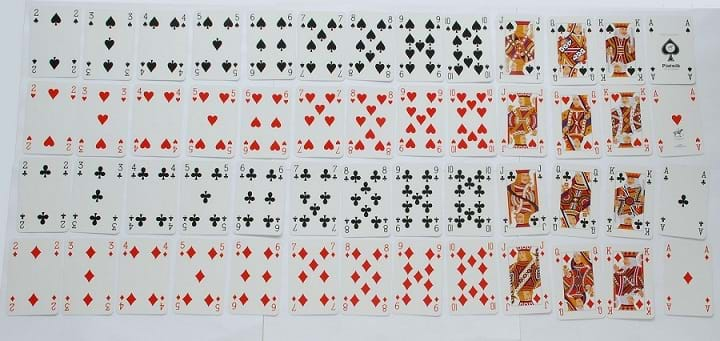
If you were given a bunch of objects, say a deck of cards, how would you go about sorting them? You could start by noticing what makes each card different from one another, such as the number/face value or the suit of the card. While you could just have four piles of cards (one for each suit), each pile would have the same numbers and face values, which makes these cards similar to each other rather than completely unique. This can be visualized by sorting by suit and value: laying out one suit in a particular order (say, ace to king), then laying out another suit below it in the same order, and so on. The resulting table organizes the cards using both characteristics: cards along the same row have the same suit, and cards along the same column have the same value. This organization also helps predict the characteristics of an unknown: say if a card was missing, and there was an empty spot in the table, you could use the adjacent cards to predict the characteristics of the missing card.
In chemistry, such organization can be found in the Periodic Table of elements. While individual elements have unique characteristics recorded in a single square (element name, number of protons, average atomic mass, etc.), additional information can be found based on where the element is placed on the Periodic Table. For example, an element in the second row has two energy levels for electrons, and an element in the eighteenth column has eight valence electrons. While not explicitly written, these characteristics are shown visually based on the overall structure of the Periodic Table. This activity serves as an introduction to the Periodic Table, with the objective being to understand and appreciate this type of organization.
Procedure
Background
The modern Periodic Table of Elements widely used today was first proposed by Dmitri Mendeleev around 1869. Useful information about a given element - atomic number, average atomic mass, valence electrons - can be identified by finding it on the Periodic Table. However, this predates the discovery of any subatomic particle, meaning such information could not have been used to sort elements. Instead, it’s likely that physical properties (what the elements look like) and chemical properties (reactivity, or what the elements do) were used to categorize elements.
These categories exist for a given row (period) or column (group) on the Periodic Table. It was later determined that elements in the same period contain the same number of energy levels for electrons, and that elements in the same group contain the same number of valence (outermost) electrons. This would help explain the physical and chemical properties that were once observed centuries ago. While this vocabulary is unknown to students at this time, the main purpose of this activity is to show how data can be sorted with categories across and down a table.
Also, at the time Mendeleev proposed this table, only 63 elements were known at the time. This means that his table had empty spaces for “missing” undiscovered elements. However, based on how Mendeleev sorted the known elements, he was able to predict the properties of these missing elements, which were later confirmed when discovered by other scientists.
Before the Activity
- Assign homework where students submit an image of their own one-of-a-kind object.
- Print and cut student-submitted images from the homework assignment (make multiple copies of each image).
- Each group should have 1 set of ~15 images bound together with a paper clip. Each set should have the same images.
- Retain about half of the student-submitted images (do not add them into the group sets). Prepare to show these images in Part 3 of the activity.
- Gather other materials as needed.
With the Students
Part 1
- Divide the class into groups of four. Hand out a large whiteboard and marker to each group.
- As appropriate, review how to organize data into a Carroll diagram by showing Slide 5 of the Sorting Activity Slides presentation.
- Show Slides 6-8. To practice, have them copy the categories of the table on Slide 8, then fill in the table with appropriate information (the example used in class: “Numbered Playing Card” and “Face Card” categories along the top, “Black Suit” and “Red Suit” as categories along the left side).
- As a check for understanding, you can say a random card, and have groups explain where it would be placed in the table (ex: three of clubs, queen of hearts, as a challenge - Joker)
Part 2
- Pass out copies of the Intro to the Periodic Table Worksheet and a set of images to each group.
- Tell students that they will first brainstorm categories to sort the objects into. Tell students that brainstorming (or imagining possible solutions) is part of the Engineering Design Process. Give students 2-3 minutes to select two objects and develop categories for them as outlined on the Worksheet.
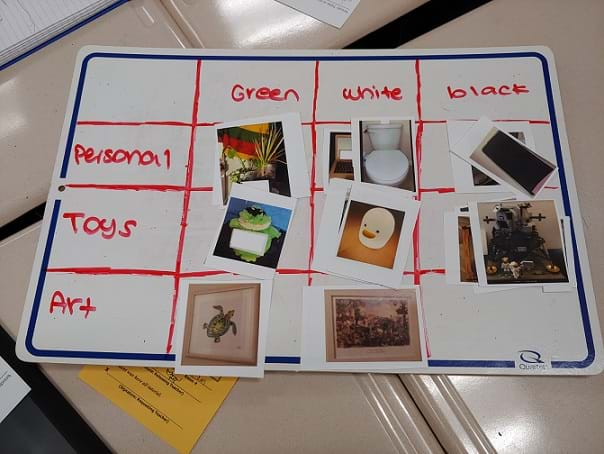
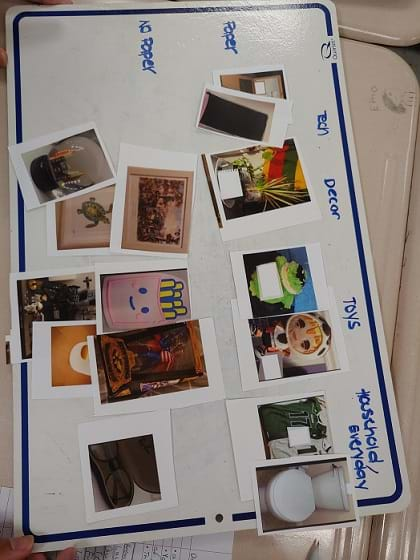
- Show Slide 9 of the Sorting Activity Slides presentation. Instruct the class that they have 12 minutes to sort all of the images into a Carroll Diagram. They may choose the categories (and the number of categories) to work with, but a “misc./other” category is not allowed.
- Be sure to walk around the room as groups complete the activity. You may need to clarify what some of the objects are. If groups seem to be stuck, you can ask questions that would get them thinking about materials or properties (“What does it look like it’s made of?” “What would your fellow classmate be doing with this item?”)
- Tell students that it’s alright if they revise their diagram or categories many times. Remind them that engineers go through the process of Creating a Solution, Testing the Solution, and Improving the Solution many times as they work through the Engineering Design Process.
- If groups finish in under 12 minutes, have them check with you before submitting a photo of their diagram. As an extra activity, tell them the paper clip is an additional object, and see if it can be readily added to their diagram.


Part 3
- Show slide 10 of the Sorting Activity Slides presentation. For the class discussion, present one table that students submitted, and have that group explain their process.
- If groups were stuck on one (or a few) items, encourage discussion by asking for ways to analyze that object: what it is, what it might be made from, what someone could use it for, etc. Student answers are potential categories when sorting into the Carroll Diagram. Remind students they are Improving their Designs, which is an important part of the Engineering Design Process.
- After enough groups have shared, ask the class how many times they changed their diagram (adding/modifying/removing a category, moving an image to a different section, etc.) This is a good time to share the paper clip as an additional object, so that all groups can think about this.
- Ask the class if they think their diagram is “complete” or if there is data missing (There is data missing! The other half of class images weren’t used).
- Show the retained images. Ask the class how their diagrams could be modified to account for these images, especially because they don’t know what they all are.
Part 4
- Introduce the topic of the Periodic Table and the story of Mendeleev by showing Slides 11-13 of the Sorting Activity Slides presentation. Hold a class discussion and have students relate Mendeleev’s process to their own throughout the activity.
- Introduce basic structure of the Periodic Table as shown on Slide 14: the “bold staircase” that separates metals and nonmetals, rows (periods), and columns (groups). You could also show students the Periodic Table Reference attachment.
- Discuss with students one element of the Periodic Table and explain all pieces of information contained in that square: the atomic number, the chemical symbol, the element name, and the average atomic mass. Slide 15 contains a blank square to show students.
- Further connect the activity to the Periodic Table by showing students Slides 16-17. Have students follow along by completing the Intro to the Periodic Table Worksheet. Note: Slide 17 contains a video, Alkali Metals Reacting with Water: https://www.youtube.com/watch?v=jI__JY7pqOM.
Vocabulary/Definitions
atomic number: The number of protons in an atom, determining the element. On the Periodic Table, elements are sorted by increasing atomic number.
average atomic mass: The weighted average mass of the atoms in a naturally occurring sample of the element.
chemical symbol: The abbreviation for a chemical element. It is only one or two letters.
group: A column of chemical elements on the Periodic Table.
isotope: Two (or more) atoms with the same atomic number, but with different masses due to a different number of neutrons in the nucleus.
metal: A substance with high electrical conductivity, luster, and malleability, which readily loses electrons to form positive ions. They are typically on the left side of the Periodic Table.
metalloid: A chemical element with properties between that of metals and nonmetals. They are typically near the bolded staircase on the Periodic Table.
nonmetal: A chemical element that lacks the characteristics of a metal. They are typically on the right side of the Periodic Table.
period: A row of chemical elements on the Periodic Table.
Periodic Table: A table of the chemical elements arranged in order of atomic number, usually in rows, so that elements with similar atomic structure (and hence similar chemical properties) appear in vertical columns.
Assessment
Pre-Activity Assessment
Brainstorming: In pairs and/or groups, have students think of items that contain the name of an element (2 examples are provided in Slide 2 of the Sorting Activity Slides presentation: unleaded gasoline & lithium-ion batteries). There are lots of correct answers; creative answers are encouraged. If groups are struggling, you can provide hints (“night lights” for Neon, “eating utensils” for silverware, etc.) Groups then share one at a time to generate a class list of items (the teacher writes out the list on Slide 3 of the Sorting Activity Slides presentation, underlining elements to indicate an acceptable answer). The idea of taking turns gives groups time to think of any more items if needed. Once the list is finished, ask students, “Are these objects pure? What I mean is, even though an element is in the item’s name, is it solely made of that element?” (Answers may vary, depending on the objects on the list. Possible answers: unleaded gasoline has no lead in it, silverware may at one point have been purely silver, neon lights are made of more things like the glass and the metal wire.) This is to get students to acknowledge the need for multiple elements, as their differences in properties serve different needs as outlined by engineers and creators.
Activity Embedded (Formative) Assessment
Group Check: During the sorting activity, group members are engaged in discussion, as they prepare to share their diagram and explain their thinking. Ensure that each group member contributes to the discussion.
Hypothesize: If groups finish early, you can have more pictures of items handy, and ask if these items can be readily sorted, or if further modifications have to be made.
Post-Activity (Summative) Assessment
Presentations: Groups present their diagrams to the class (groups may take a picture of their completed diagram and send it to the teacher, so that it may be presented to the class). Encourage groups to explain their thinking, highlights of their discussion, and anything they wish to share about performing this activity.
Hypothesize: Present the additional items (the same ones that were shown to earlier groups), and ask how they would place them into their diagrams. You can focus on one item at a time, first asking for characteristics and observations of the item before sorting it.
Summative Assessment: Later, give students the Periodic Table Quiz. This is a short quiz based on the information contained on a single square on the Periodic Table, and the basic shape of the Periodic Table (metals and nonmetals, periods, and groups).
Making Sense Assessment: Have students reflect on the science concepts they explored and/or the science and engineering skills they used by completing the Making Sense Assessment.
Investigating Questions
How can information be conveyed through the placement of data? Can additional information be shown based on how data is organized? (Example answer: Placing data in a table like a Carroll diagram can convey information about the data. Based on how the data is organized, you can see if a datum is similar to or different from other data.)
Troubleshooting Tips
Be prepared with guiding questions as groups may have difficulty sorting objects. Encourage them to think about what the objects could be made from, what they could be used for, or any other features they see. Then ask if what they identified could also be applied to a different object.
Emphasize how there is no correct answer to this activity! Different diagrams from the same data are expected and encouraged, as the true objective is analyzing student thinking and their thought process. Remind students that brainstorming (or imagining possible solutions) is part of the Engineering Design Process. Before Mendeleev there were already different attempts at organizing elements.
This activity can also work completely digitally if pictures are added to Google slide or Jamboard. Then each group can make a copy and work off it.
You can combine real student submissions with objects from other sources (Google, your own objects, objects from other class periods, etc.).
Activity Extensions
Students can reattempt the activity with objects from another class period.
Students can reattempt the activity but focus on ordering objects by one variable (e.g. least to most expensive, smallest to largest).
If similar objects were submitted (such as various stuffed bears), then the topic of isotopes could be introduced/discussed (as it doesn’t feel necessary to have separate entries for each stuffed bear).
At the end of the activity, students can describe other objects that could be placed into their diagrams.
At the end of the activity, unshared diagrams can be modified by removing category labels. The class can see the diagram and try to guess the category labels.
As a culminating research project, students can select an object and research its elemental composition, identifying key elements and compounds in its manufacturing. Further research would include the characteristics and properties of each element to explain the presence of each element in that object. By examining the composition and properties of the elements in these devices, students can gain insight into the design choices that go into its creation. This type of research project is highly relevant to the field of engineering, such materials science, civil engineering, medicine, and nanotechnology. Through this extension, students can gain a deeper understanding of the relationship between object properties, manufacturing processes, and engineering design. (See the Elemental Hype Poster Instructions + Examples for instructions and student examples)
Activity Scaling
For students in lower grades: pictures can be curated to avoid abstract objects and categories. If a group finishes early and is willing, they can share first, then give time for other groups to modify their own.
For advanced students, suggest a characteristic that can be quantified. This can be literally seen on the object (such as number of holes) or estimated and ranked (“beauty” on a scale of 1-100). This can better lead to the concept that “gaps” can appear in the table and that newer objects can be placed in between existing objects.
Additional Multimedia Support
- Alkali Metals Reacting with Water video – Shows three elements in the same group on the Periodic Table reacting similarly with water.
- The Periodic Table: Crash Course Chemistry – Depicts the story of Mendeleev sorting the elements to create the modern Periodic Table. Also includes vocabulary for the various groups and sections found in the Periodic Table.
- https://phet.colorado.edu/en/simulations/build-an-atom - Combines visual representations of an atom with the visual of the Periodic Table. This helps students connect properties of an atom to its position.
Subscribe
Get the inside scoop on all things TeachEngineering such as new site features, curriculum updates, video releases, and more by signing up for our newsletter!More Curriculum Like This

Students examine the periodic table and the properties of elements. They learn the basic definition of an element and the 18 elements that compose most of the matter in the universe. The periodic table is described as one method of organization for the elements.

Learn the basics of the analysis of forces engineers perform at the truss joints to calculate the strength of a truss bridge known as the “method of joints.” Find the tensions and compressions to solve systems of linear equations where the size depends on the number of elements and nodes in the trus...

Students learn about the periodic table and how pervasive the elements are in our daily lives. Acting as computer and animation engineers, students creatively express their new knowledge by creating a superhero character based on of the elements they now know so well.
References
Allen, David. Finding the periodic table. 2022. Royal Society of Chemistry. https://www.rsc.org/news-events/features/2019/jan/finding-the-periodic-table/
Copyright
© 2023 by Regents of the University of Colorado; original © 2021 UC BerkeleyContributors
Erone CaoSupporting Program
UC Berkeley Engineering Research Experiences for Teachers (BERET+D)Acknowledgements
This curriculum was based upon work supported by the National Science Foundation under RET grant no. EEC grant no. 1855308— Research Experiences for Teachers (BERET+D) and CalTeach at the University of California Berkeley. Any opinions, findings, and conclusions, or recommendations expressed in this material are those of the authors and do not necessarily reflect the views of the National Science Foundation.
Last modified: October 4, 2023


User Comments & Tips