
Temperature Tells All! Model House Testing for Clean vs. Warm Air
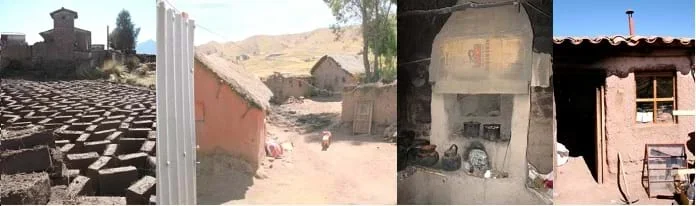 Example typical homes, building materials and stoves in an Andean community in rural Peru.
Through this activity experimentation, students see the challenging trade-off between airtight houses that better hold in heat (resulting in warm, smoky houses) and well-ventilated houses that cool off faster (resulting in chilly houses with good indoor air quality). To begin, students are introduced to the health risks caused by cooking and heating with inefficient cook stoves inside homes, a common practice in rural developing communities. Students simulate the cook stove scenario and use the engineering design process steps, including iterative trials, to increase warmth inside a building while reducing air quality issues. A student worksheet guides students through data collection, calculations, graphing and analysis of their findings—including an introduction to the concept of slope. An introductory slide presentation is also provided.
Air quality and its public health impact is a concern for environmental engineers. Some environmental engineers work with developing communities to design appropriate and sustainable technologies using local materials to improve people's quality of life.
After this activity, students should be able to:
- Explain the health risks of heating and cooking indoors with inefficient cook stoves and how engineers can help improve indoor air quality in developing communities.
- Based on the results from trial iterations, make decisions that improve a design.
- Create an x- and y- line graph showing the relationship between two variables.
- Identify maximum and minimum values on a line graph.
- Identify maximum and minimum rates of change based on the steepness of the line on the line graph (introduction to slope).
- 5.4.2.a Graph points on the coordinate plane to solve real-world and mathematical problems.
Grade 5
Do you agree with this alignment? - 6.2.2.g Represent and analyze quantitative relationships between dependent and independent variables.
Grade 6
Do you agree with this alignment? - 5.3.1 Visual displays are used to interpret data.
Grade 5
Do you agree with this alignment?
- Earth and Sun provide a diversity of renewable and nonrenewable resources
Grade 5
Do you agree with this alignment? - Weather conditions change because of the uneven heating of Earth's surface by the Sun's energy. Weather changes are measured by differences in temperature, air pressure, wind and water in the atmosphere and type of precipitation
Grade 5
Do you agree with this alignment?
- CCSS.Math.Content.5.G.A.2 Represent real world and mathematical problems by graphing points in the first quadrant of the coordinate plane, and interpret coordinate values of points in the context of the situation.
Grade 5
Do you agree with this alignment? - CCSS.Math.Content.5.MD.B Represent and interpret data.
Grade 5
Do you agree with this alignment? - CCSS.Math.Content.6.EE.C Represent and analyze quantitative relationships between dependent and independent variables.
Grade 6
Do you agree with this alignment? - CCSS.Math.Practice.MP2 Reason abstractly and quantitatively.
Grades K-12
Do you agree with this alignment? - CCSS.Math.Practice.MP4 Model with mathematics.
Grades K-12
Do you agree with this alignment?
- Students will develop an understanding of the effects of technology on the environment.
Grades K-12
Do you agree with this alignment? - Students will develop an understanding of the role of society in the development and use of technology.
Grades K-12
Do you agree with this alignment? - Students will develop an understanding of the attributes of design.
Grades K-12
Do you agree with this alignment? - Students will develop an understanding of engineering design.
Grades K-12
Do you agree with this alignment? - Students will develop abilities to apply the design process.
Grades K-12
Do you agree with this alignment? - The process of experimentation, which is common in science, can also be used to solve technological problems.
Grades 3-5
Do you agree with this alignment?
- 3-5-ETS1-3 Plan and carry out fair tests in which variables are controlled and failure points are considered to identify aspects of a model or prototype that can be improved.
Grades 3-5
This resource focuses on the following Three Dimensional Learning aspects of NGSS:
Science & Engineering Practices- Plan and conduct an investigation collaboratively to produce data to serve as the basis for evidence, using fair tests in which variables are controlled and the number of trials considered.Do you agree with this alignment?
Disciplinary Core Ideas- Tests are often designed to identify failure points or difficulties, which suggest the elements of the design that need to be improved.Do you agree with this alignment?
- Different solutions need to be tested in order to determine which of them best solves the problem, given the criteria and the constraints.Do you agree with this alignment?
Do you agree with this alignment? - Plan and conduct an investigation collaboratively to produce data to serve as the basis for evidence, using fair tests in which variables are controlled and the number of trials considered.
- MS-ETS1-2 Evaluate competing design solutions using a systematic process to determine how well they meet the criteria and constraints of the problem.
Grades 6-8
This resource focuses on the following Three Dimensional Learning aspects of NGSS:
Science & Engineering Practices- Evaluate competing design solutions based on jointly developed and agreed-upon design criteria.Do you agree with this alignment?
Disciplinary Core Ideas- There are systematic processes for evaluating solutions with respect to how well they meet the criteria and constraints of a problem.Do you agree with this alignment?
Do you agree with this alignment? - Evaluate competing design solutions based on jointly developed and agreed-upon design criteria.
- MS-ETS1-4 Develop a model to generate data for iterative testing and modification of a proposed object, tool, or process such that an optimal design can be achieved.
Grades 6-8
This resource focuses on the following Three Dimensional Learning aspects of NGSS:
Science & Engineering Practices- Develop a model to generate data to test ideas about designed systems, including those representing inputs and outputs.Do you agree with this alignment?
Disciplinary Core Ideas- Models of all kinds are important for testing solutions.Do you agree with this alignment?
- The iterative process of testing the most promising solutions and modifying what is proposed on the basis of the test results leads to greater refinement and ultimately to an optimal solution.Do you agree with this alignment?
Do you agree with this alignment? - Develop a model to generate data to test ideas about designed systems, including those representing inputs and outputs.
Each group needs:
- grass, straw or hay; enough to cover a few "model house" roofs
- aluminum foil disposable pan or ~2 feet heavy duty aluminum foil
- Popsicle or craft sticks
- string or twine, 2 feet
- Temperature vs. Time Worksheet (PDF)
- scissors
To share with the entire class:
- large fan
- bucket or cooler of ice
- heat lamp with 100-watt bulb
- 2 temperature probes/thermometers with digital readout
- lighter or matches
- testing platform, such as a ~2 x 2-foot cardboard box
- 6-10 sticks of incense; more if groups test multiple times
- matches or lighter
- hot glue and/or duct tape
- transparent plastic film, such as from a clear plastic bag; sized to fit over window opening(s)
- roll of masking tape
- utility knife or box cutter (for teacher use only)
- pre-constructed model house composed of four foamcore board sheets each 13-in wide x 13-in long x 10-13-in high
- stopwatch
- (optional) computer and projector to show the class the Temperature Tells All Presentation (PPTX), a PowerPoint® file
Some graphing experience.
Imagine you wake up early one morning, and it is below freezing outside. You think to yourself, "Brrr, it is so cold. I'll turn up the heater or take a hot shower to warm up." But, guess what? You have no electricity or gas, or running water for that matter. Well then, how are you supposed to warm up? This is not an uncommon situation for many families in communities around the world—specifically, people in rural or developing communities, or places with no access to electricity, running water, or a way to get rid of waste and trash (such as a sewer system). In fact, in order to heat up their houses, it is common for families to use open fires (similar to campfires) or stoves without chimneys to burn wood or sometimes dried cow dung because it is their only source of fuel.
When the weather is very cold, families reduce the amount of heat that escapes the house by sealing up gaps and holes in the house or use their stoves and fires more frequently (which in turn emits more smoke inside the house). But what happens when you seal up your house and make a fire inside to heat it? Where does the smoke go? Unfortunately, the smoke from fires and stoves fills up the house, causing family members to become sick from the components in the smoke. Since they spend most days inside staying warm and cooking, it is often the mothers and young children in these households who get sick more frequently than the fathers and older children. Illnesses from fire/stove smoke can include asthma, bronchitis and other serious respiratory (lung) problems. Sometimes, in the most severe situation, death occurs.
When families build their homes, they use many different types of materials for construction. The best materials to use are those that are better at keeping the heat inside the house for longer periods of time; in other words, they are good at "insulating" the house. Insulating materials are those that keep the indoor temperature from changing, which means that things meant to be cold stay cold, and things meant to be warm stay warm. Materials used for constructing houses around the world include adobe (clay and straw mixture), wood, metal, animal hides (teepees), snow (igloos), and even found objects such as tar paper, billboard/sign canvas, wooden shipping pallets, and 55-gallon drums.
Engineers help families in developing communities in many ways. For instance, they design new ways to heat homes, such as through the use of passive solar heating (using the sun to heat homes and water) and inventing improved stoves for heating and cooking so that the smoke leaves the house through a chimney and does not remain in the living space where people breathe it.
This activity uses the engineering design process to look at some of the different materials people use to construct their homes in developing communities and investigates how well those materials work at holding heat inside the house when it is cold outside. Because heated air expands and rises, the focus is on designing a roof that keeps the heat inside the house for as long as possible. In addition to a focus on keeping heat in the house, we analyze how much smoke collects in the house. From this information, we can make qualitative judgments about the inside air quality by looking into the house through the window. After the first round of designing and testing a roof, we make improvements to the roof to hold the heat in for even longer while still reducing the amount of smoke in the house.
Background
This experimental activity procedure illustrates to students the trade-off between airtight houses that better hold in heat (resulting in warm but smoky houses) and well-ventilated houses that cool off faster (resulting in chilly houses with good indoor air quality). This activity is designed to show students how different materials used in roofs and houses vary in retaining heat inside a model house while the house is heating (while they are using a stove) and after the heat source has gone (after they stop using a stove).
- Students measure temperature every 20 seconds over three minutes of heating and every 20 seconds over three minutes after the heat lamp has been turned off.
- At the same time, students measure the temperature outside the house (between the house and a fan blowing cool air) to see the difference between the indoor and outdoor temperatures.
- Additionally, smoke from a stove is simulated by a burning incense stick placed inside the house while the heat lamp is on, then removed when the heat lamp is turned off, showing how much smoke leaks out of the house during the course of cooling.
Before the Activity
- Gather materials and make copies of the Temperature vs. Time Worksheet (PDF), one per student.
- Construct the house "platform" from an overturned cardboard box (see Figure 1). Use a utility knife or box cutter to cut three holes in the bottom of the box:
- A hole large enough to place the heat lamp in so that the rim of the lamp sits flush with the surface of the box. Run the cord to the lamp out the bottom of the box so that the lamp can easily be plugged/unplugged (this method may be used for turning the lamp on and off).
- A second hole for the temperature probe/thermometer. Be careful not to cut the hole too large; you want the probe to fit snuggly. Use tape to ensure the probe does not slip through the bottom.
- A small hole for the incense to sit in; use tape to secure it as necessary.
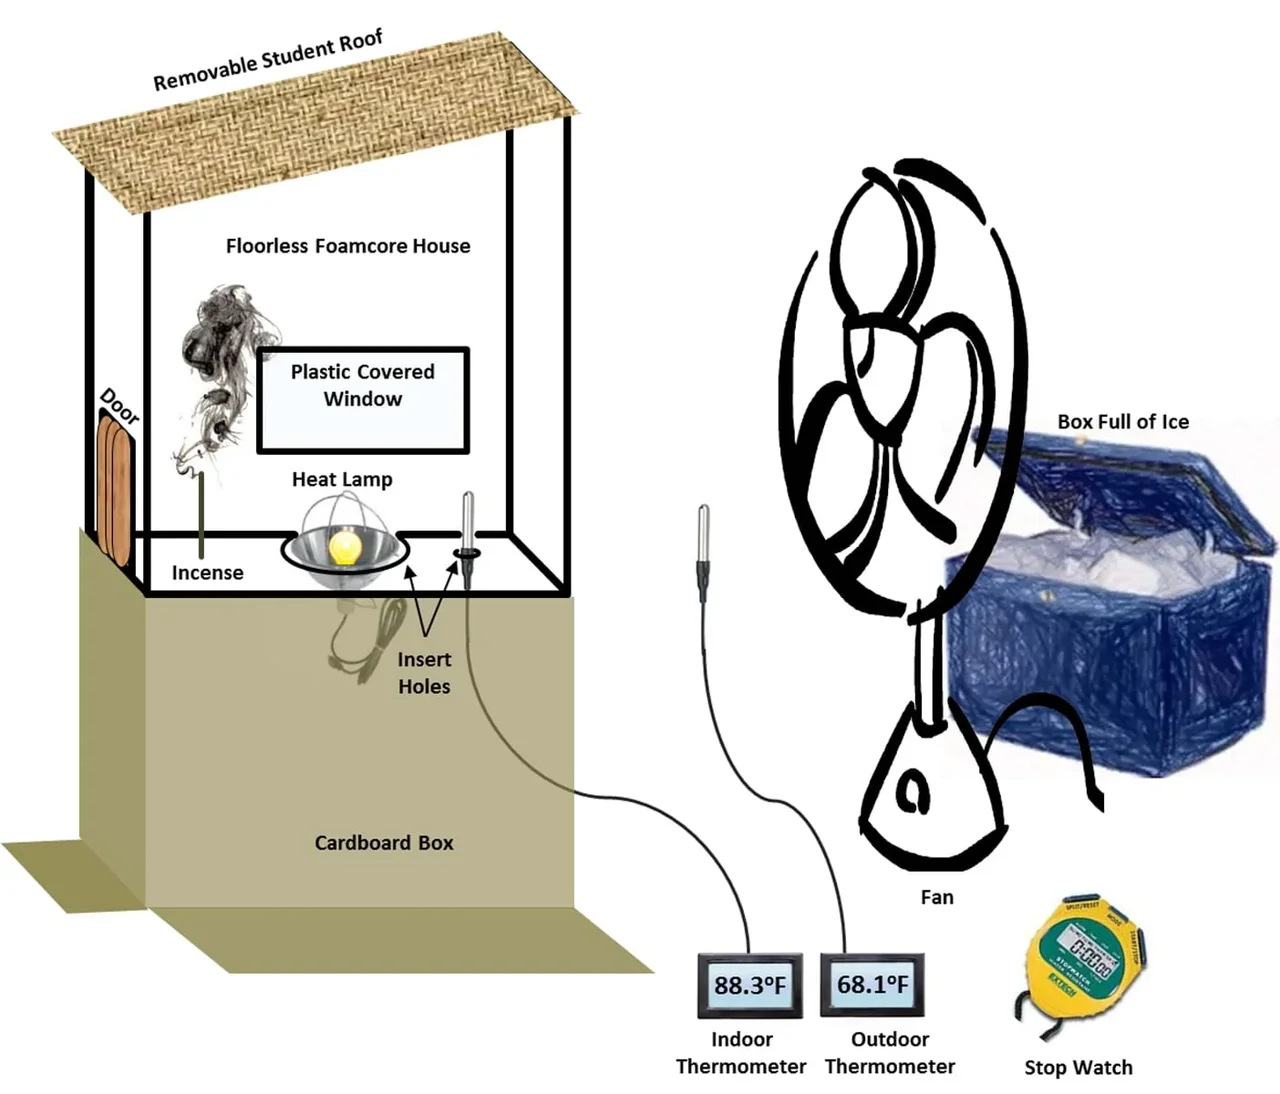 Figure 1: A diagram of the activity setup.Copyright 2011 Odessa Gomez, ITL Program University of Colorado Boulder
- Construct the foamcore model house with the components described below (see Figure 2):
- Four walls (no roof; students will construct the roofs) and no floor (so that the house can be placed on the platform over the heat lamp, thermometer and burning incense stick). Use either hot glue or duct tape to attach the four walls to each other. Suggested model house dimensions: base ~13 x 13-in, minimum height ~10-in (floor to roof), maximum height ~13-in (floor to roof).
- Add at least one window opening that is covered in plastic film in one wall of the house so that students can look inside the house and watch how the smoke concentration changes over time.
- A front door made of cardboard or wooden craft sticks that opens and closes (use tape as hinge and handle).
- Fill any remaining gaps with masking tape.
- Note the house dimensions so you can provide them to students when constructing the roof. For example, tell them that the roof needs to be at least 14-in wide by 14-in long so that it fits onto and overlaps the house walls.
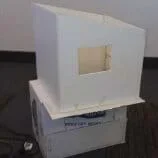 Figure 2. A foamcore model house with no roof or floor.Copyright 2012 Jacqueline Godina, University of Colorado Boulder
- Set up for testing (see Figure 1). Note: If the temperature is insufficiently cool, place ice between the fan and the house, as shown in Figure 3.
- Place the floorless/roofless model house on top of the platform. Place thermometers inside and outside the house so that students have easy access to read the temperatures on both.
- Place the fan about 3 ft from the house/platform. Place the box of ice either between the house and the fan or directly behind the fan (as shown in Figures 1 and 3). Note: Depending on the fan type, the air may be cooler if the fan pushes it directly forward, rather than pulling it in from the ice behind the fan and then and pushing it back out through the fan. These fan/ice setup options provide students with a great opportunity for brainstorming and investigating of different cooling scenarios via their experimentation.
- To get an accurate reading, students may need to hold the thermometer between the fan and house for the duration of the testing unless some sort of stand is used. One idea is to use string to (securely!) hang a thermometer from the ceiling.
- Prepare to show the class the introductory Temperature Tells All Presentation (PPTX), a six-slide PowerPoint® file. If short on time, skip the slides and just present the Introduction/Motivation content along with the slide prompts below to introduce the activity and experimental challenge. Note that the last slide is a diagram of the activity setup (same as Figure 1), which may be helpful for students to see.
With the Students as a Class: Introduction & Kickoff
Show the slide presentation to provide context for the design challenge, together with the Introduction/Motivation content and the slide companion information below.
(slide 1) Title slide.
(slide 2) Information about Langui, Peru, a rural developing community. Mention the following items to the class:
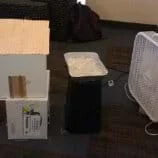 Figure 3. The activity setup.Copyright 2012 Jacqueline Godina, University of Colorado Boulder
- Dung is the main fuel source since the surrounding area is heavily deforested from using all the trees and plants as fuel.
- The main economic activities in Langui are:
o Agriculture—the primary source of livelihood
o Cattle breeding
o Processing of dairy products such as cheese and yogurt
o Breeding of poultry and guinea pigs
o Handmade fabrics and embroideries using looms
- The last three activities mentioned above are typically performed by women. The sale of guinea pigs, cheese, yogurt, looms, and embroideries usually happen at local fairs and in the city of Sicuani (point out the round picture that pops from the slide).
(slide 3) These house roof examples are constructed from different materials such as thatch (made from hay) and corrugated tin. In one photograph (bottom center), notice that a tarp was used as an additional insulation layer. (Note: Ask students where they think community members get these materials.) Thin roofs are not very good at insulating the homes, which is a problem the community members face. But, the trade-off is that thicker, more insulating roofs are more expensive than thin roofs. This is why a need exists for efficient, insulating materials for roofs.
(slide 4) The insides of some of the homes look like this. Notice the open fire pits and inefficient cook stoves. The walls appear black in places from the smoke and ash from the fires. Typically, women spend the most time in the houses for cooking, and young children spend most of their time inside as well. The smoke creates very poor indoor air quality, so family members, especially the women and young children, often develop asthma, bronchitis or other serious respiratory (lung) diseases that can lead to death.
(slide 5) Introduce the activity objective with this slide. Our engineering design challenge is: How to design the roofs to keep the houses warm and have clean indoor air? We know we want to use insulating materials to hold heat in the house. But we also want to let some (smokey) air escape in order to create better indoor air quality. So it is a trade-off, a balancing act. What do you see as the pros and cons of having a chimney in the roof?
(slide 6) This slide shows the activity setup to help students understand how they to test their roof designs.
With the Students in Teams: Imagine-Plan-Create-Test-Improve
- Organize the class into groups of three or four students each.
- Show the available materials and give teams five minutes to brainstorm and draw roof designs, deciding on a final design.
- Have one student in each group collect the necessary materials, based on the team's design.
- Give the groups 15-20 minutes to build their roofs.
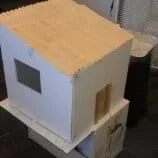 Example model house with a wooden craft stick roof.Copyright 2012 Jacqueline Godina, University of Colorado Boulder
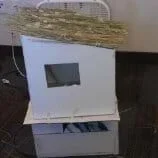 Example model house with a grass roof.Copyright 2012 Jacqueline Godina, University of Colorado Boulder
- Direct the students in each group to choose a "job" for the first testing round. Jobs include: Time Keeper (holding the stopwatch and keeping time), Smoke Observer (peeking through the window and observing the presence and actions of any smoke), Light and Air Master (plugging/unplugging the heat lamp and turning the fan on/off at the appropriate times) and Temperature Master (reading the temperature from the probes/thermometers).
- Direct students to record the temperatures inside and outside the model house every 20 seconds for 3 minutes with the heat lamp on and the fan off, and then for another 3 minutes with the heat lamp off and the fan on.
- Have all students record their qualitative observations (written descriptions of the inside of the house in terms of how smoky it looks, etc.) at four points during testing: at the very start, when the heat lamp and fan are switched off/on (this is two times: once with the heat lamp on and the fan off, and then another time with the heat lamp off and the fan on), and at the end of testing.
- After testing, have students complete the first part of the worksheet based on their first trial. Have each student in the group create one of the graphs.
- Lead a class discussion to share and compare each team's results. Give students time to examine designs from other groups and compare outcomes.
- Based on what students learned from their own and other groups' results, have them redesign their roofs (improve them!) to better hold in heat while also achieving better indoor air quality.
- Repeat the testing procedure for the second/improved roof designs.
- Conclude with a classwide post-activity final analysis of results and conclusions, as described in the Assessment section.
- air quality
- A description of the condition of air in terms of its healthiness and safety for humans. A measurement of the pollutants in the air.
- developing communities
- Communities around the world that lack access to clean water and electricity.
- insulating
- A material property of that tends to prevent or slow the transfer of heat (change in temperature). An insulating material keeps warm things warm and cold things cold.
- rate
- A certain quantity or amount of one thing considered in relation to a unit of another thing. The relative speed of progress or change of something variable.
- slope
- The rate of change. The slope or gradient of a line describes its steepness, incline or grade. A higher slope value indicates a steeper incline.
Pre-Activity Assessment
Brainstorming: Divide the class into small groups of three or four students each (consider using these same groups during the activity). Write the following questions on the classroom board or an overhead projector. How do you think people in developing communities who may not have electricity cook and heat their homes? Do you think they face any risks or dangers that people who live in homes with electricity do not face? After a few minutes of brainstorming, ask student groups the questions out loud and discuss as a class.
Create-a-Poster: If time permits, have each group make a poster with a drawing of what a cooking/heat source might look like in a home in a developing community. Require them to write down reasons why this cooking/heat source is good and why it might be bad.
Activity Embedded Assessment
Re-Design Challenge: As students build and test, remind them to pay attention to how well their designs work so that they can come up with ideas for how to improve their roof designs for the second iteration. Ask students open-ended investigating questions such as: How will you know if your design works well? What could be improved? What are potential problems with your design? What aspects of the design will you not change?
Data Collection: As teams test their designs, have students collect data for the Temperature vs. Time Worksheet (PDF). This includes recording on the worksheet temperature readings both inside and outside the model home every 20 seconds, as well as collecting qualitative data by describing the air appearance inside of the home. Circulate through the classroom and check for worksheet completion to gauge student progress and understanding.
Post-Activity Assessment
Graphing, Data Analysis and Introduction to Slope!: After each round of testing is finished, have students complete the Temperature vs. Time Worksheet (PDF). Have them use the inside/outside temperature data to determine the differences between the temperatures (the relative temperature increase) at each time interval and the change in temperature between each interval. Have students create three graphs: temperature vs. time, difference in inside and outside temperature vs. time, and the change in temperature vs. time. Have students identify when the maximum and minimum temperatures occur, as well as when the maximum and minimum change in temperatures occurs. Expect students to be able to identify that the line on the graph of temperature vs. time is the most steep where the maximum change in temperature is the greatest.
- Limit use of the box cutter and lighter/matches to the teacher only (for cutting holes in the cardboard and lighting the incense). Once lit, warn students to use caution when handling the incense as it has a glowing tip and can burn skin.
- Remind students to be careful with the edges of the aluminum roof and when plugging/unplugging the fan and heat lamp.
- Do not permit cold water or ice to come in contact with the heat lamp or fan.
- To save time during the activity it helps if the teacher pre-bundles grass or hay in advance, making half-inch diameter bundles that are individually tied with string or twine. Make about 10 bundles per group for this activity.
- Consider helping students cut the aluminum pans; the metal can be very sharp.
- If the temperatures are insufficiently cold, try placing the ice between the house and the fan (see Figure 3).
- If difficulties arise with lighting the incense in the model house, try lighting it outside of the house and then positioning it through the house door.
- Simplify for lower grades by removing the "introduction to slope" aspect of the activity. To do this, direct students not to complete the "Temperature Tells All" column for the difference in inside and outside temperatures. Also instruct them to neither answer the questions based on this data nor graph the difference in inside and outside temperature vs. time.
- For upper grades, require students to use the conduction heat transfer equation to determine the heat transfer rate of the wall: Q = kA * (dT/dx). Provide: k, the thermal conductivity of the foam; A = cross-sectional area of the wall; dT = inside temp-outside temp, dx = wall thickness.
Construct and Test Roofs for Different Climates (activity) https://www.teachengineering.org/activities/view/cub_temp_activity1
Zero Energy Housing (activity) https://www.teachengineering.org/activities/view/cub_housing_lesson05_activity1
A House for Me: Materials and Design for Different Climates (activity) https://www.teachengineering.org/activities/view/a_house_for_me
Contributors
Carleigh Samson; Odessa Gomez; Marissa H. Forbes; Jacqueline Godina; Janet Yowell
Supporting Program
Integrated Teaching and Learning Program, College of Engineering, University of Colorado Boulder
Acknowledgements
The contents of these digital library curricula were developed by the Integrated Teaching and Learning Program under National Science Foundation GK-12 grant no. 0338326. However, these contents do not necessarily represent the policies of the National Science Foundation, and you should not assume endorsement by the federal government.
Copyright
2012 by Regents of the University of Colorado