
Water Use and Conservation: Data Analysis for Central Tendency
 How do engineers analyze water in large amounts so they can properly design conservation systems?Copyright 2019 Pixabay, Public Domain, Pexels https://www.pexels.com/photo/close-up-of-splashing-water-247765/
Students collect a large set of data (approximately 60 sets) of individual student’s water use and learn how to use spreadsheets to graph the data and find mean, median, mode, and range. They compared their findings to the national average of water use per person per day and use it to evaluate how much water a municipality would need in the event of a recovery from a water shutdown. This analysis activity introduces students to the concept of central tendencies and how to use spreadsheets to find them.
All branches of engineering require acquiring and analyzing data—usually large sets of data. Measurements of central tendency (mean, median, mode, and range) are commonly used to evaluate these data sets. Environmental engineers rely on similar data sets to measure the amount of resources available or needed, and to evaluate what kind of remediation solution a municipality must take to solve a shortage of water or other event.
After this activity, students should be able to:
- Analyze data for measurements of central tendencies: mean, median, and mode.
- Make decisions based on data analysis.
- CCSS.Math.Content.HSS-IC.B Make inferences and justify conclusions from sample surveys, experiments, and observational studies
Grades 9-12
Do you agree with this alignment? - CCSS.Math.Content.HSS-ID.A Summarize, represent, and interpret data on a single count or measurement variable
Grades 9-12
Do you agree with this alignment? - CCSS.Math.Content.HSS-ID.A.2 Use statistics appropriate to the shape of the data distribution to compare center (median, mean) and spread (interquartile range, standard deviation) of two or more different data sets.
Grades 9-12
Do you agree with this alignment?
- Students will develop abilities to use and maintain technological products and systems.
Grades K-12
Do you agree with this alignment? - Use computers and calculators to access, retrieve, organize, process, maintain, interpret, and evaluate data and information in order to communicate.
Grades 9-12
Do you agree with this alignment? - STEL-8N Use various approaches to communicate processes and procedures for using, maintaining, and assessing technological products and systems.
Grades 9-12
Do you agree with this alignment?
- SEP.1.9-12 Analyzing data in 9–12 builds on K–8 and progresses to introducing more detailed statistical analysis, the comparison of data sets for consistency, and the use of models to generate and analyze data.
Grades 9-12
Do you agree with this alignment? - SEP.1.9-12.1 Analyze data using tools, technologies, and/or models (e.g., computational, mathematical) in order to make valid and reliable scientific claims or determine an optimal design solution.
Grades 9-12
Do you agree with this alignment?
- CC.2.4.HS.B.1 Summarize, represent, and interpret data on a single count or measurement variable.
Grades 9-12
Do you agree with this alignment? - CC.2.4.HS.B.5 Make inferences and justify conclusions based on sample surveys, experiments, and observational studies.
Grades 9-12
Do you agree with this alignment?
- 3.3.10.A8
- Compare and contrast scientific theories.
- Know that both direct and indirect observations are used by scientists to study the natural world and universe.
- Identify questions and concepts that guide scientific investigations.
- Formulate and revise explanations and models using logic and evidence.
- Recognize and analyze alternative explanations and models.
- Explain the importance of accuracy and precision in making valid measurements.
Grade 10
Do you agree with this alignment?
Each group needs:
- A device with internet access; access to Google forms and Google sheets
To share with the entire class:
- Water Use Tracking Log (PDF)
- Making Decisions: Water-Use Analysis Sheet (PDF)
- Water Use Survey (see example on Google Forms)
- Survey Results Sheet (see example on Google Sheets)
Basic knowledge of how to use Google docs, forms, and sheets.
As one of the most valuable resources on earth, water is critical to almost all aspects of human life—from daily household and municipal use to agricultural and industrial projects. The amount of it available in the world is constant, but it changes forms as it moves through the water cycle.
The water that we use in everyday life comes from groundwater or reservoirs that hold river water and rainwater. Municipal treatment plants process the water to make it clean enough to drink. However, towns can lose access to their water supply if there is an issue with the plant or contamination of the river water or reservoir. Engineers are often tasked with building systems that manage water supplies as well as mitigate problems that may arise with local water resources. While we may think of these systems as consisting of infrastructure (which they often do) engineers are often tasked with creating and measuring these systems using large amounts of data.
In this activity, you will analyze how much water your family uses in your house for 3 days. We will use this data to perform a data analysis to determine how much water would need to be delivered if we had to go without water in the event of a natural disaster. Environmental engineers use data analysis to assist communities in the event of natural disasters.
Background
This activity can be taught as part of a unit on scientific methods and measurements. Previous lessons should focus on the scientific method, how to design an experiment, the SI (metric) system of measurements, and recommendations for layout of data tables and use of graphs to represent data. This is an activity to show the use of computer science to help organize and analyze data with bigger data sets then students may normally experience in a lab.
Measurements of central tendency are used to statistically analyze data. The mode is the least used method and only appropriate when analyzing nominal data. The mean is the most appropriate method for continuous, symmetrical data. If the data set is skewed then the median is usually the preferred method. Mean, median, and mode would be equal to each other in a normal, symmetrical data set.
To calculate the mean, or average, add up all the numbers, then divide by how many numbers there are. To find the median, find the central value in the data list. To find the mode, find the number that appears most often in the data set.
Before the Activity
The bulk of the activity is the Making Decisions: Water Use Analysis Sheet (PDF). At least four days before that portion of the activity, assign students the Water Use Tracking Log (PDF). Review that document in class and instruct them that they need to individually track their household’s water use for three days. Once all students have tracked three days of water use, then they are ready to move on to the Making Decisions: Water Use Analysis Sheet (PDF). This sheet includes links to a Water Use Survey (on Google Forms) Survey Results Sheet (on Google Sheets). Note: Teachers should clear the Google Sheet of previous class data before students begin the Making Decisions: Water Use Analysis Sheet (PDF), or they can make a new one based on the example.
With the Students
- Do a pre-assessment writing prompt: “Explain what mean, median, mode, and range are? How are they used in scientific investigations?” Gather the students answers and discuss as group.
- Go over the Making Decisions: Water Use Analysis Sheet (PDF). They need approximately 30-40 minutes to use the sheet to quantify the liters of water that they used over the three-day period based on data from the Water Use Tracking Log (PDF).
- Once every student has their water use calculated, have students use the Water Use Survey (Figure 1) to log their personal water use. This feeds into a spreadsheet that shows every students water use. Use the Survey Results Sheet to access the Google document (Figure 2). Make this available to the students.
- Once all the data for the class has been entered, tell students to make their own copy of the spreadsheet and follow the instructions in the Making Decisions: Water Use Analysis Sheet (PDF) to graph the data into a histogram (Figure 3) and use the spreadsheet to find mean, median, mode, and range.
- Have students answer the series of questions on their water use comparing it to the national average of 370 L/day. They may also calculate how much water would need to be shipped in to their town if they lost access to the municipal water supply in the event of a disruption.
- Circulate among students to help those having difficulty with the calculation of water use or difficulty with using the sheets commands.
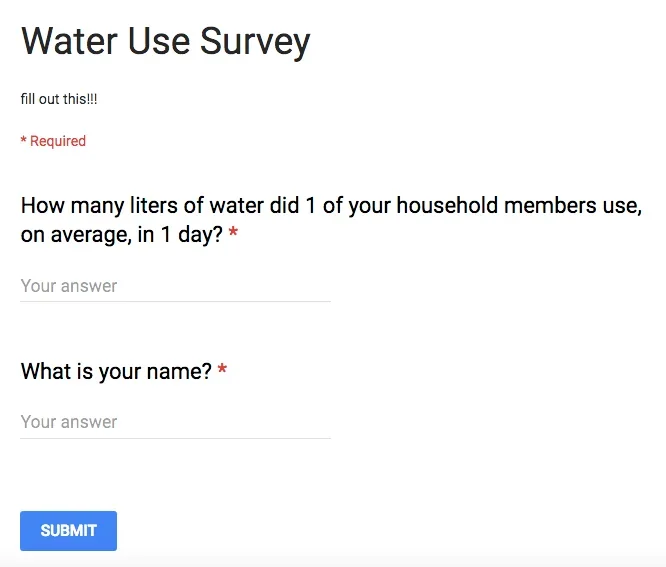 Figure 1. Example of the Water Use Survey to use with students.Copyright 2018 Jackie Gartner, Drexel University REThink Project
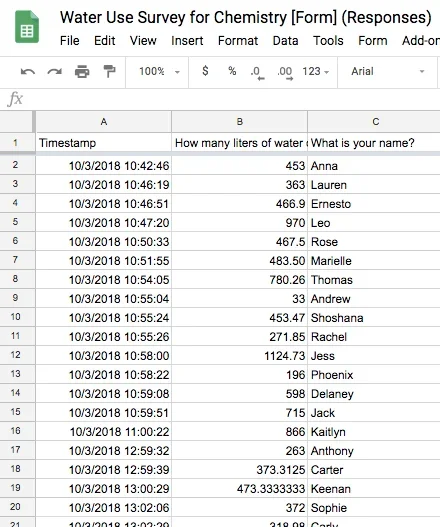 Figure 2. Example of student data collected.Copyright 2018 Jackie Gartner, Drexel University REThink Project
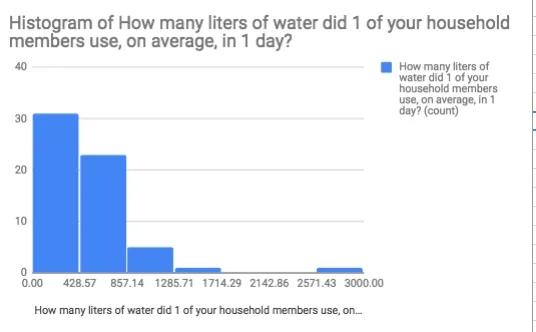 Figure 3. Example of a histogram of water use by student.Copyright 2018 Jackie Gartner, Drexel University REThink Project
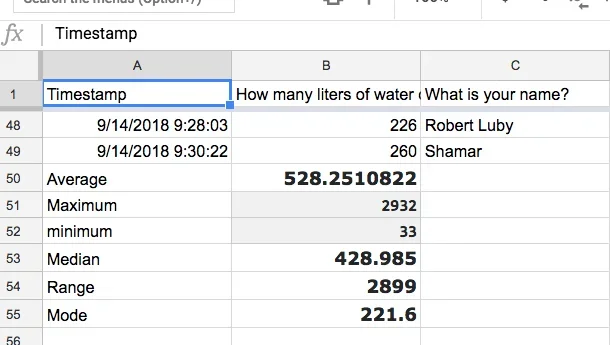 Example results of central tendency for water use.Copyright 2018 Jackie Gartner, Drexel University REThink Project
- central tendency
- In statistics, a central or typical value for a probability distribution. It may also be called a center or location of the distribution.
- hydrologic cycle
- Continuous movement of water on, above, and below the surface of the Earth.
- mean
- The average of the numbers in a set or the calculated "central" value of a set of numbers. To calculate it: add up all the numbers, then divide by how many numbers there are.
- median
- The "middle" value in the list of numbers.
- mode
- The number which appears most often in a set of numbers.
Pre-Activity Assessment
Writing prompt: Explain what mean, median, mode, and range are? How are they used in scientific investigations? (Mean is the average of the data set, median is the middle number in the data series, mode is the most repeated number in the data set, range is the largest number minus the smallest number.) They are used in scientific investigations to find the central tendency of the data set.
Discussion: Gather the students’ answers and discuss as a group.
Activity Embedded Assessment
Analysis Sheet: Have students complete the questions in the Making Decisions: Water Use Analysis Sheet (PDF) and the student spreadsheets. Grade the questions based on how accurately they represent the data collected.
Post-Activity Assessment:
Class Discussion: Discuss the questions in Making Decisions: Water Use Analysis Sheet (PDF) or the Investigating Questions as a class. Have the students break into groups or discuss and analyze the data for mean, median, mode, and range.
Watch what they enter as their daily water use, some accidentally put in the 3-day total and you need to point out if the number looks too high and help them reevaluate their daily water use number.
In the next lab that the students do, collect the lab results from each group and each class and have the students analyze that data set for mean, median, mode, and range.
- For lower grades, provide more time for teacher support or do the spreadsheet analysis as a whole group, then break into small groups to answer the questions in teams.
- For higher grades reduce the time to two class days and instruct students to independently analyze the data sets, providing answers for mean, median, mode, and range.
Contributors
Jackie Gartner
Supporting Program
REThink Project, College of Computing and Informatics, Drexel University
Acknowledgements
This material was developed based upon work supported by the National Science Foundation under grant no. EEC 1711773—RET in Engineering and Computer Science Site for Machine Learning to Enhance Human-Centered Computing at Drexel University. Any opinions, findings, and conclusions or recommendations expressed in this material are those of the authors and do not necessarily reflect the views of the National Science Foundation.
Copyright
2019 by Regents of the University of Colorado; original © 2018 Drexel University