
As We Grow: Measuring Heights and Graphing Data
Students visit second- and fourth-grade classes to measure the heights of older students using large building blocks as a non-standard unit of measure. They also measure adults in the school community. Results are displayed in age-appropriate bar graphs (paper cut-outs of miniature building blocks glued on paper to form bar graphs) enabling a comparison of the heights of different age groups. The activities that comprise this activity help students develop the concepts and vocabulary to describe, in a non-ambiguous way, how heights change as children age. This introduction to graphing provides an important foundation for creating and interpreting graphs in future years.
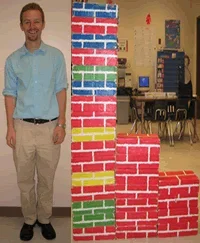 Building blocks can be used to measure a person's height.
Measuring and graphing are important skills used in all engineering disciplines. When engineers design houses or cars or bicycles, they need to know the likely shapes and sizes of the people who will be using those structures, vehicles or products. Making graphs enables engineers to look at lots of data at once, in order to see averages, trends and patterns.
After this activity, students should be able to:
- Measure heights in a non-standard, age-appropriate way, such as by using building blocks instead of rulers.
- Display data in the form of pictorial bar graphs.
- Interpret bar graphs.
- Describe how the heights of children change as they age.
- CCSS.Math.Content.1.MD.C.4 Organize, represent, and interpret data with up to three categories; ask and answer questions about the total number of data points, how many in each category, and how many more or less are in one category than in another.
Grade 1
Do you agree with this alignment? - CCSS.Math.Content.2.MD.A.4 Measure to determine how much longer one object is than another, expressing the length difference in terms of a standard length unit.
Grade 2
Do you agree with this alignment? - CCSS.Math.Content.2.MD.D.10 Draw a picture graph and a bar graph (with single-unit scale) to represent a data set with up to four categories. Solve simple put-together, take-apart, and compare problems using information presented in a bar graph.
Grade 2
Do you agree with this alignment? - CCSS.Math.Content.K.MD.A.1 Describe measurable attributes of objects, such as length or weight. Describe several measurable attributes of a single object.
Grade 0
Do you agree with this alignment? - CCSS.Math.Content.K.MD.A.2 Directly compare two objects with a measurable attribute in common, to see which object has "more of"/"less of" the attribute, and describe the difference.
Grade 0
Do you agree with this alignment?
- Information is data that has been organized.
Grades K-2
Do you agree with this alignment? - STEL-2B Safely use tools to complete tasks.
Grades -1-2
Do you agree with this alignment?
- SEP.1.K-2 Analyzing data in K–2 builds on prior experiences and progresses to collecting, recording, and sharing observations.
Grades K-2
Do you agree with this alignment? - SEP.7.K-2.2 Make observations (firsthand or from media) to collect data that can be used to make comparisons.
Grades K-1
Do you agree with this alignment?
- CCSS.Math.Content.1.MD.C.4 Organize, represent, and interpret data with up to three categories; ask and answer questions about the total number of data points, how many in each category, and how many more or less are in one category than in another.
Grade 1
Do you agree with this alignment? - CCSS.Math.Content.2.MD.A.4 Measure to determine how much longer one object is than another, expressing the length difference in terms of a standard length unit.
Grade 2
Do you agree with this alignment? - CCSS.Math.Content.2.MD.D.10 Draw a picture graph and a bar graph (with single-unit scale) to represent a data set with up to four categories. Solve simple put-together, take-apart, and compare problems using information presented in a bar graph.
Grade 2
Do you agree with this alignment? - CCSS.Math.Content.2.MD.D.9 Generate measurement data by measuring lengths of several objects to the nearest whole unit, or by making repeated measurements of the same object. Show the measurements by making a line plot, where the horizontal scale is marked off in whole-number units.
Grade 2
Do you agree with this alignment? - CCSS.Math.Content.K.CC.C.7 Compare two numbers between 1 and 10 presented as written numerals.
Grade 0
Do you agree with this alignment? - CCSS.Math.Content.K.MD.A.1 Describe measurable attributes of objects, such as length or weight. Describe several measurable attributes of a single object.
Grade 0
Do you agree with this alignment? - CCSS.Math.Content.K.MD.A.2 Directly compare two objects with a measurable attribute in common, to see which object has "more of"/"less of" the attribute, and describe the difference.
Grade 0
Do you agree with this alignment?
- long building blocks, about 10 inches long; one for every two students in the class
- medium building blocks, half as long as the long blocks above; one for every two students
- 15-30 sheets of construction paper (preferably all the same color)
- glue, for student use
- poster board, several sheets, either all one color, or four different colors, one for each age group
- markers and pencil
- paper cutter or scissors
- ruler
(Gather the class together and remind them of the discussion that was held after they measured each other using building blocks. Point out the list of student heights that was obtained during that discussion.)
I know a way to show all that information in a special type of picture called a graph. Who has heard of a graph? (Listen to student responses.) Where have you seen a graph? How was it used? What did it tell you?
Graphs are very useful because they let people share or learn about a lot of information in a quick and easy way.
Today, you will help me make a large graph of your heights.
Before the Activity
- Create and make copies of a data sheet for each student to use when visiting the other grade classrooms to record the names and heights of a second grader and a fourth grader, and provide space to make tally marks as they measure the older students.
- Prepare about 500 construction paper rectangles, all sized ~1 x 3-inches, for students to use, with glue, to make bar graphs. It helps to use a paper cutter to make this easier! The exact size does not matter but make them similar in proportion to the building blocks being used and an easy size for students to handle. Since construction paper measures 9 x 12-inches, 1 x 3-inche rectangles are easy to mark off and cut (1½ x 4-inch rectangles are also easy, but require more construction paper). The exact number of rectangles needed depends on the class size.
- Use a meter stick and pencil to lightly draw vertical lines about every three to four inches across the sheets of poster board. Draw one vertical line for each student in the class, and write a different student's name at the bottom of each of line. The vertical lines make it easier for students to glue the rectangles neatly onto the poster board into bar graphs. Use the wider spacing if your rectangles are the larger size. This way, when students glue down the rectangles, they can line up the pieces along the vertical lines to keep the graphs from leaning or becoming too crooked.
- A week or two in advance, recruit a dozen or so adults to visit your class and be measured by your students. These might be parents, administrators, librarians, janitors or counselors—anyone who can spare a few minutes. Try to get both men and women, and include yourself. It is best if all the recruited adults visit the class at the same time, but if not, schedule over several different days and times.
- A few days in advance, arrange times when your class can visit a second-grade class and a fourth-grade class. It works best if you determine in advance which pair of kindergartners will measure the heights of which two older students in each class.
OVERVIEW: During the course of several days, students will:
- As a class activity, create a bar graph that shows all the heights of the students in the class. This is accomplished by students gluing pre-cut rectangles, resembling the measuring blocks students used, onto lined prepared chart paper.
- Visit second-grade and fourth-grade classes to measure the heights of those (older) students.
- Measure the heights of several adults recruited from the school community.
- As a group activity, create bar graphs that compare the heights of second-graders, fourth-graders and adults.
Part 1: Making a Class Graph
- Show the class the already-prepared poster board and rectangles. Place the poster paper on the floor or a table so that it is flat. Then, using the actual data for one student, show how you can line up the rectangles on end, one above the other, to represent that student's height. Do not glue those rectangles down. Also point out how to use the vertical lines drawn on the poster paper to keep the line of rectangles straight, and that you placed the rectangles on the line marked with the name of the student whose data you chose.
- Explain that each person's task is to glue rectangles on the poster board to show his or her height, using the vertical line above his or her name. Then, remove the rectangles you used for demonstration and let students begin creating and gluing down their own graphs. To avoid congestion, do this as a center activity in which groups of three rotate through.
Part 2: Measuring Second and Fourth Graders
- Explain to students that it would be fun to visit some other classes and see how tall some older students are. Explain that you have arranged visits to a second-grade and a fourth-grade class. Ask students: How do you think the heights of these older students will compare to your heights? When students say they think the older students will be taller, ask them how much taller. Students may use their arms to demonstrate, but ask them how many blocks taller they think each group will be. Record their predictions on chart paper or the classroom board.
- Next, explain that this time, students will work in pairs to measure two second-graders and two fourth-graders. This way, one kindergartner can work as the tally marker while the other does the block measurement. Suggest that they trade jobs each time they measure a new student.
- When you return to your own classroom, ask the class how their measurements compared to the predictions recorded earlier.
Part 3: Measuring Adults
- On the appointed day (or just before the first of the adult visits), ask the class how many blocks tall they think adults are, compared to their heights. As before, record their predictions.
- As the adult recruits visit the class to be measured, record their names and heights on the large data sheet prepared in advance.
- As the data comes in, compare the actual adult heights to the student-predicted heights.
- Part 4: Graphing Older Students and Adults
- Using the poster boards prepared in advance, have students glue on rectangles to represent the measured second-grader and fourth-grader heights. These should be made in the same manner as the graphs of their own heights. Again, do this as a center activity.
- Likewise, assign individual students to glue bars representing the adults onto the poster board prepared earlier for the adult height graph.
Part 5: Discussion and Investigating Questions
- Display all four completed graphs in a row, ordered from the youngest to the oldest age groups. Ask students to comment on what they observe about the graphs. Expect their first response to be: as people get older, they get taller. Then ask questions to focus their observations, such as:
- Do you see a big difference between the heights of kindergartners and the heights of second graders?
- Do you see a big difference between the heights of kindergartners and the heights of fourth graders?
- What about the difference between second and fourth graders?
- What about the difference between kindergartners and adults?
- Are all kindergartners the same height? What about all second and fourth graders?
- Do you see a difference between the heights of boys and girls in each class? (Expect not much height difference between genders, or possibly girls may be slightly taller on average.)
- Do you see a difference between the heights of men and women in the adults?
- Real-World Engineering Connection: Explain that the way students just spent some time carefully examining all the measurements and graphs they made is similar to how engineers look at the data they collect and the graphs they make, looking for comparisons, averages, trends and patterns. It is how engineers figure out what sizes to make everything from skyscrapers to doorways, car seats, bicycles, phones and shoes.
- Next, explain that there is a more exact way to talk about the differences between the heights of the four age groups. Starting with the kindergartner poster, ask who is the shortest person in the class. At the bottom of the chart paper, write down that student's measurement. Then ask who is the next taller student. Write down that student's measurement directly above the first's. Continue putting the student heights in order from shortest to tallest.
- Then explain that you are going to start crossing off heights two at a time, by crossing off the shortest and tallest together. Then cross off the second shortest and second tallest together, and continue crossing off pairs of measurements until only one or two measurements in the middle of the list remain. Explain to the class that since you have crossed off all the short and tall students, you now have the middle-sized kindergarten height remaining. (In mathematical terms, you have determined the median height, but avoid using this term with young children; "middle-sized" is a term they can understand and serves just as well.)
- Repeat the same procedure for the second-grade class. Point out that you can now easily compare the heights of middle-sized kindergartners to middle-sized second graders. For example: A middle-sized kindergartner is 4 blocks tall, and a middle-sized second grader is 4½ blocks tall. So a second grader is one-half a block taller than a kindergartner."
- Do the same for the fourth grade class and the adults. By having them compare the heights of the different age groups using numbers (quantitatively), you are helping them develop both number sense and an understanding that numbers can be used to help describe and compare things of interest.
Summary Assessment: To assess whether students are now able to independently use non-standard methods of measurement, ask them to measure the heights of several objects in the classroom. This time, have them use smaller building blocks to measure objects such as a book, teddy bear or doll and paint brush. See if they are able to show their results in the form of a bar graph by having them use paper cut-outs of the blocks (prepared in advance, or else use existing toy blocks, such as LEGO bricks) to create bar graphs that compare the measurements of the various objects.
- Students may need to stand on chairs or tables to measure adults, so be sure to monitor this activity closely.
- Watch that students who are easily angered or frustrated do not use the large building blocks to harm others.
Conduct a similar exercise with home-grown seedling plants by having students use stacking 1-inch cubes (such as Unifix cubes) to measure the heights of growing plants over a period of weeks. Have students plant bean or zinnia seeds according to package directions, using 16-ounce plastic drinking cups with drainage holes made in the bottoms. Use a good quality potting soil, and make several extra plantings in case some seeds do not germinate. Keep the pots moist but not soggy, and leave them in a sunny window.
Once the seedlings are about two inches high, have students measure the heights with Unifix cubes every three or four days. Provide data sheets for recording the height measurements and the number of days since planting. Provide a large calendar with the planting day prominently marked to help with this data collection procedure.
After a few weeks, when the plants reach full height, have students create bar graphs showing how their own plants grew each time they were measured.
In a follow-up discussion, be sure students realize that like humans, plants grow steadily at first, and then their growth slows or even stops. Unlike humans, however, many plants keep growing indefinitely, as long as they have enough nutrients and water and remain disease-free. Trees are a familiar example.
- Measuring and Graphing: How Tall Are We?
- As We Grow: Measuring Heights and Graphing Data
Contributors
Mary R. Hebrank
Supporting Program
Engineering K-PhD Program, Pratt School of Engineering, Duke University
Acknowledgements
This content was developed by the MUSIC (Math Understanding through Science Integrated with Curriculum) Program in the Pratt School of Engineering at Duke University under National Science Foundation GK-12 grant no. DGE 0338262. However, these contents do not necessarily represent the policies of the NSF, and you should not assume endorsement by the federal government.
Copyright
2013 by Regents of the University of Colorado; original © 2004 Duke University