
Population Growth Curves
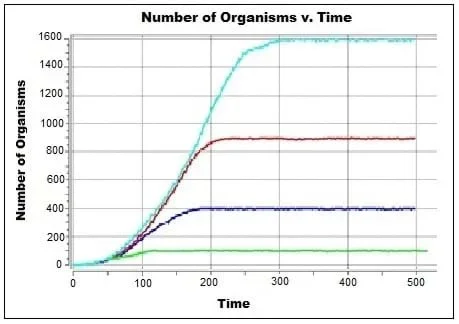 Example population growth curves.Copyright 2012 Jeff Farrell, Michigan State University
Using Avida-ED freeware, students control a few factors in an environment populated with digital organisms, and then compare how changing these factors affects population growth. They experiment by altering the environment size (similar to what is called carrying capacity, the maximum population size that an environment can normally sustain), the initial organism gestation rate, and the availability of resources. How systems function often depends on many different factors. By altering these factors one at a time, and observing the results, students are able to clearly see the effect of each one.
This activity is a simple form of systems analysis, an important part of engineering. The activity takes a biological system and describes it as a mathematical process with manipulatable variables. How systems, living or not, function often depends on many different factors. By altering these factors one at a time, and observing the results, the effects of each one can be determined. Many engineering disciplines require mathamatical translationas well as an understanding of population growth, including healthcare concerns, urban planning and biochemical engineering.
After this activity, students should be able to:
- Predict the effects of changing environmental factors on the patterns of population growth.
- Apply mathematical routines to quantities that describe communities composed of populations of organisms that interact in complex ways.
- CCSS.Math.Content.HSF-IF.B.4 For a function that models a relationship between two quantities, interpret key features of graphs and tables in terms of the quantities, and sketch graphs showing key features given a verbal description of the relationship.
Grades 9-12
Do you agree with this alignment? - CCSS.Math.Content.HSF-IF.C.7 Graph functions expressed symbolically and show key features of the graph, by hand in simple cases and using technology for more complicated cases.
Grades 9-12
Do you agree with this alignment? - CCSS.Math.Content.HSS-ID.A.1 Represent data with plots on the real number line (dot plots, histograms, and box plots).
Grades 9-12
Do you agree with this alignment? - CCSS.Math.Content.HSS-ID.C.7 Interpret the slope (rate of change) and the intercept (constant term) of a linear model in the context of the data.
Grades 9-12
Do you agree with this alignment?
- Use computers and calculators to access, retrieve, organize, process, maintain, interpret, and evaluate data and information in order to communicate.
Grades 9-12
Do you agree with this alignment? - Design forecasting techniques to evaluate the results of altering natural systems.
Grades 9-12
Do you agree with this alignment? - Biotechnology has applications in such areas as agriculture, pharmaceuticals, food and beverages, medicine, energy, the environment, and genetic engineering.
Grades 9-12
Do you agree with this alignment? - STEL-8N Use various approaches to communicate processes and procedures for using, maintaining, and assessing technological products and systems.
Grades 9-12
Do you agree with this alignment?
- CCSS.Math.Content.HSF-IF.B.4 For a function that models a relationship between two quantities, interpret key features of graphs and tables in terms of the quantities, and sketch graphs showing key features given a verbal description of the relationship.
Grades 9-12
Do you agree with this alignment? - CCSS.Math.Content.HSF-IF.C.7 Graph functions expressed symbolically and show key features of the graph, by hand in simple cases and using technology for more complicated cases.
Grades 9-12
Do you agree with this alignment? - CCSS.Math.Content.HSS-ID.A.1 Represent data with plots on the real number line (dot plots, histograms, and box plots).
Grades 9-12
Do you agree with this alignment? - CCSS.Math.Content.HSS-ID.C.7 Interpret the slope (rate of change) and the intercept (constant term) of a linear model in the context of the data.
Grades 9-12
Do you agree with this alignment?
- B1.1C Conduct scientific investigations using appropriate tools and techniques (e.g., selecting an instrument that measures the desired quantity-length, volume, weight, time interval, temperature-with the appropriate level of precision).
Grades 9-12
Do you agree with this alignment? - B1.2C Develop an understanding of a scientific concept by accessing information from multiple sources. Evaluate the scientific accuracy and significance of the information.
Grades 9-12
Do you agree with this alignment? - B3.5A Graph changes in population growth, given a data table.
Grades 9-12
Do you agree with this alignment? - B3.5B Explain the influences that affect population growth.
Grades 9-12
Do you agree with this alignment?
- HS-ETS1-4 Use a computer simulation to model the impact of proposed solutions to a complex real-world problem with numerous criteria and constraints on interactions within and between systems relevant to the problem.
Grades 9-12
This resource focuses on the following Three Dimensional Learning aspects of NGSS:
Science & Engineering Practices- Use mathematical models and/or computer simulations to predict the effects of a design solution on systems and/or the interactions between systems.Do you agree with this alignment?
Disciplinary Core Ideas- Both physical models and computers can be used in various ways to aid in the engineering design process. Computers are useful for a variety of purposes, such as running simulations to test different ways of solving a problem or to see which one is most efficient or economical; and in making a persuasive presentation to a client about how a given design will meet his or her needs.Do you agree with this alignment?
Crosscutting Concepts- Models (e.g., physical, mathematical, computer models) can be used to simulate systems and interactions—including energy, matter, and information flows—within and between systems at different scales.Do you agree with this alignment?
Do you agree with this alignment? - Use mathematical models and/or computer simulations to predict the effects of a design solution on systems and/or the interactions between systems.
Each group needs:
- computer with Avida-ED program installed (download the freeware from https://avida-ed.msu.edu/app/AvidaED.html)
- Population Growth Worksheet (PDF)
To share with the entire class:
- computer connected to an LCD projector
A basic familiarity with the Avida-ED program.
(Note: Before class, complete the following: 1) use the internet to obtain a reasonably accurate figure for the current human population of our planet, such as the U.S. Census Bureau's population clock at https://www.census.gov/popclock/, and 2) write the following question on the board: "About how many people are on the Earth today?")
(As class begins, point out the question on the board and give students a minute or two to formulate their guesses.) Let's hear from some of you with answers as to how many people you think are on our planet. (Listen to a few student answers while drawing a simple Population vs. Time graph on the classroom board with a few data points representing students' guesses.)
When I looked it up this morning, the best estimation I found was ___________. (The population should be 7 billion plus. Put that data point on the graph in a different color.)
Let's go back in time. What was the population about one thousand years ago? What about 10 thousand years ago? (Sketch this graph without worrying about axis numbers, just draw a sloped line that illustrates how the population has grown in the past 10 thousand years. Walk around the room to observe student progress while they draw the graph and sloped line. Ask some leading questions.) Do you think the human population on Earth has ever been more than it is now? Do you think it is a straight line or a curved line? Why?
Today we are going to test the hypothesis you just proposed. You might not even realize that you came up with a hypothesis, but the sloped line you drew on your graph is your guess or hypothesis on how human population on this planet has changed over time. A great way to show how fast population increases is to demonstrate the concept via bacteria growth. However, our problem today is that we only have about 45 minutes of class left, and even bacteria can only divide two or three times in that short amount of time. So we are going to have to use a different kind of self-replicating set of instructions to show us population growth. What are self-replicating set of instructions, you ask? We'll find out in this activity!
Today, instead of using bacteria and Petri dishes, we will use digital organisms, or simple computer programs that copy themselves, to study growth patterns. It may seem strange to use a computer program for this, but in terms of reproduction, they behave identically to cell-based organisms; that is, they try to reproduce as much as possible given the limitations of their environment and their programming. Using digital organisms also makes it easier to keep track of the size of the population and graph the data, and gives us the ability to control the factors that impact the population growth rate.
Before the Activity
- Make sure all computers have the Avida-ED program loaded onto them.
- Make copies of the Population Growth Worksheet (PDF), one per group.
- Divide the class into teams of two students each, or larger groups if not enough computers are available.
With the Students
- After the introduction, distribute materials to the groups.
- Provide a quick overview of the activity expectations, encouraging students to answer the worksheet questions as they go. Remind them to read all instructions carefully.
- exponential
- Related to an exponent. In terms of growth, it means the growth in the population is proportional to the population size.
- logistic
- A type of sigmoid curve often described as having an "S" shape.
- carrying capacity
- The maximum number of organisms the environment can support.
- population
- The number of one type of organism in a location.
Pre-Activity Assessment
Growth Patterns: Put a few example graphs on the board, some of which show unusual or "impossible" patterns (such as a graph in which the population is larger than the actual size of an average Petri dish, and a graph that shows the population is declining below zero; see Figures 1 and 2) and some of which show standard logistic growth curves. Ask students to describe what trends the graphs show in terms of population, and identify any patterns that are not realistic.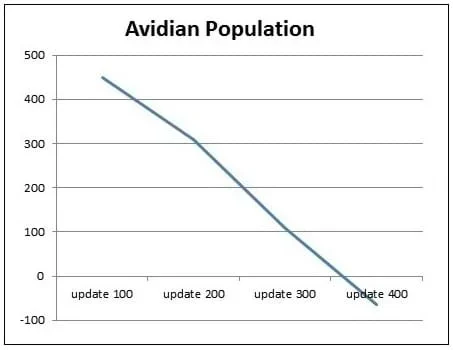 Figure 1. Example "impossible" population growth curve: population is less than zero.Copyright 2012 Jeff Farrell, Michigan State University
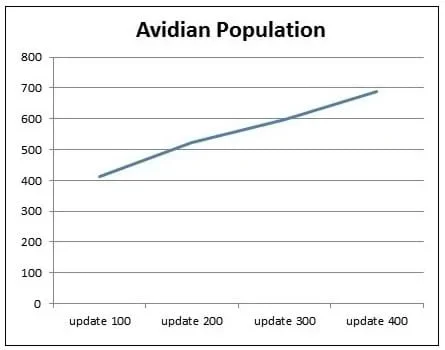 Figure 2. Example "impossible" population growth curve: population is greater than the carrying capacity of 500.Copyright 2012 Jeff Farrell, Michigan State University
Teacher note: Expect students to be able to recognize that some of these graphs are not typical of what they expect to see through this activity, and explain why not (the population cannot drop below zero, for example). It is important to explain to students that in natural systems, populations frequently rise above carrying capacity, but then quickly drop back down. In Avida-ED, the "dish size" is the absolute highest number of possible organisms and cannot be exceeded.
Activity Embedded Assessment
What's Up With That? Display student graphs, and while pointing to steep slope increases, ask students "Why do you think the line is going up sharply here?" While pointing to graphs created later in the activity, where the growth curve slope lowers, ask "Why do you think growth slows down here?"
Teacher note: Growth begins relatively slowly because fewer organisms are present to reproduce. As a population increases however, more and more organisms are reproducing and so the number of offspring produced begins to rise quickly, resulting in a steeply sloped upwards line on the population graph. This continues until the population approaches the dish size, which is the carrying capacity and in Avida-ED, and is the absolute highest number of organisms that cannot be exceeded. At this point, no more room is available for new organisms; new organisms replace old organisms, resulting in no net population growth. Eventually, the dish is filled and population growth effectively ceases as mortality equals natality (number of organisms born and dying during the same time period are the same.)
Post-Activity Assessment
Use Your Skills: Once students seem to understand the basics of population growth, see if they can apply their new abilities to similar situations, such as the one described in the last question of the assignment. Ask them to predict when a population will reach a given number in a certain sized environment. Then ask if the environment were bigger or smaller, what affect that would have on their predictions.
Teacher note: Determining how long it takes a population to rise to a given level can be accomplished a few ways. Some students may draw curves onto graphs of similar shape to those produced during the activity, but with the carrying capacity from the question, not from something they did during the activity. Some may use a mathematical equation. Others may run the program with the appropriate dish size and directly observe when it reaches the given population. All of these methods have advantages and disadvantages, and a comparison of them makes a great classroom discussion.
When comparing environments of different sizes, expect the results to show that during the initial growth periods, the curves are be virtually identical. Once the initial growth period has ended, larger environments allow for faster growth, but only once the smaller environments have arrived close to their carrying capacity.
- Once the Avida-ED program is installed, it is not necessary for the computers to be connected to the internet.
- This activity can be used with any age student who can operate a computer and understands simple graphing. Do not hesitate to try this with younger students, as certain sections can be deleted, depending on the skill level of the class.
- For more advanced students, have them use, or derive themselves, the calculations (see Figure 3 or search the internet with keyword "logistic function") that govern population size at a given time, and then compare their calculated total with what Avida-ED shows as its result.
Letting P represent population size (N is often used in ecology instead) and t represent time, this model is formalized by the differential equation: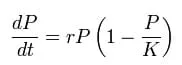 Figure 3. A logistic function, where P represents population size and t represents time.Copyright 2012 Wikipedia
where the constant r defines the growth rate and K is the carrying capacity.
Attention: This activity requires use of the Avida-ED program; this freeware is available at: http://avida-ed.msu.edu/
Contributors
Jeff Farell; Wendy Johnson; Jennifer Doherty
Supporting Program
Bio-Inspired Technology and Systems (BITS) RET, College of Engineering, Michigan State University
Acknowledgements
The contents of this digital library curriculum were developed through the Bio-Inspired Technology and Systems (BITS) research experience for teachers program under National Science Foundation RET grant no. EEG 0908810. However, these contents do not necessarily represent the policies of the NSF and you should not assume endorsement by the federal government.
Copyright
2013 by Regents of the University of Colorado; original © 2011 Michigan State University