
Humidity? Build a Psychrometer!
Using thermometers, cotton balls, string and water, students make simple psychrometers—a tool that measures humidity. They learn the difference between relative humidity (the ratio of water vapor content to water vapor carrying capacity) and dew point (the temperature at which dew forms). Teams collect data using their homemade psychrometers and then calculate relative humidity inside and outside, comparing their results to an off-the-shelf psychrometer (if available). A lab worksheet is provided for data collection and calculation. As a real-world connection, students learn that humidity and air density is taken into consideration by engineers for many design projects. To conclude, they answer and discuss analysis and application questions.
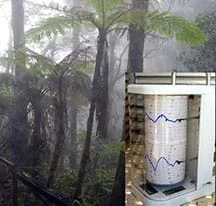 Gaining an understanding of relative humidity has implications for the engineering design of all sorts of technologies.Copyright 2015 Krauss, Wikimedia Commons CC BY-SA 4.0 https://commons.wikimedia.org/wiki/File:Cloud_forest_mount_kinabalu-withHygrom.jpg
Weather can affect many aspects of engineering, from flight dynamics to the efficiency of wind turbines and cooling systems. Humidity is a key concept in understanding weather. Having an understanding of relative humidity and dew point is useful when designing products. Humidity and air density is taken into consideration by engineers for design projects such as wind turbines and kites, and solar panels used for electricity generation.
Many engineers are involved in measuring, collecting, sorting, analyzing and drawing conclusions from real-world data. To correctly interpret data requires an understanding of how engineers consider and account for instrument error (instrument accuracy) and observational error (human misreading or incorrect instrument use).
After this activity, students should be able to:
- Define and explain relative humidity and dew point.
- Use thermometers to calculate relative humidity and dew point.
- Put together a simple device for data collection.
- Collect data, make calculations and analyze experimental results.
- Make the real-world connection that humidity and denser air impact the design of engineered technologies.
- Describe the operation of a psychrometer.
- CCSS.Math.Content.8.SP.A Investigate patterns of association in bivariate data.
Grade 8
Do you agree with this alignment? - CCSS.Math.Practice.MP1 Make sense of problems and persevere in solving them.
Grades K-12
Do you agree with this alignment? - CCSS.Math.Practice.MP2 Reason abstractly and quantitatively.
Grades K-12
Do you agree with this alignment? - CCSS.Math.Practice.MP5 Use appropriate tools strategically.
Grades K-12
Do you agree with this alignment?
- Students will develop an understanding of the relationships among technologies and the connections between technology and other fields of study.
Grades K-12
Do you agree with this alignment? - STEL-8M Use instruments to gather data on the performance of everyday products.
Grades 6-8
Do you agree with this alignment?
- MS-ESS2-5 Collect data to provide evidence for how the motions and complex interactions of air masses results in changes in weather conditions.
Grades 6-8
This resource focuses on the following Three Dimensional Learning aspects of NGSS:
Science & Engineering Practices- Collect data to produce data to serve as the basis for evidence to answer scientific questions or test design solutions under a range of conditions.Do you agree with this alignment?
- Use mathematical representations to describe and/or support scientific conclusions and design solutions.Do you agree with this alignment?
- Analyze and interpret data to determine similarities and differences in findings.Do you agree with this alignment?
Disciplinary Core Ideas- The complex patterns of the changes and the movement of water in the atmosphere, determined by winds, landforms, and ocean temperatures and currents, are major determinants of local weather patterns.Do you agree with this alignment?
- Because these patterns are so complex, weather can only be predicted probabilistically.Do you agree with this alignment?
Crosscutting Concepts- Cause and effect relationships may be used to predict phenomena in natural or designed systems.Do you agree with this alignment?
Do you agree with this alignment? - Collect data to produce data to serve as the basis for evidence to answer scientific questions or test design solutions under a range of conditions.
- CCSS.Math.Content.8.SP.A Investigate patterns of association in bivariate data.
Grade 8
Do you agree with this alignment? - CCSS.Math.Practice.MP1 Make sense of problems and persevere in solving them.
Grades K-12
Do you agree with this alignment? - CCSS.Math.Practice.MP2 Reason abstractly and quantitatively.
Grades K-12
Do you agree with this alignment? - CCSS.Math.Practice.MP5 Use appropriate tools strategically.
Grades K-12
Do you agree with this alignment?
- 7.E.1 Understand how the cycling of matter (water and gases) in and out of the atmosphere relates to Earth's atmosphere, weather and climate and the effects of the atmosphere on humans.
Grade 7
Do you agree with this alignment?
Each group needs:
- 2 thermometers
- 1 cotton ball or piece of gauze
- string, ~15-20 cm long
- calculator
- Relative Humidity Lab Datasheet (PDF), one per group
To share with the entire class:
- water
- (optional) a commercial psychrometer, for ~$30 such as from Amazon
Students should be familiar with sunlight and wind as renewable energy sources.
Solar and wind energy can be converted into electricity using technologies like photovoltaic panels and wind turbines. These clean, renewable forms of energy have the potential to make a huge impact on reducing our planet’s air pollution problem if the necessary technologies are designed and implemented effectively.
Air density affects the efficiency of wind and sunlight at generating energy. How? For example, air density can make turbine blades more or less effective, make a kite have more or less lift, and make the atmosphere more or less penetrable by solar radiation. Engineers who design wind turbines, solar panels, and kite-based (airborne) electric power generators need to understand everything about humidity—and that higher humidity means denser air.
Today, you will collect and analyze data on relative humidity in order to understand its impact on designing clean forms of energy generation.
Background
Air is composed of various gases in different concentrations; one of the gaseous components is water vapor. Water vapor is comprised of water molecules in a high-energy state. They can be forced out of air and into a liquid state if the temperature drops, thus forming condensation on a cold surface—or clouds in the air. Air can hold a specific amount of water vapor based on the temperature in that area. Warmer air holds more water vapor, while colder air is denser, with less space for water vapor. Temperature changes can influence air density and the ability of air to move and generate electricity in wind energy systems.
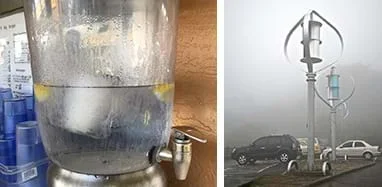 High humidity reduces air movement because the air requires more energy to flow, which directly effects the efficiency of wind energy systems.Copyright (left) 2017 Denise W. Carlson, ITL Program, College of Engineering and Applied Science, University of Colorado Boulder; (right) 2009 Fred Hsu, Wikimedia Commons CC BY-SA 3.0 https://commons.wikimedia.org/wiki/File:Taiwan_2009_JinGuaShi_Historic_Gold_Mine_Combined_Darrieus_Savonius_Wind_Turbines_FRD_8638.jpg
Humidity is the measurement of moisture in the air based on a wet bulb and dry bulb thermometer reading. Comparing these two values enables engineers to understand how much water is in the air. Humidity is reported in two ways: relative humidity and dew point.
Relative humidity is a comparison of how much water the air is currently holding to the amount of water vapor the air could hold at saturation—the point of maximum capacity. Thus, at 100% humidity, the air is fully saturated with water vapor and therefore denser. A problem with using relative humidity to measure humidity is that the amount of water vapor air can hold increases with temperature. Therefore, 50% humidity is not the same amount of water vapor in 50 °F weather as it is in 100 °F weather. For example, the condition of 100 °F and 50% humidity is much more humid than the condition of 50 °F and 50% humidity.
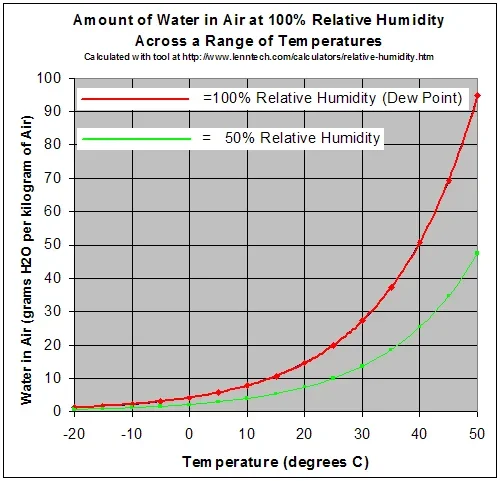 The relationship between relative humidity and temperature.Copyright 2007 Greg Benson, Wikimedia Commons CC BY-SA 3.0 https://commons.wikimedia.org/wiki/File:Relative_Humidity.png
The dew point is another measure of humidity that describes the temperature at which dew forms on a surface. If the dew point is equal to the current temperature, then the air is fully saturated with water vapor (100% relative humidity). The dew point is not affected by the current temperature and so a dew point of 50 °F is the same humidity whether it is 50 or 100 degrees. Most people find dew points from 50-70 degrees to feel comfortable, while dew points higher than 70 degrees feel humid and dew points lower than 50 degrees feel dry.
If humidity is high, it reduces the air movement because the air requires more energy to flow; this has a direct effect on wind energy systems.
Although not required for conducting this activity, if desired, provide students with additional background by showing them The Atmosphere Presentation (PPTX), a PowerPoint® file. In 11 slides, the presentation answers the following questions and covers the topics listed below:
- How does energy move in the atmosphere? Topics: radiation, conduction, convection
- From what is our atmosphere composed? Topics: gases, solids, ozone
- How is our atmosphere organized? Topics: gravity, structure, layers (5), air pressure, density
Before the Activity
- Gather materials and make copies of the Relative Humidity Lab Datasheet (PDF).
With the Students
- To gauge students’ prior knowledge about humidity, conduct the pre-activity discussion described in the Assessment section.
- Then present the Introduction/Motivation content to the class.
- Divide the class into groups of four students each.
- Give each group 2 thermometers, 2 cotton balls, 1 piece of string, and a datasheet.
- Direct the teams to moisten the cotton ball with room-temperature water and use the string to tie it to the end of one thermometer. Be sure the moist cotton ball completely covers the bulb of the thermometer. Doing this serves as a wet bulb thermometer. The second, dry thermometer serves as a dry bulb thermometer.
 Making the wet bulb thermometer.Copyright 2018 Nahum Tariku, ITL Program, College of Engineering and Applied Science, University of Colorado Boulder
- In the classroom, have students spin or wave both thermometers for 60 seconds to collect accurate indoor temperatures. Have them record these values on their datasheets.
- Measure the in-classroom humidity using the purchased psychrometer (if available) and record the measurement to compare with the class data later.
- Outside, have students repeat this procedure to collect and record data for later comparison purposes.
- Once groups have completed the data table, direct them to use the relative humidity chart on the datasheet to calculate the percentages.
- Remind students that atmospheric conditions directly affect the efficiency of wind and solar energy systems.
- To conclude, lead a class discussion and have students answer the following questions based on analysis of their collected data:
- How do your relative humidity measurements for inside and outside compare? (Answers will vary, but expect that students might find that indoor humidity is less than outdoor humidity in warm/humid climates, or indoor humidity might be higher than the outdoor humidity in cold/dry climates.)
- Why did we use two thermometers to calculate relative humidity? (Example answer: The amount of water the air can hold changes with temperature. We needed two thermometers, one to measure the actual air temperature [dry bulb] and the other to measure how much water was evaporating from the cotton ball [wet bulb].)
- How might relative humidity impact air density? (Example answer: Humid air is denser than dry air.)
- What might have contributed to your error when compared to the psychrometer reading? (Example possible answers: Construction/lab instrument accuracy errors such as thermometer bulbs that are not fully covered by cotton balls, and observational/measurement errors [human error] such as difficulty in accurately reading the thermometer lines or incorrect instrument use.)
- Looking at the pulled-together class data, how did the average humidity reading compare to the psychrometer reading? (Example answer: The average humidity reading was closer to the actual reading than many of the individual readings, or the average humidity reading was higher/lower than the actual reading.)
- humidity
- The amount of water vapor in the air.
- relative humidity
- The amount of water vapor in a gas compared to the maximum amount of water vapor the gas can hold at a given temperature.
- dry bulb temperature
- The temperature measured by a thermometer that is freely exposed to the air but shielded from radiation and moisture.
- wet bulb temperature
- The temperature measured by a thermometer wrapped in a wet material. Due to evaporation, the wet bulb temperature is always less than or equal to the dry bulb temperature.
- dew point
- The temperature at which dew condenses on a surface.
- psychrometer
- A tool used to measure relative humidity and dew point. Consists of two thermometers, one dry and one kept moist with water.
Pre-Activity Assessment
Prior Knowledge: During the initial discussion, ask students the following questions:
- What is humidity? (Example answer: Humidity is how moist the air is.)
- How does humidity affect the atmosphere, and in turn, renewable energy sources? (Humidity influences air density, which influences energy production.)
- Are all locations as humid as where we live? What about other regions globally? (Some places have dry heat. Not all states or regions have the same humidity, and it varies at all locations.)
- What aspects of atmospheric conditions have the greatest impact on these energy systems? (High wind velocity, higher air density produces more energy.)
Activity Embedded Assessment
Observe: As students complete their calculations, walk around to observe and ask:
- How does humidity affect dry bulb and wet bulb measurements? (Example answer: Humidity does not affect the dry bulb temperature; the more humid it is, the closer the wet bulb temperature is to the dry bulb temperature; the less humid it is, the lower the wet-bulb temperature will be.)
Post-Activity Assessment
Closing Discussion: As a class, discuss the analysis questions provided at the end of the Procedure section. Make sure that everyone understands the concept of relative humidity.
Tarbuck, Edward J., and Lutgens, Frederick K. North Carolina Earth Science. Upper Saddle River, NJ: Pearson Prentice-Hall, 2006, pp. 524-525.
Contributors
Hannah Brooks; Dale Gaddis; Shay Marceau; Ashley Martin; Lazar Trifunovic; Michael A. Soltys
Supporting Program
RET Program, College of Engineering, North Carolina State University, and CORE Lab, University of North Carolina at Charlotte
Acknowledgements
This curricular unit was developed based upon work supported by the National Science Foundation under grant no. EEC 1542377—Grand Challenges for Engineering Focused RET with Stratified Teams, a collaboration of the College of Engineering at North Carolina State University, and the Control Optimization for Renewable Energies (CORE) Lab at the University of North Carolina at Charlotte. Any opinions, findings, and conclusions or recommendations expressed in this material are those of the authors and do not necessarily reflect the views of the National Science Foundation.
Copyright
2017 by Regents of the University of Colorado; original © 2016 North Carolina State University