
Statistical Analysis of Temperature Sensors
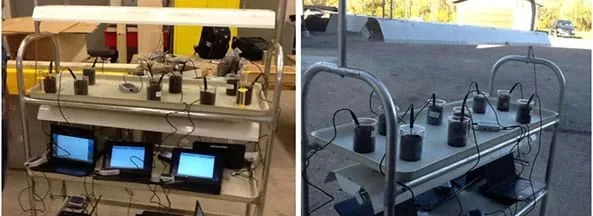 To simulate crop environmental changes (such day and night) while collecting data with temperature sensors, student samples are moved from inside under a heat lamp (left) to outside in the shade (right).Copyright 2016 Trent Kosel, North Dakota State University Fargo RET
Working as if they are engineers aiming to analyze and then improve data collection devices for precision agriculture, students determine how accurate temperature sensors are by comparing them to each other. Teams record soil temperature data during a class period while making changes to the samples to mimic real-world crop conditions—such as the addition of water and heat and the removal of the heat. Groups analyze their collected data by finding the mean, median, mode, and standard deviation. Then, the class combines all the team data points in order to compare data collected from numerous devices and analyze the accuracy of their recording devices by finding the standard deviation of temperature readings at each minute. By averaging the standard deviations of each minute’s temperature reading, students determine the accuracy of their temperature sensors. Students present their findings and conclusions, including making recommendations for temperature sensor improvements.
In every engineering field, researchers are continually innovating and improving existing devices. To do this, engineers collect data and rely on technology such as spreadsheets—like Microsoft® Excel® and Google Sheets—to help them analyze the data. Use of these programs provides valuable assistance in determining the accuracy and precision of real-world measurements collected in the field. Like engineers, in this activity students collect data and then use Google Sheets to analyze, interpret and draw conclusions from a dataset. For example, civil engineers, collect roadway elevation data in order to determine if the roadway profile meets current design standards.
After this activity, students should be able to:
- Interpret temperature data and communicate their findings.
- Find the mean, median, mode, range, and standard deviation of a dataset and its data subsets.
- Use statistical analysis to determine if a temperature sensor is accurate.
- Recognize maximum, minimum, mean, and mode of recorded temperatures based on graphs and data reports.
- CCSS.Math.Content.HSS-IC.B.5 Use data from a randomized experiment to compare two treatments; use simulations to decide if differences between parameters are significant.
Grades 9-12
Do you agree with this alignment? - CCSS.Math.Content.HSS-IC.B.6 Evaluate reports based on data.
Grades 9-12
Do you agree with this alignment? - CCSS.Math.Content.HSS-ID.A.2 Use statistics appropriate to the shape of the data distribution to compare center (median, mean) and spread (interquartile range, standard deviation) of two or more different data sets.
Grades 9-12
Do you agree with this alignment?
- STEL-4R Assess a technology that minimizes resource use and resulting waste to achieve a goal.
Grades 9-12
Do you agree with this alignment?
- SEP.1.9-12.2 Apply concepts of statistics and probability (including determining function fits to data, slope, intercept, and correlation coefficient for linear fits) to scientific and engineering questions and problems, using digital tools when feasible.
Grades 9-12
Do you agree with this alignment? - SEP.1.9-12.1 Analyze data using tools, technologies, and/or models (e.g., computational, mathematical) in order to make valid and reliable scientific claims or determine an optimal design solution.
Grades 9-12
Do you agree with this alignment?
- HS.S-IC.5 Use data from a randomized experiment to compare two treatments; use simulations to decide if differences between parameters are significant.
Grades 9-12
Do you agree with this alignment? - HS.S-IC.6 Evaluate reports based on data.
Grades 9-12
Do you agree with this alignment? - HS.S-ID.2 Use statistics appropriate to the shape of the data distribution to compare center (median, mean) and spread (interquartile range, standard deviation) of two or more different data sets.
Grades 9-12
Do you agree with this alignment?
For pre-activity practice, each group/student needs:
- Practice Sample Data Spreadsheet (XLSX) (Excel file)
- Practice Sample Data Worksheet (PDF)
- computer or laptop with Excel®, Google Sheets, GeoGebra or other computing spreadsheet; such as a Lenovo N22 Winbook Chromebook for $149 at https://www.amazon.com/Lenovo-Winbook-80SF0000US-11-6-Chromebook/dp/B01CYUPLCU
Each group needs:
- Vernier temperature sensor, such as the stainless steel temperature probe at https://www.vernier.com/products/sensors/temperature-sensors/tmp-bta/; see below for alternative
- Vernier LabQuest 2 sensor interface and data collector at https://www.vernier.com/products/interfaces/labq2/ OR Vernier LabQuest Mini at https://www.vernier.com/products/interfaces/lq-mini/
- Statistical analysis app, free in app store; such as for Android or iOS
- Activity Procedure Handout (PDF)
- disposable cup, 18-oz (.5-liter) size, such as a “Solo cup,” to measure an amount of soil
- potting soil, 18 oz, such as from a 1 cubic foot bag (enough for 50 groups!)
- beaker, 400-500-ml size
- graduated cylinder, large enough for 25 ml of water, such as a 25-ml glass cylinder with plastic base
- water
- heat source, such as a heat lamp for reptile, greenhouse or outdoor patio; heat source temperature to use can be determined by teacher
- computer or laptop with Excel, Google Sheets, GeoGebra or other computing spreadsheet
- Write-Up Requirements (PDF)
- (optional) Data Analysis Rubric (PDF)
Alternative to digital sensors
If you do not have access to Vernier sensors (and the LabQuest devices), use digital thermometers and timers/clocks (to note one-minute increments) as an alternative data collection method, such as this economy digital pocket thermometer at https://www.flinnsci.com/flinn-digital-pocket-thermometer-economy-choice/ap6049/#variantDetails. With this method, the data needs to be manually entered into the statistical analysis app.
To share with the entire class:
- Google Sheets spreadsheet, to enable entire-class statistical analysis
- a rolling cart or shelf, such as the Economy plant stand with shelves at https://www.flinnsci.com/economy-plant-stand/fb0629/
- capability to show students a 2:51-minute online video at https://www.youtube.com/watch?v=IuXuZwX777E
- Practice Sample Data Spreadsheet (xlsx)
- Practice Sample Data Worksheet (docx)
- Practice Sample Data Worksheet (pdf)
- Practice Sample Data Worksheet Answer Key (docx)
- Practice Sample Data Worksheet Answer Key (pdf)
- Activity Procedure Handout (docx)
- Activity Procedure Handout (pdf)
- Data Analysis Rubric (docx)
- Data Analysis Rubric (pdf)
- Write-Up Requirements (docx)
- Write-Up Requirements (pdf)
A basic understanding of mean, median, mode, and standard deviation. Able to represent data in different graphical forms using Excel, Google Sheets or graphing software such as GeoGebra.
In agriculture, many farmers use an approach called “precision agriculture” to optimize crop yields and profits, while minimizing the amount of waste and excess labor costs. As described in this video, precision agriculture is made possible through using technology. Precision agriculture is a farming management concept based on observing, measuring and responding to inter- and intra-field crop variability—changes within the field and changes between fields. Watch this short interview about the topic. (Show the class the short video at https://www.youtube.com/watch?v=IuXuZwX777E.)
Electrical and agricultural engineers are continually improving all types of measuring devices so that information about soil conditions are available to farmers sooner and in more useful ways and settings. Before developing new devices, though, engineers must first determine the accuracy of industry standard devices. Knowing that, they can attempt to develop improved devices that provide the same or better levels of accuracy. In our activity today, like real-world engineers, we’re going to do something very similar using temperature sensors.
Working in groups, you will act as if you are agricultural engineers who are attempting to develop a new temperature sensor to monitor field soil conditions. Currently, the temperature sensors used in agriculture are wired and depend on a constant flow of electric current to take measurements. Your engineering challenge is to determine the accuracy of the classroom’s set of temperature sensors. From this data, you will determine how accurate newly developed devices need to be in order to provide quality information to users. As part of your analysis, you will also reflect on the experimentation process to determine what outlying circumstances may have skewed your recorded data.
Before the Activity
- Gather the necessary supplies for each group.
- Familiarize students with the Google Sheets tutorial page and GeoGebra so that they are able to make calculations and display data. Get students paper copies of the Practice Sample Data Worksheet (PDF) and digital copies of the Practice Sample Data Spreadsheet (XLSX) (Excel file) in order to practice working with the data analysis programs.
- Depending on your school resources and current weather conditions, decide how to best incorporate a marked temperate change (by the addition/removal of heat) into the data collection experiment to simulate day and night temperature variations. For example, one scenario is to collect data under a heat lamp inside (if you have a heat lamp), then move the samples to a shady spot outside (if the temperatures are cool outdoors), and then move the samples back inside under the heat lamp. As necessary, adjust the Activity Procedure Handout (PDF) to match the data collection protocol you set up.
- Make copies of the Activity Procedure Handout (PDF) and Write-Up Requirements (PDF), one each per group.
- Make sure all devices are charged, such as LabQuests and laptops.
- Set up a Google Sheet titled, Soil Temperature Experiment that all computers can access—a place where all group data can be compiled into one class dataset.
- Think about how you will divide the class into groups, such as teams of four students each. The key is to have at least six groups because the more experimental samples, the more accurate the results will be.
- For the first period, prepare to show the class a 2:51-minute video, How Precision Agriculture Optimizes Crops, at https://www.youtube.com/watch?v=IuXuZwX777E and have the potting soil available and ready for groups to set up their test samples.
With the Students: Inquiry and Experiment Setup (50 minutes)
- Start by presenting the Introduction/Motivation section content, which includes showing the short precision agriculture video and introducing the engineering challenge: To determine the accuracy of the classroom’s set of temperature sensors, from which you will determine how accurate newly developed devices need to be in order to provide quality information to end users. To do this, we will run a research experiment with the goal to determine how accurate the temperature sensors are by comparing them to each other.
- Divide the class into groups.
- Pass out the procedure handout to each group. Read through the steps that students will follow when conducting this activity. Answer any questions students may have with the procedure.
- Familiarize students with the temperature sensors along with the technology used to operate them. This might be the LabQuest 2 or LabQuest Mini. Refer to the temperature sensor user manual at https://www.vernier.com/manuals/tmp-bta/. For example, show them:
- where to plug in the sensor
- how to begin collecting data
- how to change the settings to record the soil temperature for 40 minutes and collect a data point each minute
- the different viewing windows to view the data (data table, time plot)
- (if using LabQuest) how to export data to a device for calculation breakdown OR (if using the app) how the data is automatically collected on their devices; (if not operating Vernier probes, students can still utilize the statistical analysis app, but need to manually enter the data)
- Answer any questions students may have with collecting data using the temperature sensors.
- Review the capabilities of statistical spreadsheet software and GeoGebra.
- Show students how to calculate the average and standard deviation using formulas within the spreadsheets.
- Refresh students on the spreadsheet graphing capabilities and give them time to explore them, focusing on graphing time plots.
- Refresh students on the graphing capabilities in GeoGebra and give them time to explore them, focusing on creating box plots.
- Once students are familiar with the procedure, temperature sensor and spreadsheet software, have groups prepare the soil samples for data collection, which begins the following day.
- Have each group fill its (same sized) disposable cup completely full with potting soil and dump it into its beaker. While the amount of soil need not be exact, have students aim for it to be as close to a full cup as possible. (Variations in soil amount across all samples are a possible source of error for students to recognize when analyzing the data.)
- Set aside the beakers in the classroom/greenhouse to await data collection the next day.
With the Students: Data Collection (50 Minutes)
- Have students gather at the location where their samples were left the previous day and give teams five minutes to set up their temperature sensors. Have groups set their sensors for 40 minutes of data collection, collecting a data point each minute. Note: If using a heat lamp, position it so the heat source is not directly on the temperature sensor, otherwise it may result in inaccurate data readings. (If using the alternative method with digital thermometers, have students prepare to manually record readings at every minute.)
- When every team is ready, direct students to begin collecting data. Aim for the start time to be as close as possible to the same time, although it is okay if they do not start collecting at exactly the same time. (Variations in timing across all data collection are another possible source of error for students to recognize when analyzing the data.) (If using the alternative method with digital thermometers, students begin manually recording soil temperature readings at every minute.)
- Once students start collecting data points, have them follow the steps on the procedure handout to administer the prescribed experimental condition changes, continuously taking temperature readings every minute.
At minute 0: Start collecting data (all groups, at the same moment)
At minute 9: Add 25 ml of water
At minute 19: Remove heat (move sample outside) *
At minute 29: Add heat (bring sample back inside) *
At minute 39: Stop data collection (should stop automatically)
*Note that your steps at minute 19 and minute 29 may be different than what is indicated here (and on the procedure handout)—depending on your resources and/or current weather conditions; the goal is to create a temperature change to simulate day and night temperature variations.
- While students are waiting for the above experimental treatment times to arrive (adding water, removing heat, adding heat), remind them to prepare for the next condition change by measuring 25 ml and having it ready to apply when the time is reached, and being ready to move the samples.
- Once data collection is complete, have students save the collected data.
- Before starting to analyze the data, have students clean up their areas and return the cleaned equipment to storage locations.
- Direct teams to enter the data into the class Google Sheet titled, Soil Temperature Experiment.
- Once all data is entered, have students analyze the data to complete the activity objectives.
- Interpret the temperature data and communicate their findings.
- Find the mean, median, mode, range, and standard deviation of the dataset and its data subsets.
- Based on statistical analysis, determine if the temperature sensor is accurate.
- Based on graphs and data reports, identify the maximum, minimum, mean, and mode of recorded temperatures.
With the Students: Data Analysis and Communication (50 minutes)
Have groups arrive at class ready to make short presentations that recap and explain their data and findings, as described in the Assessment section.
- agricultural engineer
- A person who integrates technology with farming.
- electrical engineer
- A person who works on a wide range of components, devices and systems, from microchips to huge power station generators.
- five-number-summary
- Quarters a dataset by creating five boundaries (minimum, first quartile Q1, second quartile Q2 (median), third quartile Q3, and maximum). Also called a box plot or box-and-whisker-plot.
- mean
- A measure of center obtained by adding the data values and dividing the total by the number of data values.
- measure of center
- A value at the center or middle of a dataset.
- median
- A measure of center obtained by arranging the data values in increasing (or decreasing) order and finding the middle value.
- precision agriculture
- A farming management concept based on observing, measuring and responding to inter- and intra-field crop variability.
- range (statistics)
- The difference between the largest and smallest values in a dataset.
- standard deviation
- A measure of how much data values deviate away from the mean.
Pre-Activity Assessment
Spreadsheet & Data Analysis Practice: Provide students with the Practice Sample Data Spreadsheet (XLSX) (an Excel file) that contains sample data for students to make calculations and produce graphs to display the data. Guided by the Practice Sample Data Worksheet (PDF), have students calculate the mean and standard deviation of different parts of the spreadsheet sample data. They also use the Google Sheets graphing capabilities to show the data in time plots. Then they use GeoGebra to represent the data in a five-number summary.
Activity Embedded Assessment
Data Analysis: Once all experiment data is collected, have students apply their knowledge of measures of central tendency and graphs to make calculations for the data. Give students the freedom to present data as they see fit in order to attain the goal of determining the accuracy of the temperature sensor. Refer to the Data Analysis Rubric (PDF) for guidance in assessing student work.
Post-Activity Assessment
Class Presentations: Assign groups to come to the last class period ready to present to the class their findings and answers to the minimum analysis requirements and questions in the Write Up Requirements (PDF). Let students decide how they want to present their data, findings and conclusions, such as by PowerPoint®, written report, poster or handouts. Alternatively, have individual students each present his/her findings to the class. Below are the tool analysis and activity reflection questions with teacher notes about the answers.
- What are some benefits of the temperature sensors that we used in the classroom? (Expect answers to mostly describe their ease of use or how they are easy to read. Students might also mention that it has multiple scales to measure the temperature.)
- What are some of the limitations of the temperature sensors that we have in the classroom? (Expect answers to include the limitation on accuracy of the temperature [for example, to the nearest degree]; if using Vernier probes, battery power and cords might be considered limitations.)
- If you were to design a new, more convenient temperature sensor for farmers to use in their fields, what “new and improved” features would you want your thermometer to have? (Expect answers to include features such as be biodegradable, a longer life span, record a wider temperature range, work in a wider temperature range [does it work below freezing?], power source used, and/or how the sensor calculates and transmits data.)
- What other important considerations do you advise be kept in mind when making your new temperature sensor? (Example answer: I assume some of the most important things are the sensor life span and then how to replace the sensor. Environmental issues are a major concern for companies planning on manufacturing the sensors. For example, mining for metals and other raw materials necessary to make the sensors can be detrimental to the environment; processing the metals and minerals can produce toxins that decrease air quality.)
- How does this experiment relate to what has been taught in class? (Example answer: This activity provides a relevant dataset that we can use to make calculations of statistical analysis and graphically represent the data so it can be easily understood by the general public/other audiences.)
- How can this information be used in precision agriculture? (Example answer: Farmers can use the data obtained from soil sensors to make judgments that help to improve crop yields. The sensors can be used to determine when and where to water/apply fertilizer and how much to apply.)
- How has conducting this data collection and analysis experiment benefited your learning? (Expect most students to answer this question by saying that this activity provided a real-life application to the material being learned in class.)
- How trustworthy is our experimental data? Think back on the experimentation process. What outlying circumstances may have skewed your and other teams’ collected data? (Example answer: Possible sources of error might be variations in the scooped or packed soil sample amounts across all samples, and variations in timing precision across all data collection teams and simulation conditions.)
- How can this activity be improved to enhance it for future student? (Hopefully, students provide actionable feedback about the activity that can be used to improve it.)
Unless the temperatures being recorded are in dangerously hot or cold temperatures, minimal safety concerns exist, although heat lamps can burn if they come in direct contact with skin.
- Make sure you know how to set the temperature sensors so they record every minute.
- If using a traditional thermometer, the procedure remains the same except students need to manually read the thermometer every minute.
- This activity is only successful if students take measurements seriously, perhaps more than they have in the past. Since the main activity objective is to determine sensor accuracy, reinforce with students the importance of precise measurements. Expect some students to obtain results like "65 degrees" or simply measure once and write down the result multiple times. Do not accept this. If using a thermometer, require students to provide a “guess digit”—that is, look between the scale lines.
Have students research how accuracy and precision of measurement tools play a pivotal role in other fields, such as manufacturing, aviation, and medical diagnostics/treatment.
- For lower grades, have students calculate the mean, median, and mode, along with creating a box-and-whisker-plot and a time plot for the data.
- For higher grades, have students use programing software such as Arduino or RaspberryPi to create their own temperature probes and compare them to the industry standard. Discuss more advanced statistics such as t-testing to determine whether or not a significant difference exists between compared temperature sensors.
GeoGebra is mathematics software that brings together geometry, algebra, spreadsheets, graphing, statistics and calculus in one easy-to-use package. Learn about and get GeoGebra free materials, downloads and tutorials at https://www.geogebra.org/download.
Contributors
Trent Kosel; Northern Cass; Keith Lehman
Supporting Program
RET Program, College of Engineering, North Dakota State University Fargo
Acknowledgements
This curriculum was developed in the College of Engineering’s Research Experience for Teachers: Engineering in Precision Agriculture for Rural STEM Educators program supported by the National Science Foundation under grant no. EEC 1542370. Any opinions, findings, and conclusions or recommendations expressed in this material are those of the author(s) and do not necessarily reflect the views of the National Science Foundation.
Special thanks to Alan Kallmeyer and Bradley Bowen.
Copyright
2017 by Regents of the University of Colorado; original © 2016 North Dakota State University