
Do Forest Fires or Cars Produce More CO2 Emissions?
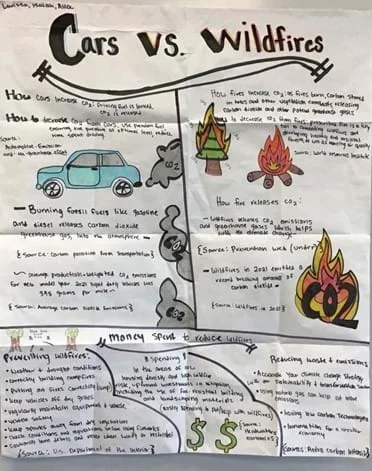 Student exemplar of a CO2 emissions posterCopyright Sheyenne High School, West Fargo, ND.
Students act as environmental engineers to solve a problem using carbon dioxide (CO2) emissions from cars and wildfires. Wildfires are a timely topic because every year they cause people in many areas to face poor air quality. Students use Microsoft Excel to investigate CO2 emitted from two sources: highway traffic and forest fires. They estimate and graph the CO2 emitted by forest fires and from U.S. highway driving annually from 2004 to 2021. After they analyze these two pieces of data, they analyze a specific fire and evacuation that happened in Saratoga Springs in June 2020, named the Knolls Fire. Finally, using the Excel data and the Knolls Fire data, students decide whether the U.S. should spend money on reducing the number and severity of wildfires, or on reducing CO2 emissions from driving cars. The students design and create a poster based on their decision and present it to the class.
Environmental engineers contribute significantly to the comprehensive management of wildfires, focusing on sustainable and eco-friendly practices to prevent, mitigate, respond to, and recover from these natural disasters. Their work is essential in protecting both human communities and natural ecosystems from the devastating effects of wildfires. Environmental engineers also study air pollution from human sources such as car emissions. They work to identify air pollutants and design transportation that leads to cleaner air to keep people safe and healthy.
After this activity, students should be able to:
- Understand units and unit analysis, e.g., miles vs. square miles.
- Graph data and properly label each graph, including units and titles.
- Analyze graphs and data to support arguments.
- CCSS.Math.Content.HSS-ID.B.6 Represent data on two quantitative variables on a scatter plot, and describe how the variables are related.
Grades 9-12
Do you agree with this alignment?
- HS-ESS3-3 Create a computational simulation to illustrate the relationships among management of natural resources, the sustainability of human populations, and biodiversity.
Grades 9-12
This resource focuses on the following Three Dimensional Learning aspects of NGSS:
Science & Engineering Practices- Create a computational model or simulation of a phenomenon, designed device, process, or system.Do you agree with this alignment?
Disciplinary Core Ideas- The sustainability of human societies and the biodiversity that supports them requires responsible management of natural resources.Do you agree with this alignment?
Crosscutting Concepts- Modern civilization depends on major technological systems.Do you agree with this alignment?
- Change and rates of change can be quantified and modeled over very short or very long periods of time. Some system changes are irreversible.Do you agree with this alignment?
- New technologies can have deep impacts on society and the environment, including some that were not anticipated.Do you agree with this alignment?
- Science is a result of human endeavors, imagination, and creativity.Do you agree with this alignment?
Do you agree with this alignment? - Create a computational model or simulation of a phenomenon, designed device, process, or system.
Each group needs:
- 1 laptop computer/ device with Microsoft Excel and Microsoft PowerPoint
- Wildfires vs Cars CO2 Emissions PowerPoint Presentation (PPTX)
- Wildfires vs Cars Graphing Exploration (XLSX) Excel file
- Wildfires vs Cars Graphing Directions (PDF)
- Knolls Fire and Evacuation Worksheet (PDF)
- CO2 Emissions Poster Presentation and Rubric (PDF)
For the entire class to share:
- poster paper
- magic markers
- Wildfire vs Cars CO2 Emissions Presentation (pptx)
- Wildfire vs Cars CO2 Emissions Presentation (pdf)
- Wildfire vs Cars CO2 Emissions Presentation Key (pptx)
- Wildfire vs Cars CO2 Emissions Presentation Key (pdf)
- Wildfires vs Cars Graphing Directions (docx)
- Wildfires vs Cars Graphing Directions (pdf)
- Wildfires vs Cars Graphing Exploration (xlsx)
- Wildfires vs Cars Graphing Exploration Key (xlsx)
- Knolls Fire and Evacuation Worksheet (docx)
- Knolls Fire and Evacuation Worksheet (pdf)
- Knolls Fire and Evacuation Worksheet Key (docx)
- Knolls Fire and Evacuation Worksheet Key (pdf)
- CO2 Emissions Poster Presentation and Rubric (docx)
- CO2 Emissions Poster Presentation and Rubric (pdf)
Students should have a basic understanding of Excel and how to write formulas in Excel.
During the summer of 2023, there were record wildfires in Canada that caused poor air quality in many areas of the United States and around the world. Many people in the U.S. experienced this directly with hazy, smoky days that even caused some school activities to be canceled due to the poor air quality. In the western U.S., the number of wildfires doubled between 1984 and 2015. Climate change is causing warmer, drier conditions that have increased drought, leading to longer fire seasons and increasing the risk of forest fires. As more forest fires occur, there are increasing amounts of CO2 released into the atmosphere, which is causing further imbalance in the planet’s carbon cycle.
Greenhouse gases include carbon dioxide (CO2), methane (CH4), and nitrous oxide (N2O). In this activity, you are going to primarily explore the sources of CO2 emissions.
Transportation also produces a high volume of CO2 emissions. Since the industrial revolution, global concentrations of CO2 have risen 48.1%, primarily due to the combustion of fossil fuels for energy. Within the U.S., fossil fuel combustion accounted for 92.2% of gross emissions in 2021. Globally, the U.S. accounted for 14.1% of CO2 added to the atmosphere through the combustion of fossil fuels in 2021.
Today you are going to be environmental engineers and do some investigating to better understand sources of CO2 and the impact of CO2 on the climate. In addition, you all will need to consider practical solutions to slow the rate of climate change. In particular, I want you to think about how the U.S. should spend its money to reduce carbon emissions: should it focus on reducing the number and size of forest fires? Or should the U.S. focus on reducing the CO2 emissions that result from driving cars?
Background
Students begin with a Microsoft PowerPoint lesson explaining the carbon cycle. CO2 can either be released or absorbed. The burning of fossil fuels, forest fires, landfills releasing methane, and cattle releasing methane have created an imbalance in the cycle: There is more CO2 being released than being absorbed. CO2 leads to climate change, so the U.S. has to decide where it should spend its money: on reducing vehicle fuel emissions or reducing wildfires.
Before the Activity
- Provide students access to the Wildfires vs Cars CO2 Emissions PowerPoint Presentation (PPTX) via Google Classroom or similar.
- Note that the PowerPoint contains links to YouTube videos. Check that students are able to follow the links and watch the videos.
- Provide students access to the Wildfires vs Cars Graphing Exploration Excel worksheet (XLSX) via Google Classroom or similar.
- Make copies of the Wildfires vs Cars Graphing Directions (PDF) (1 per group).
- Make copies of the Knolls Fire and Evacuation Worksheet (PDF)(1 per group).
- Make copies of the CO2 Emissions Poster Presentation and Rubric (PDF)(1 per group).
During the Activity
Part 1 (Wildfires, cars, and greenhouse gas emissions introduction; 50 minutes)
- Read through the Introduction / Motivation section.
- Divide the students into groups of 2-3.
- Have students go through the Wildfires vs Cars CO2 Emissions PowerPoint Presentation (PPTX) on wildfires and cars and greenhouse gas emissions with their group.
- Have them answer the questions directly in the PowerPoint.
- When they finish the PowerPoint activity, have the students save the PowerPoint with their names and then turn them in as a graded assignment.
Part 2 (Calculating greenhouse gas emissions; 50 minutes)
- Hand out the Wildfires vs Cars Graphing Directions (PDF)(1 per group) and ensure that each group has access to the Wildfires vs Cars Graphing Exploration Excel worksheet (XLSX).
- Give students 50 minutes to complete the Wildfires vs Cars Graphing Exploration worksheet (XLSX) that compares the amount of CO2 released by wildfires to the amount released by cars. Note: Because Excel can be new to some students, they can reference the Wildfires vs Cars Graphing Directions (PDF), which will help them to easily analyze and graph data relating to wildfires and vehicles. The following steps are referenced in the Wildfires vs Cars Graphing Exploration worksheet. (XLSX)
- Have students start on Sheet 1 of the Excel document.
- Have students use the number of forest fires and the number of square miles burned per forest fire by year to determine an upper and lower boundary of CO2 released in kilograms (kg) from a burning fire each year from 1983 to 2022.
- Have students work on Sheet 2 of the Excel document. Here they analyze vehicle data.
- Have students graph the average miles per gallon (mpg) and the number of highway miles driven each year from 2004 to 2021.
- Finally, have students calculate the number of gallons of fuel burned to determine the kg of CO2 emitted.
- Have students write down their conclusions from each of the graphs they generate to help them compare wildfire data to car data to determine which is releasing more CO2.
Part 3 (Forest fire analysis; 50 minutes)
- Have students research the Knolls Fire using the Knolls Fire and Evacuation Worksheet. (PDF) The Knolls Fire occurred near Saratoga Springs, Utah, on June 28, 2020. This fire burned 15.6 square miles of land, and 13,000 residents were ordered to evacuate.
- Have students work through the worksheet, looking at the information and calculating the amount of CO2 released by the fire and the amount of CO2 released by the cars on the day of the evacuation.
Part 4 (Poster development and presentation; 100 minutes)
- Have students analyze their results from both Knolls Fire and the Excel analysis to create a poster presentation. Prompt them to refer to the CO2 Emissions Poster Presentation and Rubric (PDF)handout to create their presentations. See Figures 1 and 2 for examples of posters.
- Have each group present their argument of how the U.S. should allocate its resources to reduce CO2 emissions.
Figure 1. Student exemplar of a CO2 emissions posterCopyright Sheyenne High School, West Fargo, ND.
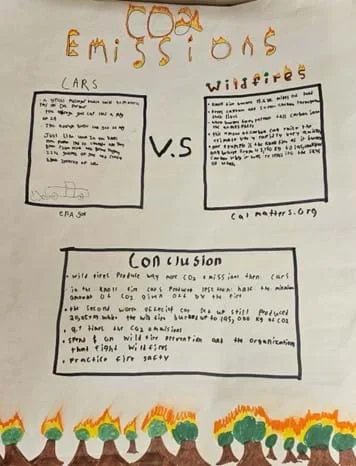 Figure 2. Student exemplar of a CO2 emissions posterCopyright Sheyenne High School, West Fargo, ND.
- carbon cycle
- Cycle demonstrating the movement of CO2 through the biosphere, geosphere, atmosphere, and hydrosphere.
- greenhouse gases (ghg)
- Gases that are causing the earth to warm; they include carbon dioxide (CO2), methane (CH4), and nitrous oxide (N20).
- wildfire
- An unplanned, uncontrolled, and unpredictable fire in an area of combustible vegetation.
Pre-Activity Assessment
Students go through a Wildfires vs Cars CO2 Emissions Presentation (PPTX)on wildfires and cars and greenhouse gas emissions. They review the carbon cycle, analyzing how carbon moves through the cycle and seeing that it is out of balance because more CO2 emissions are being released into the atmosphere. Check students’ work using the Wildfire vs Cars CO2 Emissions Presentation Key (PDF). This sets the stage for the ultimate question of this unit, which is what causes most of the CO2 emissions. Is it wildfires, or cars?
Activity Embedded (Formative) Assessment
Students work on an Excel worksheet titled Wildfires vs Cars Graphing Exploration (XLSX) to compare the amount of CO2 released by wildfires to cars. Because Excel can be new to some students, they can reference the Wildfires vs Cars Graphing Directions (PDF), which will help them to easily analyze and graph data relating to wildfires and vehicles. Check students’ work using the Wildfires vs Cars Graphing Exploration Key (XLSX).
Post-Activity (Summative) Assessment
The final assessment is a poster presentation considering two major sources of CO2 emissions in the U.S., wildfires and vehicles. To begin, students research the Knolls Fire that occurred near Saratoga Springs, Utah on June 28, 2020, using the Knolls Fire and Evacuation Worksheet (PDF). This fire burned 15.6 square miles of land, and 13,000 residents were ordered to evacuate. Students look at the information and calculate the amount of CO2 released by the fire and the amount of CO2 released by the cars on the day of the evacuation on a worksheet. Check students’ work using the Knolls Fire and Evacuation Worksheet Key (PDF).
Finally, they analyze their results from both the Knolls Fire and the Excel analysis for a CO2 Emissions Poster Presentation and Rubric (PDF). Each group presents their argument of how the U.S. should allocate its resources to reduce CO2 emissions. See Figures 1 and 2 for examples of posters.
- Student may need reminders on unit analysis.
- Students may need some coaching for how to write formulas in Excel, so directions were added to the worksheet. Have students reference the Wildfires vs Cars Graphing Directions (PDF) for assistance.
Students could research a specific wildfire of their choice and incorporate what they find about CO2 emissions from that fire and evacuation to refine their arguments of how the U.S. should allocate its resources to reduce CO2 emissions.
This activity doesn’t take into account electric vehicles, so students could analyze the impact of different penetrations of electric vehicles. They could also look at what penetration of electric vehicles would be needed to reach net-neutral CO2 levels.
For the Excel activity, the formulas for each of the columns could be given to the students, so students would not have to type those.
Contributors
Martha Nelson (Math Teacher, Fargo Public Schools); Jill Wold (Science Teacher, West Fargo Public Schools); Sarah Crary (North Dakota State University); Beena Ajmera (Iowa State University)
Supporting Program
Research Experience for Teachers (RET) site at North Dakota State University
Acknowledgements
This research and work conducted in this study was completed as part of the Research Experience for Teachers (RET) site at North Dakota State University with the support of the National Science Foundation (Award No.1953102). Any opinions, findings, and conclusions or recommendations expressed in this material are those of the author(s) and do not necessarily reflect the views of the National Science Foundation.
Copyright
2024 by Regents of the University of Colorado; original © 2023 North Dakota State University