
Means, Modes and Medians
Legacy Curriculum
Hey there! This curriculum is no longer being curated or supported. It may contain materials that are no longer available or outdated information. Please use this document for reference.
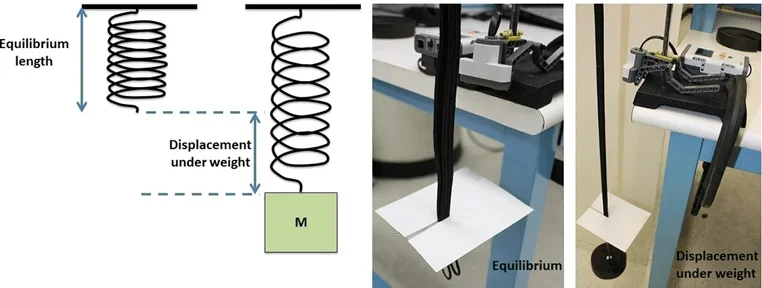 Figure 1. Experimental setup.Copyright 2010 Irina Igel, AMPS GK-12 Program, Polytechnic Institute of New York University
Students experience data collection, analysis and inquiry in this LEGO® MINDSTORMS® EV3-based activity. They measure the position of an oscillating platform using a ultrasonic sensor and perform statistical analysis to determine the mean, mode, median, percent difference and percent error for the collected data.
Data acquisition and analysis are two skills commonly practiced by scientists and engineers.
After this activity, students should be able to:
- Compute mean, mode and median for a given data set.
- Compute percent difference and percent error from raw, experimental data.
- Observe and analyze oscillations of a spring-mass system.
- CCSS.Math.Content.7.NS.A.3 Solve real-world and mathematical problems involving the four operations with rational numbers.
Grade 7
Do you agree with this alignment? - CCSS.Math.Content.HSS-ID.A Summarize, represent, and interpret data on a single count or measurement variable
Grades 9-12
Do you agree with this alignment? - CCSS.Math.Content.HSS-ID.A.1 Represent data with plots on the real number line (dot plots, histograms, and box plots).
Grades 9-12
Do you agree with this alignment? - CCSS.Math.Content.HSS-ID.A.2 Use statistics appropriate to the shape of the data distribution to compare center (median, mean) and spread (interquartile range, standard deviation) of two or more different data sets.
Grades 9-12
Do you agree with this alignment? - CCSS.Math.Content.HSS-MD.A Calculate expected values and use them to solve problems
Grades 9-12
Do you agree with this alignment?
- Students will develop an understanding of engineering design.
Grades K-12
Do you agree with this alignment? - Students will develop an understanding of the role of troubleshooting, research and development, invention and innovation, and experimentation in problem solving.
Grades K-12
Do you agree with this alignment?
- 7.NS.3 Solve real-world and mathematical problems involving the four operations with rational numbers.
Grade 7
Do you agree with this alignment? - S.ID.1 Represent data with plots on the real number line (dot plots, histograms, and box plots).
Grades 9-12
Do you agree with this alignment? - S.ID.2 Use statistics appropriate to the shape of the data distribution to compare center (median, mean) and spread (interquartile range, standard deviation) of two or more different data sets.
Grades 9-12
Do you agree with this alignment? - Summarize, represent, and interpret data on a single count or measurement variable
Grades 9-12
Do you agree with this alignment? - Calculate expected values and use them to solve problems
Grades 9-12
Do you agree with this alignment?
- HS-ETS1-4 Use a computer simulation to model the impact of proposed solutions to a complex real-world problem with numerous criteria and constraints on interactions within and between systems relevant to the problem.
Grades 9-12
Do you agree with this alignment?
- HS-ETS1-4 Use a computer simulation to model the impact of proposed solutions to a complex real-world problem with numerous criteria and constraints on interactions within and between systems relevant to the problem.
Grades 9-12
This resource focuses on the following Three Dimensional Learning aspects of NGSS:
Science & Engineering Practices- Use mathematical models and/or computer simulations to predict the effects of a design solution on systems and/or the interactions between systems.Do you agree with this alignment?
Disciplinary Core Ideas- Both physical models and computers can be used in various ways to aid in the engineering design process. Computers are useful for a variety of purposes, such as running simulations to test different ways of solving a problem or to see which one is most efficient or economical; and in making a persuasive presentation to a client about how a given design will meet his or her needs.Do you agree with this alignment?
Crosscutting Concepts- Models (e.g., physical, mathematical, computer models) can be used to simulate systems and interactions—including energy, matter, and information flows—within and between systems at different scales.Do you agree with this alignment?
Do you agree with this alignment? - Use mathematical models and/or computer simulations to predict the effects of a design solution on systems and/or the interactions between systems.
Each group needs:
- LEGO EV3 USB Cable or Bluetooth
- bungee cord or spring
- hooked weight set
- clamp-stand
- clamp
- cardboard platform, 5" x 4"
- MMM Worksheet (PDF), one per student
To share with the entire class:
- projector to show the MMM Presentation (PPTX)
- LEGO MINDSTORMS EV3 robot, such as EV3 Core Set (5003400) at https://education.lego.com/en-us/products/lego-mindstorms-education-ev3-core-set/5003400#lego-mindstorms-education-ev3
- LEGO MINDSTORMS Education EV3 Software 1.2.1, free online, you have to register a LEGO account first; at https://www.lego.com/en-us/mindstorms/downloads/download-software
- computer, loaded with EV3 1.2.1 software
Note: This activity can also be conducted with the older (and no longer sold) LEGO MINDSTORMS NXT set instead of EV3; see below for those supplies:
- LEGO MINDSTORMS NXT Base Set
- computer loaded with the NXT 2.1 software
Familiarity with the concepts of mean, mode and median.
(Show students the MMM Presentation (PPTX) as you present the following information.)
Scientific method is an approach used by scientists and engineers to understand phenomena through problem formulation, hypothesis, prediction, data collection and analysis. Scientists and engineers often use statistics to analyze data, present it to others, and sometimes even predict how the data will behave in the future. The most basic and frequently used statistical measures are mean, mode, and median.
Let's review the definitions of these quantities. The mean, or the average, of a dataset is found by adding all the numbers in the data set and then dividing this sum by the number of items in the set. The mode is determined by finding the most frequently occurring number in the set. There can be more than one mode, and in those cases, the set is referred to as multimodal. The median is simply the number that happens to be in the middle of an ordered set. Figure 2. Bungee!Copyright 2004 Ellywa, Wikipedia http://commons.wikimedia.org/wiki/File:Bungeejump_begin_Scheveningen_31_mei_2004.JPG, http://commons.wikimedia.org/wiki/File:Bungeejump_met_gestrekt_koord_Scheveningen_31_mei_2004.JPG
Engineering design projects sometimes require a theoretical design model to be compared to an experimental model. For example, the designer might need to analyze two values: one derived from calculations (theoretical), and another obtained from measurements. For this comparison, engineers determine the difference between these two values and quantify that difference by utilizing two simple tools, percent error and percent difference. Percent error quantifies the difference between actual (theoretical) and measured (experimental) values. Percent difference also quantifies the difference between two values. However, this tool does not assume either quantity to be incorrect even if a difference between them exists.
During this activity, you will experience mean, mode, median, percent error and percent difference while working with an oscillating weight hung from a bungee cord or spring, also known as a spring-mass (see Figure 1). This setup represents a simplified model of bungee jumping (shown in Figure 2)! As you've probably guessed, designing a real-life bungee jump requires many safety considerations. In particular, the licensed operators who offer bungee jumping must follow the standards and guidelines governing the jumps. For example, it is a standard procedure to double check calculations and fittings for every jump. However, to design a bungee jump setup one must first test it out without putting anyone in danger. In today's activity you will simulate bungee jump testing with your spring-mass system and measure the oscillations of the weight during its flight. You will use basic statistical measures to determine the average, median and most frequent locations of the weight during its motion. You will also compare two intervals of motion by finding the percent error and percent difference between mean values of the corresponding data. Let's get started!
Background
- A good source of instructions for usage and memory management of LEGO MINDSTORMS EV3 bricks can be found at https://www.lego.com/cdn/cs/set/assets/bltbef4d6ce0f40363c/LMSUser_Guide_LEGO_MINDSTORMS_EV3_11_Tablet_ENUS.pdf.
- Note that it might take approximately an hour to build, test and troubleshoot the spring-mass setup for this activity (shown in Figure 3).
Before the Activity
- Make copies of the attached MMM Worksheet (PDF), one per student.
- (optional) To prevent time loss during the activity, open LEGO MINDSTORMS software on student computers before students arrive.
- For each device:
- Use the MMM Building Instructions (PDF) to build the LEGO MINDSTORMS ultrasonic sensor attachment.
- Mount the attachment on a clamp stand (as shown in Figure 3). Secure the clamp stand to the table with a clamp or another heavy object (such as a textbook).
- Upload the MMM Mindstorms Program (EV3) (shown in Figure 4) onto the EV3 brick using LEGO MINDSTORMS software. Make sure that the ultrasonic sensor is connected to EV3 Port 2 and the touch sensor is connected to EV3 Port 1.
- Securely attach one end of a bungee cord or spring to the arm of the clamp stand (see Figure 3 and Figure 5).
- Cut out a cardboard platform that can be attached to the bungee cord (or spring). Make an incision into the cardboard and slide it onto the bungee cord. Position the cardboard as close to the end of the bungee cord as possible.
- Hang a hooked weight from the end of the cord and observe its oscillations. Note that some bungee cords need heavier weights to produce noticeable oscillations.
- Turn on the EV3 brick and run the MMM Mindstorms Program (EV3) file. The program guides its users through the process of data collection (see Figure 4). One can increase or decrease the number of data points collected with this program by changing the settings in the "Wait" or the "Loop" blocks.
- Show students how to retrieve collected data from the EV3 brick using LEGO MINDSTORMS software.
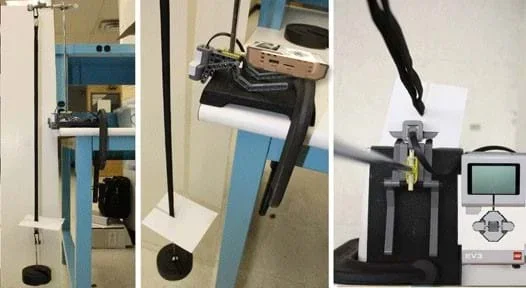 Figure 3. LEGO MINDSTORMS spring-mass setup.Copyright 2010 Irina Igel, AMPS GK-12 Program, Polytechnic Institute of New York University
![Image shows the LEGO MINDSTORMS program used to collect position data for the oscillating platform. The program asks users to 'Press [the Touch sensor] to start' in order to start recording data. As soon as the Touch sensor is pressed, the ultrasound sensor measures the distance to the platform every 0.05 seconds for the duration of 5 seconds. The EV3 brick records and stores 100 data points.](https://teachengwebstorageprod.blob.core.windows.net/te-content-prod/nyu_mmm_activity1_figure4new-1280x199.webp) Figure 4. LEGO MINDSTORMS program used to collect distance positions with an Ultrasonic sensor.Copyright 2010 Irina Igel, AMPS GK-12 Program, Polytechnic Institute of New York University
Figure 4. LEGO MINDSTORMS program used to collect distance positions with an Ultrasonic sensor.Copyright 2010 Irina Igel, AMPS GK-12 Program, Polytechnic Institute of New York University
With the Students
- Demonstrate how the spring-mass system moves when it is in equilibrium with no weight attached to the bungee cord as well as when the weight is attached to the bungee cord. (Note that initially the platform is in equilibrium because forces of gravity and tension of the spring are balanced, making the platform stationary). The platform initially oscillates when weight is hung from the spring/bungee because the forces are unbalanced (gravity and tension of the spring).
- Show students how to properly and safely attach the weight to the bungee cord. In a safe setup, the weight should not fall to the ground during the oscillations.
- Briefly discuss how a LEGO MINDSTORMS ultrasonic sensor and a LEGO MINDSTORMS EV3 brick are used to measure and record distances between the sensor and the oscillating platform.
- Demonstrate to students how to use the LEGO MINDSTORMS-based data collecting device:
- Turn on EV3 using the orange, square button.
- Navigate EV3 menu and find the uploaded MMM Mindstorms Program (EV3).
- Run the program.
- Follow the instructions by utilizing the Touch sensor (see Figure 4).
- To record oscillations of the weight hung from the bungee cord:
- Lift the weight to the bungee cord's equilibrium position (see Figure 6).
- When ready to collect data, let go of the weight.
- Press the touch sensor to start recording.
- After the data is collected, show students how to retrieve it from the EV3 brick using LEGO MINDSTORMS software. Show students how to export and view this data in .xls (Excel) or .txt (text document) formats.
- Distribute a worksheet to each student.
- Assign each team a computer and a spring-mass setup to use. Instruct students to begin the activity.
- When students are attaching their weights to the bungee cords, remind them about safety precautions.
- After the data is collected and retrieved from EV3 memory in .xls or .txt formats, students should refer to their worksheets. Each worksheet contains two parts, A and B, where students are asked to choose and record two sets of data points (see example in Figure 6). The sample population of data points can be chosen arbitrarily, but the order of data points has to stay unchanged. For example, the recorded five data entrees in Part A (Figure 6, top right) corresponds to the first five data points in the Excel screenshot (Figure 6, left).
- Ask students to analyze recorded data as outlined in the worksheet.
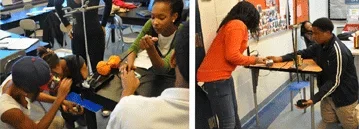 Figure 5. Students hard at work!Copyright 2010 Irina Igel, AMPS GK-12 Program, Polytechnic Institute of New York University
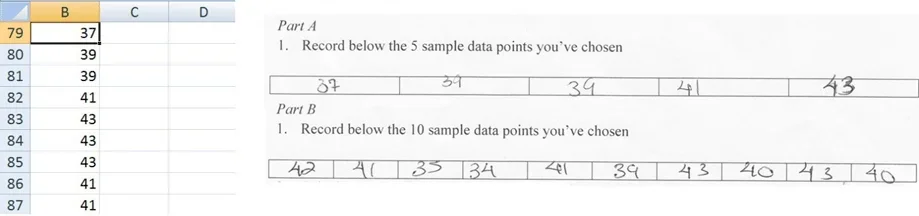 Figure 6. Recording data.Copyright 2010 Irina Igel, AMPS GK-12 Program, Polytechnic Institute of New York University
- equilibrium
- State in which a system or device is stable.
- mean
- The sum of a set of numbers divided by the number of items in the set.
- median
- The middle number in a sorted list of numbers.
- mode
- The number that occurs the most frequently in a set of numbers.
- oscillating
- A motion that goes back and forth.
- percent difference
- A technique for comparing two quantities. %Difference = |(x_1 - x_2) / ((x_1 + x_2) / 2)| x 100%. This measure is unit-less and does not assume either quantity to be incorrect if a difference between them exists.
- percent error
- A technique for comparing experimental and theoretical quantities. %Error=| (Experimental -Theoretical)/Theoretical|x100%. This measure is unit-less and assumes that one quantity is measured (experimental) and another quantity is accepted (theoretical).
- spring
- A device, such as a coil of wire, which regains its original shape after being compressed or extended.
Pre-Activity Assessment
Mean, Mode and Median in Daily Life: Encourage students to work in teams and discuss where they have encountered mean, median and mode in their own lives. What contexts might these statistical tools be used in? Guide them to think in terms of everyday life applications in addition to engineering and scientific usages. (Possible examples: Analyzing the collection of impact speeds required to obtain minimal bumper damage during car crash tests, recording daily spending to average it at week end, averaging grades at semester end, reading about population growth during Medieval Europe, reporting of weather, etc.)
Activity Embedded Assessment
Data Collection and Analysis: Have students complete the MMM Worksheet as they go through the activity.
Post-Activity Assessment
Discovery Questions: Ask students questions to gauge their understanding of the activity. How do you calculate the mean, mode or a median of a data set? (See presentation slides for examples and explanations.) What happens to the spring-mass after it starts oscillating? (The oscillations fade and the spring-mass comes to a halt.) What can you tell about the motion of the weight if you know that it passes through the same point more than once? (The weight is not moving in a straight line but instead oscillates up and down, passing the same locations during its motion. That means that the recorded data in Figure 6 will have one or more mode values.)
Be sure to securely attach the weight to the bungee cord or spiral spring to prevent it from crashing to the floor during oscillations.
- Check that the cables connecting the ultrasonic and touch sensors are plugged into the correct input ports on the EV3 bricks.
- Be sure that the bungee cords and securely-attached weights do not touch the floor during oscillations.
- Choose bungee cord and weight setups that produce long-lasting oscillations with large amplitudes.
- Make sure that the ultrasonic sensor has a clear view to the platform. If it does not, the sensor measures and outputs distance from itself to the ground as a constant value.
- For lower grades, omit discussion and problems that involve percent difference and error.
- For upper grades, ask students to plot and analyze collected data with Microsoft Excel®.
Montgomery, Douglas C., Engineering Statistics, 5th edition, John Wiley & Sons, Inc.; 2010 Bungee Jumping. Wikipedia. The Free Encyclopedia. Accessed July 23, 2012. http://en.wikipedia.org/wiki/Bungee_jumping
Contributors
Irina Igel; Ronald Poveda; Noam Pillischer
Supporting Program
AMPS GK-12 Program, Polytechnic Institute of New York University
Acknowledgements
This activity was developed by the Applying Mechatronics to Promote Science (AMPS) Program funded by National Science Foundation GK-12 grant no. 0741714. However, these contents do not necessarily represent the policies of the NSF, and you should not assume endorsement by the federal government.
Additional support was provided by the Central Brooklyn STEM Initiative (CBSI), funded by six philanthropic organizations.
Copyright
2013 by Regents of the University of Colorado; original © 2010 Polytechnic Institute of New York University