
Using Jupyter Notebooks to Explore Waves
As an introduction to analyzing sinusoidal waves, students learn how to use a Jupyter Notebook. They learn how to identify the frequency, wavelength, amplitude, period, and phase of a simple sinusoidal waveform. As they learn how to label the parts and properties of the waves, they connect these characteristics of waves to various real-world wave examples such as ocean waves, visible light, and sound. Students will examine a mathematical model of a sinusoidal waveform and connect each variable to its corresponding wave property. They will manipulate each variable of the model using Python code in a Jupyter Notebook and examine the effect of changing each variable on the resulting waveform.
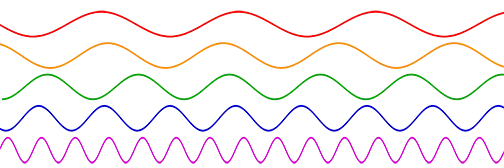 Waves colored like the frequencies of the visible spectrum. The bottom waves have higher frequencies than those above. The horizontal axis represents time.Copyright 2007 LucasBV, Public Domain, Wikimedia Commons, https://es.wikipedia.org/wiki/Sonido#/media/Archivo:Sine_waves_different_frequencies.svg
Understanding the properties of waves is important for engineers who design anything from solar panels to EEG monitoring devices. For waves, it is important for engineers to understand the distinctions between different frequencies of waves and what they mean. This knowledge will help engineers to better design machines and tools to both measure and regulate waves. Using a Jupyter Notebook and Python coding also helps students learn how to employ programming into their designs.
After this activity, students should be able to:
- Identify the parts of a wave (inflection point, period, etc.).
- Describe the effect of changing a wave’s frequency or amplitude on the wave’s graph.
- Describe the physical effect of changing a light or sound wave’s frequency or amplitude.
- Recognize that scientists and engineers need knowledge of waves to design useful products.
- CCSS.Math.Practice.MP4 Model with mathematics.
Grades K-12
Do you agree with this alignment?
- Students will develop an understanding of the relationships among technologies and the connections between technology and other fields of study.
Grades K-12
Do you agree with this alignment?
- MS-PS4-1 Use mathematical representations to describe a simple model for waves that includes how the amplitude of a wave is related to the energy in a wave.
Grades 6-8
This resource focuses on the following Three Dimensional Learning aspects of NGSS:
Science & Engineering Practices- Use mathematical representations to describe and/or support scientific conclusions and design solutions.Do you agree with this alignment?
- Science knowledge is based upon logical and conceptual connections between evidence and explanations.Do you agree with this alignment?
- Analyze data using tools, technologies, and/or models (e.g., computational, mathematical) in order to make valid and reliable scientific claims or determine an optimal design solution.Do you agree with this alignment?
Disciplinary Core Ideas- A simple wave has a repeating pattern with a specific wavelength, frequency, and amplitude.Do you agree with this alignment?
Crosscutting Concepts- Graphs and charts can be used to identify patterns in data.Do you agree with this alignment?
- Models (e.g., physical, mathematical, computer models) can be used to simulate systems and interactions—including energy, matter, and information flows—within and between systems at different scales.Do you agree with this alignment?
Do you agree with this alignment? - Use mathematical representations to describe and/or support scientific conclusions and design solutions.
Each student needs:
- laptop/tablet
- Google account
- Activity Sheet (PDF)
- Access to the What Is A Wave? Notebook File (IPYNB) (.ipynb)
- What Is A Wave? PowerPoint Presentation (pptx)
- What Is A Wave? PowerPoint Presentation (pdf)
- Pre-Assessment (docx)
- Pre-Assessment (pdf)
- Pre-Assessment Answer Key (docx)
- Pre-Assessment Answer Key (pdf)
- Post-Assessment (docx)
- Post-Assessment (pdf)
- Post-Assessment Answer Key (docx)
- Post-Assessment Answer Key (pdf)
- Activity Sheet (docx)
- Activity Sheet (pdf)
- Activity Sheet Answer Key (docx)
- Activity Sheet Answer Key (pdf)
- What Is A Wave? Notebook File (ipynb)
- Jupyter Notebook Guide (pdf)
A familiarity with graphing functions.
When you think of the word “wave,” what comes to mind? You might think of the waves in the ocean, or a sea of hands waving around at a baseball stadium. You may even think of light waves or sound waves—waves we can’t see! Waves are everywhere, and they carry important information about the environment. We can examine what this information is based on the wave’s characteristics. If we’re looking at a light wave, we can figure out what color the wave is based on the wave’s frequency or wavelength. If we’re listening to a sound wave, we can determine how loud and what pitch the sound is based on its amplitude and frequency, respectively!
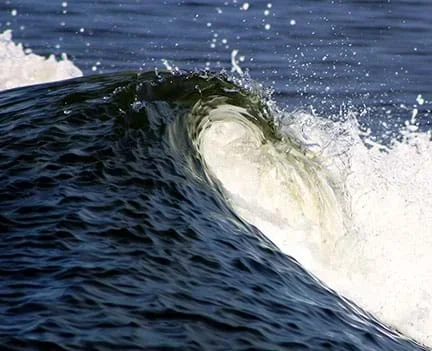 This picture provides just one of many examples of a wave, what other kinds of waves can you think of?Copyright 2004 Malene Thyssen (CC BY-SA 3.0), Wikimedia Commons, https://commons.wikimedia.org/wiki/File:Boelge_stor.jpg
Understanding waves and the information they carry, whether it’s a sound or light, is critical to designing instruments for using and manipulating sound and light. Do you listen to rock music? The electric guitar has several components that were engineered to make the sound loud and clear. Do you wear glasses? Your lenses were crafted to bend the light onto your eyes in a way that makes your sight clearer!
In this activity, we will discuss the background information that the scientists and engineers of your favorite band’s instruments and you or your friend’s glasses used when creating these designs. You will learn about what makes an airplane so loud and the ocean so blue. After this activity, you will have learned about how waves are modeled mathematically, and how changing the variables of the equation change the resulting wave.
Present the What Is A Wave? PowerPoint Presentation (PPTX). See slide notes below.
- Slide 1: Ask students to name different kinds of waves—they do not have to be “scientific”
- Examples: ocean waves, sound waves, light waves, hand waves, etc.
- Slide 4: Make sure you point to the inflection point on the wave shown in the figure.
- Slide 5: Show different ways of measuring period (crest to crest, trough to trough) on the wave shown in the figure.
- Slide 7: Mention that different frequencies in light waves make different visible colors (shorter wave = purple, longer wave = red).
- Slide 8: This slide contains an image that shows the different wavelengths of light and their associated colors.
- Slide 11: This slide contains a GIF that shows the effect of changing the amplitude, wavelength, and phase of a sine wave.
Background
Jupyter Notebooks are interactive coding guides with pre-written Python code that students and teachers may run with the press of a button. This activity requires the use of a Jupyter Notebook using Google Colaboratory—a free-to-use program that may be used with a Google account. To learn how to use Jupyter Notebooks, see our Jupyter Notebook Guide (PDF).
Before the Activity
- Hand out the Pre-Assessment (PDF) to students and have them complete it independently. Remind them that this assignment is NOT graded and that they are NOT expected to know the correct answers.
- Review the Jupyter Notebook Guide (PDF) and complete the tutorials referenced in the guide.
- Make copies of the Activity Sheet (PDF).
- Make sure students have access to the What Is A Wave? Notebook File (IPYNB). They will use it in Google Colaboratory.
- You can either post a link on a classroom website or email them the file.
With the Students
- Introduce the activity with the Introduction and present the PowerPoint Presentation (PPTX).
- Have students work individually (optional: Divide class into groups of 2 – 4 students).
- Hand out a copy of the Activity Sheet (PDF) to each student. Each student should turn in their own copy, even if they are in groups.
- Demonstrate how to open and run a Jupyter Notebook as shown in the Jupyter Notebook Guide (PDF). Check if students have any lingering questions about Jupyter and encourage them to explore other tutorials in Google Colaboratory.
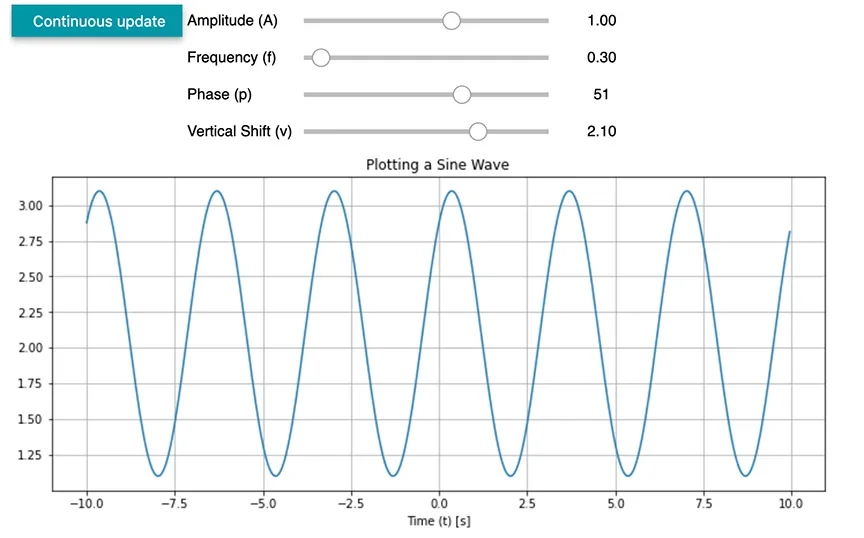 Jupyter Notebooks may be used to create customizable wave plots, like this one!Copyright 2020 Shappell, Nair, Welch, Banks, Opsal, & Menker, University of Missouri RET
- Students run the What Is A Wave? Notebook File (IPYNB) and modify the values, recoding the results on their worksheets. If students are working in groups, encourage them to help each other if they get stuck. If students are working individually, they may ask their neighbors for help.
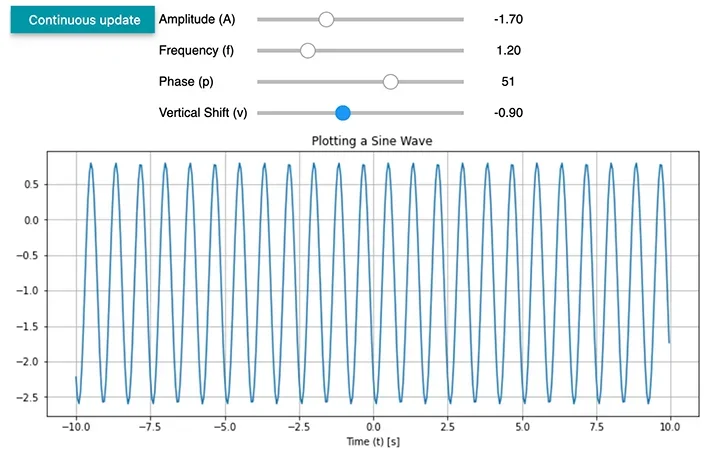 In this activity, try creating your own sinusoidal wave—then, ask a partner if they can try to recreate it without looking at your slider settings!Copyright 2020 Shappell, Nair, Welch, Banks, Opsal, & Menker, University of Missouri RET
- As students work, remind them that scientists and engineers often look at waveforms to assist them in design projects. Ask students to brainstorm how a scientist or engineer might apply their knowledge about waves. Prompt students’ thinking by sharing that waves are important to the design of radios, cell phones, Bluetooth, infrared cameras, Wi-Fi, televisions, etc.
- Hand out the Post-Assessment (PDF) to students and have them complete it independently.
Pre-Activity Assessment
Pre-Assessment: Hand out the Pre-Assessment (PDF) to students and have them complete it independently. Remind them that this assignment is NOT graded and that they are NOT expected to know the correct answers.
Embedded (Formative) Assessment
Activity Sheet: To ensure students are reading the waveform correctly and engaging in the activity, have students complete the Activity Sheet (PDF).
Post-Activity (Summative) Assessment
Post-Assessment: Hand out the Post-Assessment (PDF) to students and have them complete it independently.
Have students research examples of how scientists and engineers use waves and share their findings with the class in short presentations.
For younger students: After students complete the Jupyter Notebook activity, put students in small groups of 3-5 and have each group create a unique waveform. Then, display each group’s waveform and have all other groups try and recreate the wave.
Attention: This Activity requires a Google account and use of Google Colaboratory: Google Colab
Contributors
Erin Shappell; Dr. Satish Nair; Keegan Welch; Isabel Banks; Nathan Opsal; Adam Menker
Supporting Program
CyNeuro Lab, College of Engineering, University of Missouri
Acknowledgements
This activity was developed under National Science Foundation grant no. EEC 1801666—Research Experiences for Teachers in Neural Engineering, CyNeuro Lab at the University of Missouri. However, these contents do not necessarily represent the policies of the National Science Foundation, and you should not assume endorsement by the federal government.
Copyright
2020 by Regents of the University of Colorado; original © 2019 University of Missouri