
Graphing Your Social Network
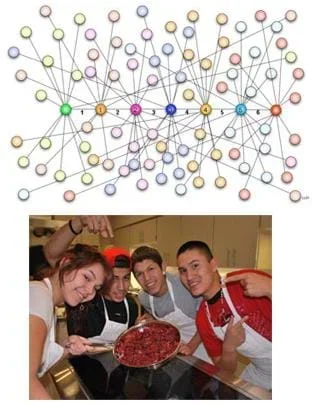 This graph shows the concept of six degrees of separation, the idea that everyone is no more than six "steps" away from each person on Earth. What does your social network look like?Copyright 2007 (top) Laurens van Lieshout, Wikimedia Commons; (bottom) U.S. Department of the Interior http://commons.wikimedia.org/wiki/File:Six_degrees_of_separation_01.png http://www.doi.gov/letsmove/indiancountry/about-us.cfm
Students analyze their social networks using graph theory. They gather data on their own social relationships, either from Facebook interactions or the interactions they have throughout the course of a day, recording it in Microsoft Excel and using Cytoscape (a free, downloadable application) to generate social network graphs that visually illustrate the key persons (nodes) and connections between them (edges). The nodes in the Cytoscape graphs are color-coded and sized according to the importance of the node (in this activity, nodes are people in students' social networks). After the analysis, the graphs are further examined to see what can be learned from the visual representation. Students gain practice with graph theory vocabulary, including node, edge, betweeness centrality and degree on interaction, and learn about a range of engineering applications of graph theory.
The mathematical structures of graph theory are widely applied in computer science, mathematics and engineering to model relationships between objects in sets of objects.
Software engineers use graphs to represent communication networks, data organization, computational devices, the flow of computation and more. They also exploit the relationships documented in social networks on websites like Facebook to market products to consumers. And they use graph theory to represent website structures, with the vertices being web pages and the edges being links between pages.
Electrical engineers and computer electronic engineers employ graph theory in the design of integrated circuits. Complex layered microcircuits can be represented as nodes interconnected by lines or arcs. The use of graph theory helps engineers optimize the density of components and minimize the connections, which optimizes processing speed and electrical efficiency.
After this activity, students should be able to:
- Apply graph theory to their social networks.
- Use Microsoft Excel and Cytoscape to develop graphs of their social networks.
- Analyze their own social network graphs to determine who is connected (more connections to people show importance of relationships/who has the most interactions) and which friends they interact with the most.
- Practice the application of graph theory by charting personal social networks.
- STEL-8N Use various approaches to communicate processes and procedures for using, maintaining, and assessing technological products and systems.
Grades 9-12
Do you agree with this alignment? - STEL-8Q Synthesize data and analyze trends to make decisions about technological products, systems, or processes.
Grades 9-12
Do you agree with this alignment?
- recognize and apply mathematics in contexts outside of mathematics
Grades -1-12
Do you agree with this alignment? - create and use representations to organize, record, and communicate mathematical ideas
Grades -1-12
Do you agree with this alignment? - use representations to model and interpret physical, social, and mathematical phenomena
Grades -1-12
Do you agree with this alignment? - use vertex-edge graphs to model and solve problems
Grades 9-12
Do you agree with this alignment?
- 12.1.1.e Use tools and technology to make detailed qualitative and quantitative observations
Grades 9-12
Do you agree with this alignment? - 12.1.1.g Analyze and interpret data, synthesize ideas, formulate and evaluate models, and clarify concepts and explanations
Grades 9-12
Do you agree with this alignment? - 12.1.3.e Communicate the problem, process, and solution
Grades 9-12
Do you agree with this alignment?
Each group needs:
- computer access
- Microsoft® Excel (or Google Docs), to record collected data
- Cytoscape, free downloadable software available at http://www.cytoscape.org/
- Microsoft Word (or Google Docs), for summary writing
- Social Networks Activity Instructions (PDF), one per student
- Social Networks Assessment (PDF), one per student
In this activity, you will analyze your social network using graph theory. Who else uses graph theory?
Software engineers use graph theory to analyze your (and everyone else's) relationships on Facebook. By using graph theory, software engineers can predict who will be interested in the things you are interested in and as a result, target ads to potentially interested parties. This is how the value of Facebook is created. It provides the ability to market products to people most likely to buy them.
Other engineers use graph theory to represent the interactions in complex systems. Structural engineers use graph theory to represent the forces in structural elements like trusses. Electrical and computer engineers apply graph theory to represent networks (communication, computer, etc.) and integrated circuits. In computer science, the research areas of data mining, image segmentation, clustering and networking are graph theory applications. For example, a data structure can be visualized in the form of a tree, which uses edges and vertices. Network topologies can be represented through graph theory with the nodes being the devices and the edges the communication links between them.
Your social network is composed of the people you communicate with on a regular basis. It includes people such as your friends, relatives and teachers. You can use Facebook to track your "network." Comments (that you post and that others post to you) count more than a "like." To draw and analyze your network, you will use Microsoft Excel and Cytoscape software applications.
Background
Work through the activity before conducting it with students so as to understand the process and how Cytoscape works. To do this, follow the detailed instructions in the Social Networks Activity Instructions (PDF). It is recommended that you conduct the social networks activity (this document) first and then the dramatic networks activity (Using Graph Theory to Analyze Drama), although the order is not that critical.
The overall activity goal is for students to visually identify relationships among the important people in their lives. Most students have Facebook accounts where they interact with each other. Facebook is the preferred network for the purposes of this activity, but other networks may be substituted. If students do not have any electronic social networks from which to gather data, have them tally the interactions they have throughout the course of a day. This activity is a good experience for all students, especially visual learners, because it enables them to experience their social networks in an entirely different way.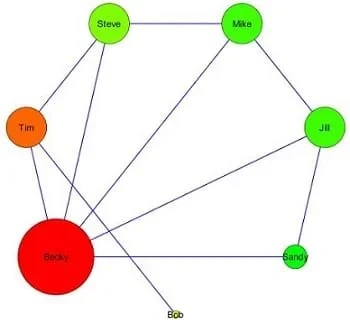 Figure 1. Example social network graph generated using Cytoscape.Copyright 2012 Ramsey Young, University of Nebraska-Omaha
The full procedure for the activity is explained in the Social Networks Activity Instructions (PDF). Students perform two main steps: 1) data collection and 2) data application.
During data collection, students track and record interactions between people they know. This helps them determine where information can most efficiently be distributed and what kind of group role each friend has in their relationships, and develop a better understanding of their social groups. To obtain data, students look closely at either a social network they are subscribed to or their social interactions throughout a day. Students capture the results of the interactions into an Excel spreadsheet, essentially documenting a network.
In the data application step, students use the open source program Cytoscape to examine the networks they have documented. The Cytoscape application generates a graph of a network's relationships, indicating the more important nodes in different sizes and colors than less-important nodes (see Figure 1). These graphs are visual representations that show the importance of their social networks.
Before the Activity
- Install the Microsoft Excel and Cytoscape software on student computers. The free, open-source application Cytoscape is available at http://www.cytoscape.org/. Click "Download Cytoscape now" and follow the instructions to download.
- Make copies of the Social Networks Activity Instructions (PDF) and the Social Networks Assessment (PDF) one each per student.
- Students collect data on their own social networks, but can share a computer in small groups, helping each other generate the Cytoscape graphs or taking turns.
With the Students—Data Collection
- Hand out the instructions sheets and give students some time to read through them and ask questions.
- Direct students to track the interactions between people they know by looking closely at either a social network they are subscribed to (such as Facebook, Twitter or MySpace) or their interactions with people throughout the day. By doing this, they will develop a better understanding of their social groups, and learn where information can most efficiently be distributed and what kind of group role each friend has in their relationships.
- Review with students the basic rules for data collection, which are also provided on the instructions sheet:
- If looking at Facebook as the electronic social network resource, look at about three pages of interactions. For the people that you interact with on those three pages, go to their Facebook pages and see who they have been interacting with on the first pages of their walls.
- If you look at your Facebook timeline, do not go back earlier than 30 threads on your wall and 10 threads on others' walls.
- If a person comments on your wall and you respond, give the numerical value of 2 to that interaction.
- If the conversation continues, count the number of posts in the thread between the two people for the interaction.
- If someone comes into the post later, count the first post and their later post as the interaction.
- The first post in a thread is the conversation starter. Assume this is targeted only at the people who participate in that conversation.
- Not all interactions are between just two people. Sometimes you must decide if a person is speaking to one person or a group of people. If a person is speaking to a group and only one person responds, only record 1 interaction between the first person and the group and 2 between the first person and the second who responded.
- Count "Likes" as interactions. If the number of Likes exceeds 10, only do the first 10.
- Based on the data collection rules, direct students to each create an Excel file that documents the number of interactions between any two people that are part of their social networks (see Figure 2 for an example; also on instructions sheet).
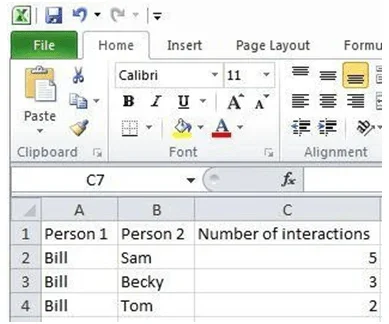 Figure 2. Example Excel file of social interactions data.Copyright 2012 Ramsey Young, University of Nebraska-Omaha
With the Students—Data Application
Direct students to refer to the instructions as they use the Cytoscape open source application to look closer at the networks they have created.
- Open Cytoscape. The icon looks like this:
- Click File > Import > Network from table (Text/MS Excel)
- Click on the Select File(s) button > select the Excel file you created from where you saved it on the computer.
- Select the interaction relationship.
- Set Source Interaction to the column containing the first person.
- Set Interaction Type to the column containing the number of interactions between person #1 and person #2.
- Set Target Interaction to the column containing person #2.
- Click Import and Cytoscape renders a rough version of the network, similar to Figure 3.
- In order to make the data useful, click on the Plugins menu at the top of the page > select Network Analysis > click on Analyze Network.
- Select the Treat Network as Undirected bubble > click OK.
- Select Visualize Parameters, which alters the nodes and connections.
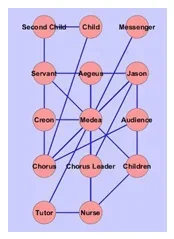 Figure 3. Rough version of a network graph created by Cytoscape.Copyright 2012 Ramsey Young, University of Nebraska-Omaha
 - Set the Map node size to "degree." This represents the people that do the most communicating as larger nodes.
- Set the Map node color to "BetweennessCentrality." This changes to warmer colors the people (nodes) that do the most communicating with great numbers of other people.
- As necessary, use your mouse to spread the nodes out so that they do not block each other.
- Lead a class discussion to share and compare the resulting Cytoscape graphs of students' social networks: Now you have a visual representation of your social network relationships showing which people in your social community have the greatest influence with other people. (Example discussion questions follow.) What do you observe in this visualization of your social network? Who in your network has the most interactions? Who is the most connected to others by the level of communication? Who do you interact with the most? Any surprises? In your social network, which people might have the greatest influence with other people? Are your more connected relationships the most important ones to you, or not? Why are some nodes larger than other, or different colors? What else do you notice? Looking at the degree of interactions and betweenness shown by the graphs, what else do you notice about the relationships? To what else can the same principles we see in these graphs be applied?
- Conclude by handing out the assessment sheets for a summary writing assignment, as described in the Assessment section. If time permits, or for students who finish early, direct them to the Activity Extension suggestion.
- betweenness
- Betweenness is a centrality measure of a node (vertex) within a graph. It measures the number of times a node connects two other nodes by the shortest path. It is a measure of importance for nodes in the graph. The higher the betweenness centrality, the more important the node; in a social network, the more important the "friend."
- child vertex
- Nodes in a graph that are connected to a given node.
- cytoscape
- An open source bioinformatics software application that can be used to visualize interactions between nodes in a network.
- degree of interaction
- The number of edges connected to a node, with loops (interactions with itself) counted twice.
- edge
- A connection between nodes.
- graph theory
- The study of mathematical structures that model relationships between objects from a collection.
- node/vertex
- The fundamental unit of which graphs are formed.
- sibling vertex
- Nodes in a graph that are not directly connected to a given node. Sibling vertices are both children to the same parent.
Activity Embedded Assessment
Observations: As students are engaged in the activity ask these (or similar) questions:
- Can students explain what betweeness centrality tells us about the people in a graph?
- Do students know what degree of interaction in a graph is?
- Were students able to comprehend what the color and size of nodes mean in the Cytoscape graphs?
Post-Activity Assessment
Writing: At activity end, assign students to answer the following writing prompts, which are provided on the Social Networks Assessment (PDF). Review their answers to assess their mastery of the subject matter.
- Explain the graph theory vocabulary: node, edge, betweenness centrality, and degree on interaction. (Example answer: A node represents a point on the graph. In this activity, the nodes were my friends and family. An edge represents a connection between nodes. The edges in my social network graph represent a contact between two people. Betweenness is a measure of centrality for a particular node on the graph. In our activity, the nodes with the highest betweenness were people with the most contacts with other people. Degree of interaction is the number of edges connected to a node.)
- Explain what the size and color of the nodes on the Cytoscape graphs mean. (Example answer: The larger nodes represent people with more contacts and communication with others. Depending on the Cytoscape coloring scheme selected, the colors with the fewest interactions and the most interactions will be different, one a cool color and the other a warm color. Overall, the size and color of the nodes shows the importance of people relative to one another.)
- Describe some engineering applications of graph theory. (Example answer: Graph theory is useful to represent a wide range of complex systems in a visual way. Computer science [engineering] applications of graph theory include data mining, image segmentation, clustering and network applications. In addition, electrical engineers use graph theory to represent electrical component interactions in circuits, and structural engineers use graph theory to represent structural composition.)
Many students love being on Facebook during class, so closely monitor them during class to make sure they stay on task, and are not using Facebook for other purposes.
Have students log into WolframAlpha (computational knowledge engine) at wolframalpha.com and search for Facebook. Wolfram connects with Facebook and builds a complete social graph of your network. Besides visualizing connections with links and nodes, it tells you the age distribution of your friends, who you talk with most, most popular posts, and more. This is very cool, and may possibly be of real interest students! Also, it might be really interesting for students to compare the graphs they created to those created by Wolfram to see similarities and differences.
- Graph Theory in Drama
- Graphing Your Social Network
- Using Graph Theory to Analyze Drama
Contributors
Ramsey Young; Brian Sandall
Supporting Program
IMPART RET Program, College of Information Science & Technology, University of Nebraska-Omaha
Acknowledgements
The contents of this digital library curriculum were developed as a part of the RET in Engineering and Computer Science Site on Infusing Mobile Platform Applied Research into Teaching (IMPART) Program at the University of Nebraska-Omaha under National Science Foundation RET grant number CNS 1201136. However, these contents do not necessarily represent the policies of the National Science Foundation, and you should not assume endorsement by the federal government.
Copyright
2013 by Regents of the University of Colorado; original © 2013 Board of Regents, University of Nebraska