
Robo-mentum: Mass, Velocity, and Momentum Relationships
 Students assemble vehicles from their STEM kits.Copyright Diomil Haro, 2023
Student groups use STEM vehicle kits to learn about the relationships between linear momentum, mass, and velocity. Each group assembles their vehicle and then runs tests and gathers data to calculate their vehicle’s velocity/speed and linear momentum. This data is then used to create scatter plots of the three variables (linear momentum, mass, and velocity/speed), and the Desmos graphing calculator is used to model a direct relationship using linear regression, as well as model an inverse relationship using exponential regression.
Cars built before 1959 did not have seat belts. The seat belt was meant to keep the driver and passengers solidly attached to the car to prevent injuries in the event of a crash. However, during a crash people are still at risk of hitting the steering wheel or dashboard at high speed. To remedy this, engineers developed the airbag. When the car’s computer senses an extreme deceleration, the airbag deploys, which gradually changes the head’s momentum. A change in momentum over a longer time frame reduces the force on the body and helps prevent head injuries.
Momentum is also applied in mechanical engineering, such as when determining the reaction force on a pipe junction due to either a laminar or turbulent flow of the fluid used in the piping system. Knowing the force applied by the fluid on the junction will help determine what type of material, thickness, connection, etc. should be used to create an effective system.
After this activity, students should be able to:
- Assemble a vehicle using a STEM vehicle kit.
- Define linear momentum, mass, and velocity.
- Generalize the relationships between linear momentum, mass, and velocity.
- Measure an object’s mass (digital weighing scale), distance set to travel (meter stick), and time spent traveling a set distance (phone timer).
- Calculate an object’s velocity/speed and linear momentum (calculator).
- Create a scatter plot based on the three variables (linear momentum, mass, and velocity/speed (Desmos graphing calculator).
- Use the Desmos graphing calculator to model a direct relationship using linear regression, and model an inverse relationship using exponential regression.
- CCSS.Math.Content.7.EE.B.4 Use variables to represent quantities in a real-world or mathematical problem, and construct simple equations and inequalities to solve problems by reasoning about the quantities.
Grade 7
Do you agree with this alignment? - CCSS.Math.Content.HSA-REI.B.3 Solve linear equations and inequalities in one variable, including equations with coefficients represented by letters.
Grades 9-12
Do you agree with this alignment? - CCSS.Math.Content.HSS-ID.B.6 Represent data on two quantitative variables on a scatter plot, and describe how the variables are related.
Grades 9-12
Do you agree with this alignment?
- STEL-3G Explain how knowledge gained from other content areas affects the development of technological products and systems.
Grades 6-8
Do you agree with this alignment?
- HS-PS2-2 Use mathematical representations to support the claim that the total momentum of a system of objects is conserved when there is no net force on the system.
Grades 9-12
This resource focuses on the following Three Dimensional Learning aspects of NGSS:
Science & Engineering Practices- Use mathematical representations of phenomena to describe explanations.Do you agree with this alignment?
Disciplinary Core Ideas- Momentum is defined for a particular frame of reference; it is the mass times the velocity of the object.Do you agree with this alignment?
- If a system interacts with objects outside itself, the total momentum of the system can change; however, any such change is balanced by changes in the momentum of objects outside the system.Do you agree with this alignment?
Crosscutting Concepts- When investigating or describing a system, the boundaries and initial conditions of the system need to be defined.Do you agree with this alignment?
Do you agree with this alignment? - Use mathematical representations of phenomena to describe explanations.
- Introduction/Motivation Worksheet (docx)
- Introduction/Motivation Worksheet (pdf)
- Introduction/Motivation Worksheet Answer Key (docx)
- Introduction/Motivation Worksheet Answer Key (pdf)
- Pre-Activity Assessment Worksheet (docx)
- Pre-Activity Assessment Worksheet (pdf)
- Pre-Activity Assessment Worksheet Answer Key (docx)
- Pre-Activity Assessment Worksheet Answer Key (pdf)
- Post-Activity Assessment Worksheet (docx)
- Post-Activity Assessment Worksheet (pdf)
- Post-Activity Assessment Worksheet Answer Key (docx)
- Post-Activity Assessment Worksheet Answer Key (pdf)
Students should be familiar with:
- STEM vehicle kit assembly.
- Measurement of mass, time, and distance.
- Solving literal equations. (Literal equations are formulas involving multiple variables, such as the formula for momentum, "p = mv"; students should be able to manipulate a literal equation to express one variable in terms of the others.)
- Using the Desmos graphing calculator.
Today we’re going to learn about the relationships between linear momentum, mass, and velocity. You’ll be working in groups to assemble a vehicle from a STEM vehicle kit, and then run tests and gather data to calculate your group’s vehicle’s velocity/speed and linear momentum. Finally, your group will create scatter plots using this data.
(Distribute copies of the Introduction/Motivation Worksheet (PDF).
Show the following video on momentum (1:51 minutes): https://www.youtube.com/watch?v=EzNfvwPCFs0&t=6s
After the video, pose the following questions (also on the students’ worksheets):
Compare the three objects: Rank the amount of momentum from least to greatest.
- A bullet travelling at a very high speed
- A 1 kg melon rolling at a very low speed
- A truck at rest
Call on at least two groups to reveal their answer. Prompt a discussion for students to share why they chose the ranking. [Answer Key: Truck, melon, bullet – the truck has zero momentum because its velocity or speed is zero; the melon is next, even if it’s more massive than the bullet, because the bullet has a very high speed that would compensate for its small mass.])
Background
Linear momentum is the product of a system’s mass and its velocity. In equation form, linear momentum p is p = m v. You can see from the equation that momentum is directly proportional to the object’s mass (m) and velocity (v). Therefore, the greater an object’s mass or the greater its velocity, the greater its momentum.
Momentum is a vector quantity; it has both magnitude and direction. The direction of an object’s momentum is the same as the object’s velocity (also a vector quantity). This makes momentum useful to examine an object’s movement.
To further help students determine how to distinguish between a scalar and a vector quantity:
- A simple example is to have a student volunteer (with the classmates observing), to run a distance of five meters in the hallway. Ask the student what type of quantity the distance is. [Answer: The distance run represents a scalar quantity because you have only its measurement.]
- Now, ask the observing students: Was the running direction in terms of north, south, east, or west? Let’s say the answer is due north; then you can say that the distance now is called a displacement of five meters due north, because you have its measurement and direction at the same time, thus calling it a vector.
Another common example that they can relate to is a car driving on a highway. Explain that the speed registered in the dashboard is scalar, but once you incorporate that the car is driving in a southeast direction, you call it a velocity being a vector.
Before the Activity
The teacher assigns students into groups of five or allows students to select their group members, whichever is more feasible. Each group shall have the following roles, selected by the team members:
- Group leader: The leader guides the group to start assembling the assigned STEM kits following the kit’s manual. Using a digital scale, the leader measures their assembled car’s weight.
- Surveyor: The surveyor measures and marks on the floor a starting point and distances of 1 meter, 2 meters, and 3 meters on one single line. The leader, with the surveyor, places their toy car at the starting point of the measured line and starts the toy car from 0 meters to 1 meter, and repeats the process up to 2 meters and 3 meters.
- Timer: The timer measures the travel times.
- Recorder: The recorder records all pertinent data.
- Analyst: The analyst completes computations as required.
The leader guides the group to start assembling the assigned STEM kits following the kit’s manual. Using a digital scale, the leader measures their assembled car’s weight, and the recorder records it in a worksheet while the surveyor measures and marks on the floor a starting point and then a distance of 1 meter, 2 meters, and 3 meters on one single line. The leader, with the surveyor, places their toy car at the starting point of the measured line and starts the toy car from 0 meters to 1 meter, and repeats the process up to 2 meters and 3 meters, while the timer measures the travel times. The recorder records all pertinent data and gives the completed worksheet to the analyst, who does the computations as required.
With the Students
Part 1: (30 - 45 minutes) PREPARATION STAGE
- Distribute one kit to each group.
- Have students read the attached assembly instructions.
- Have students plan how to start the assembly.
- Have students assemble their kit. Students assemble vehicles from their STEM kits.Copyright Diomil Haro, 2023
- Have students test the final assembled kit by installing two AA batteries to ensure a working model.
Part 2: (45 - 60 minutes) IMPLEMENTATION STAGE
Reminder: The CGS system of units shall be used in this activity, since a small car model is to be used. Distance = centimeters, mass = grams, velocity = cm/sec, and momentum = gram-cm-s-1.
- Instruct the group leader to remind each group member of their role.
- Have the surveyor measure and mark a starting point and then three 1-meter distances in one straight line.
- Have the recorder prepare a sheet for data recording. Students should create a table to record the time it takes for the car to travel the distances of 0 meters to 1 meter, 0 meters to 2 meters, and 0 meters to 3 meters.
- Have the leader weigh the car model, provide the value to the recorder, and place the car model at the starting point.
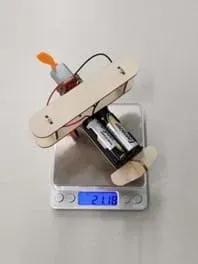 Students measure the mass of the model vehicle.Copyright Diomil Haro, 2023
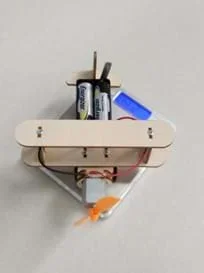 Students measure the mass of the model vehicle.Copyright Diomil Haro, 2023
- Have the timer prepare a timer to be used to measure the time traveled per given distance. Tell the timer that they will record the time traveled for distances of 0 meters to 1 meter, 0 meters to 2 meters, and 0 meters to 3 meters.
- Have the leader release the car for the specified distances of 0 meters to 1 meter, 0 meters to 2 meters, and 0 meters to 3 meters.
- Have the recorder fill in the data sheet with all data collected.
- Have the analyst calculate the velocity and momentum for each distance traveled.
- After all of the groups have finished gathering and recording data, have them share their data with each other.
- Have each group use the Desmos online graphing calculator to create scatter plots between momentum vs. mass, momentum vs. velocity, and mass vs. velocity.
- Have each group conduct research (using class notes, textbooks, or the internet) to determine the relationships represented in the graphs. As needed, provide students with support by suggesting they look for linear regression and exponential regression equations.
- After gathering the data of mass and velocity (e.g., distance and time), students should be able to use linear regression to show the direct relationship between momentum and mass (when velocity is constant), and momentum and velocity (when mass is constant). Also, students should be able to use inverse regression to show the inverse relationship between mass and velocity (when momentum is constant).
- Have a classroom discussion about the results.
- Have students reflect on their graphs and how they show the relationship between mass, velocity, and momentum.
- Ask students to discuss the differences between scalar and vector quantities and which category momentum falls into. [Answer: Scalar quantities have magnitude (e.g., speed) while vector quantities have magnitude and direction (e.g., velocity). Momentum is a vector quantity.]
- Students’ graphs should look similar to Figure 1 (Linear Regression of Momentum vs. Mass), Figure 2 (Linear Regression of Momentum vs. Velocity), and Figure 3 (Inverse Regression of Velocity vs. Mass).
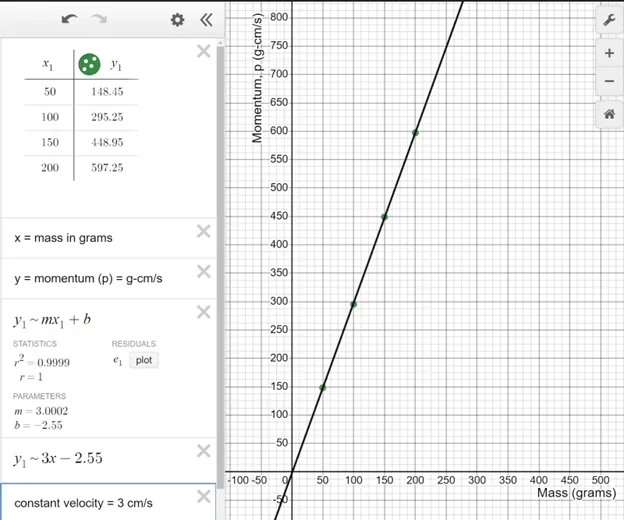 Figure 1. Graph showing a linear regression model for momentum vs. mass.Copyright Diomil Haro, 2023
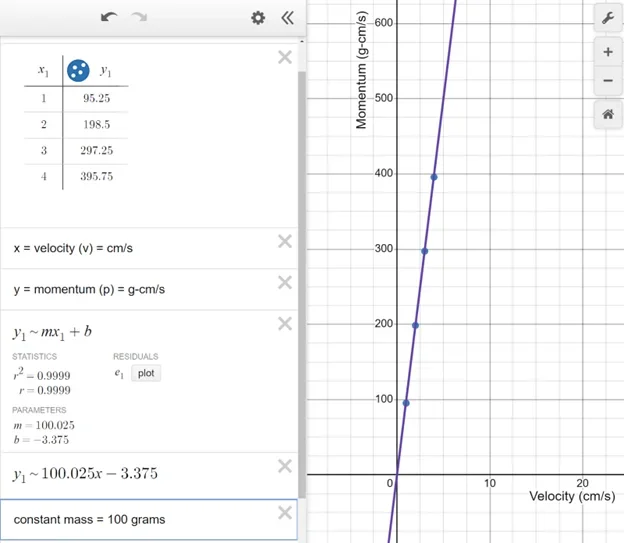 Figure 2. Graph showing a linear regression model for momentum vs. velocity.Copyright Diomil Haro, 2023
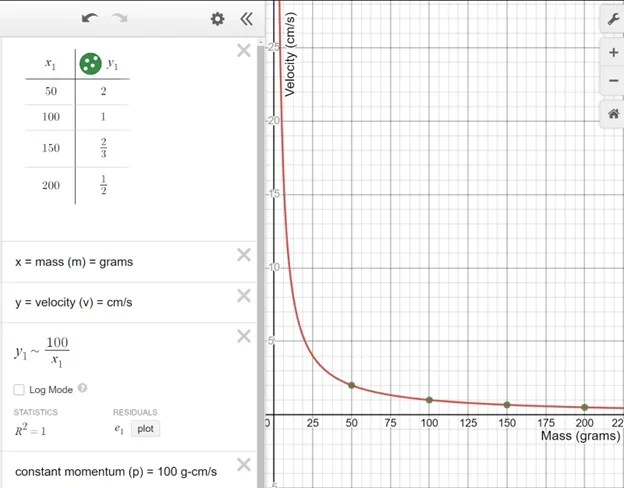 Figure 3. Graph showing an inverse regression model for velocity vs. mass.Copyright Diomil Haro, 2023
- exponential regression
- A model that explains processes that experience growth at a double rate.
- linear momentum
- The product of the mass of an object, m, and its velocity, v.
- linear regression
- A type of statistical analysis used to predict the relationship between two variables.
- mass
- The amount of matter in a particle or object.
- scatter plot
- A graph in which the values of two variables are plotted along two axes, with the pattern of the resulting points revealing any correlation present.
- speed
- The pace at which an object travels over a certain distance; mathematically defined as distance divided by time.
- velocity
- A quantity that designates how fast and in what direction a point is moving. It is speed with a specified direction.
Pre-Activity Assessment
Pre-Test Worksheet: Students complete the Pre-Activity Assessment Worksheet (PDF).
Activity Embedded (Formative) Assessment
Teamwork and Measurement: Check that students are working together in their roles as a team. They should collect data and collect calculations while working respectfully and with discussion.
Post-Activity (Summative) Assessment
Post-Test Worksheet: Students complete the Post-Activity Assessment Worksheet (PDF).
Instruct students to use the Engineering Design Process to design a vehicle that results in the highest momentum. Give them time to research more about momentum and vehicle design, brainstorm ideas, develop a prototype, and test their designs before gathering their final data and graphing the relationships between mass, momentum, and velocity.
Goyal, S.(2018). “What is momentum and its importance in everyday life?” https://www.jagranjosh.com/general-knowledge/what-is-momentum-and-its-importance-in-everyday-life-1515065314-1
Gozuacik, F; Pattison, D; Tabor, C. (2020). “Physics”. 8.1 Linear Momentum, Force, and Impulse. https://openstax.org/books/physics/pages/8-1-linear-momentum-force-and-impulse
Amazon.com. (n.d.). “Poraxy 5 in 1 STEM Kits” https://www.amazon.com/dp/B086DQNK7F?psc=1&ref=ppx_yo2ov_dt_b_product_details
Physics Online. (2015). “Linear Momentum – A Level Physics.” https://www.youtube.com/watch?v=PBojFeRN-z0
Moebs, W; Ling, S; Sanny, J. (2016). “University Physics.” 9.1 Linear Momentum. https://openstax.org/books/university-physics-volume-1/pages/9-1-linear-momentum
Contributors
Diomil Haro
Supporting Program
National Science Foundation GK-12 and Research Experience for Teachers (RET) Programs, University of Houston
Acknowledgements
This curriculum was developed under National Science Foundation RET grant no. 1855147— Research Experience for Teachers in Advanced Design and Manufacturing at the University of Houston. Any opinions, findings and conclusions or recommendations expressed in this material are those of the authors and do not necessarily reflect the views of the National Science Foundation.
Copyright
2024 by Regents of the University of Colorado; original © 2023 University of Houston