
Graphing the Speed of Slime
Students conduct a research-based activity to explore, graph, and evaluate the speed of slime, or how far and at what rate slime stretches. During the activity, the students review the major concepts of graphing speed by stretching gum or silly putty. After reviewing how to create and read speed on a graph, students create a “super-stretchy” slime sample. Students conduct tensile tests to determine the fastest speed the slime can stretch without snapping. Students analyze the slime stretching data by compiling it in a speed graph using Google Sheets or Microsoft Excel. Lastly, students communicate their findings through a poster presentation.
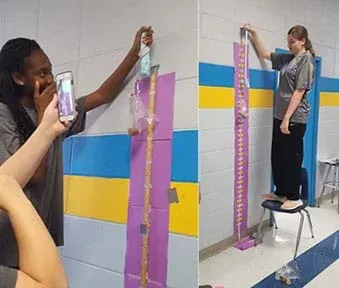 Using Tensile Strength to determine the speed of slime.Copyright 2019 Jamie Sorrell, University of Southern Mississippi RET
Manufactured materials are engineered to withstand certain conditions and to perform within a given set of standards. To ensure that materials meet those standards, engineers execute a variety of tests that push these materials to their farthest limits. For instance, engineers perform tensile strength testing on rubber, plastic, and fabrics to ensure their integrity and flexibility. Like engineers, students apply tensile testing in this activity to determine what the slime’s optimum stretch speed capability. Also like engineers, they compile their results in a readable form by communicate and compare their results in a speed graph.
After this activity, students should be able to:
- Use engineering skills to test the tensile strength of slime.
- Identify constants when testing the tensile of the slime.
- Collect quantitative data.
- Compile their quantitative data in a speed graph.
- Discuss the outcome of their results through a verbal interpretation of a speed graph.
- CCSS.ELA-Literacy.RST.9-10.3 Follow precisely a complex multistep procedure when carrying out experiments, taking measurements, or performing technical tasks, attending to special cases or exceptions defined in the text.
Grades 9-10
Do you agree with this alignment? - CCSS.ELA-Literacy.RST.9-10.7 Translate quantitative or technical information expressed in words in a text into visual form (e.g., a table or chart) and translate information expressed visually or mathematically (e.g., in an equation) into words.
Grades 9-10
Do you agree with this alignment?
- CCSS.Math.Content.HSN-Q.A Reason quantitatively and use units to solve problems.
Grades 9-12
Do you agree with this alignment? - CCSS.Math.Content.HSS-ID.A Summarize, represent, and interpret data on a single count or measurement variable
Grades 9-12
Do you agree with this alignment? - CCSS.Math.Content.HSS-ID.B.6 Represent data on two quantitative variables on a scatter plot, and describe how the variables are related.
Grades 9-12
Do you agree with this alignment? - CCSS.Math.Practice.MP2 Reason abstractly and quantitatively.
Grades K-12
Do you agree with this alignment? - CCSS.Math.Practice.MP4 Model with mathematics.
Grades K-12
Do you agree with this alignment?
- Students will develop an understanding of the relationships among technologies and the connections between technology and other fields of study.
Grades K-12
Do you agree with this alignment?
- SEP.6.9-12.1 Communicate scientific and technical information (e.g. about the process of development and the design and performance of a proposed process or system) in multiple formats (including orally, graphically, textually, and mathematically).
Grades 9-12
Do you agree with this alignment?
Each group needs:
To perform the gum stretch and analysis:
- bubble gum (or Silly Putty)
- meter stick
- graph paper (1 per student)·
- projector and computer
To create a slime sample:
- Slime Procedures Sheet (PDF)(1 per student)
- bottle of glue Elmer’s white glue
- 1000 ml beaker
- black permanent marker
- electronic balance
- weigh paper
- metal spatula
- 1 L (~1 qt) Ziploc bag
- pipette
- 10 ml graduated cylinder
- 100 ml beaker
To perform the tensile test:
- Testing Stations Construction Sheet (PDF)
- Testing Procedures Sheet (PDF)
- Data Table (PDF)(1 per student)
- Google Sheets Directions (PDF) or Microsoft Excel Directions (PDF)
- construction paper
- tape measure
- 2.5 cm (~1 in) masking tape
- clear tape
- sticky note pad
- black permanent marker
- 1 L (~1 qt) Ziploc bag
- 4 ‘snack’ size zipper bags
- 40 marbles
- video recording device
- teacher-manufactured tensile testing tool (see instructions below)
To create tensile testing tool:
- Tensile Tool Instructions (PDF)
- paper clip
- keyring loop
- sticky-sided (peel-and-stick) Velcro
- duct tape
- twine
- hole punch
To share with the entire class:
- contact solution, ~70 ml
- baking soda, ~16 g
- blue food coloring
- digital scale (a kitchen or lab scale that can measure mass in grams)
- Tensile Tool Instructions (docx)
- Tensile Tool Instructions (pdf)
- Testing Stations Construction Sheet (docx)
- Testing Stations Construction Sheet (pdf)
- Slime Procedures Sheet (docx)
- Slime Procedures Sheet (pdf)
- Testing Procedures Sheet (docx)
- Testing Procedures Sheet (pdf)
- Data Table (docx)
- Data Table (pdf)
- Google Sheets Directions (docx)
- Google Sheets Directions (pdf)
- Microsoft Excel Directions (docx)
- Microsoft Excel Directions (pdf)
- Conclusion Grading Rubric (docx)
- Conclusion Grading Rubric (pdf)
- Slime Reactant Investigation Lab Sheet (docx)
- Slime Reactant Investigation Lab Sheet (pdf)
A basic understanding of how to calculate speed, and how to construct and interpret a speed graph.
Virtually every product we purchase, use, or simply come in contact with, such as clothes, food containers, cars, or electronics, goes through various materials testing before manufacturing. Engineers test materials for a variety of reasons; the primary reason being for the safety of individuals or consumers who use these materials. Products undergo strenuous and specific performance tests to ensure the durability, longevity and productivity of the material.
Performance testing in the aerospace industry is just one example of the types of stress certain materials undergo before they are used in aircraft. This video demonstrates a type of stress test used on the wing of a Boeing 777. However, materials testing doesn’t have to be as complex as testing the aircraft components. In fact, we can replicate a type of stress test right here in the classroom!
In this activity, each group will determine the optimum stretching speed of slime by performing tensile tests. You will create a speed graph with your results and verbally discuss the outcome of your slime stretches as shown by the speed graph. But first let’s practice the proper method to collect and graph data with a piece of bubble gum.
Background
If students need a refresher on how to calculate speed or construct a graph, present the following video: Measuring Motion Graphing Speed.
Speed is a measurement of how fast an object moves. We mostly think of speed in miles per hour (mph), or in other countries, kilometers per hour (km/h). However, in physical science, a standard unit of measurement for speed is meters per second (m/s). Speed can be measured in two different scalar quantities: average speed and instantaneous speed. Average speed gives the distance an object travels over the total time span. Instantaneous speed gives the rate that an object is moving in a given moment of time. A linear distance-time graph is great way to describe motion.
Review the big idea of the Motivational Activity: How do we communicate speed in science? (Answer: Through a distance-time graph.)
Before the Activity
- Make copies of the Slime Procedures Sheet (PDF), Data Table (PDF), Conclusion Grading Rubric (PDF), one per student.
- Make copies of the Testing Stations Construction Sheet (PDF) (or see Optional below), Testing Procedures Sheet (PDF), Google Sheets Directions (PDF) or Microsoft Excel Directions (PDF), one per group.
- Divide students into 7 groups (3 or 4 students per group).
- Create 7 Tensile Testing Tools (See TensileTool Instructions (PDF)).
- Optional: set up Testing Stations (See Testing Stations Construction Sheet (PDF).)
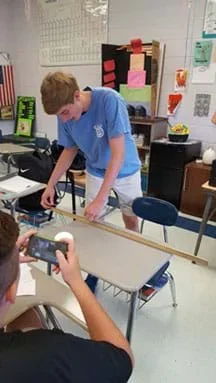 Collecting gum stretch data with a meter stick.Copyright 2019 Jamie Sorrell, University of Southern Mississippi RET
With the Students
Day 1
- Pose the initial question to students, “How fast can you stretch gum without making it snap?”
- Give students a meter stick, and give each student a piece of gum. If a student cannot chew gum, substitute it with Silly Putty.
- Draw a data table on the board for students to copy on a separate sheet of notebook paper (see Table 1 below).
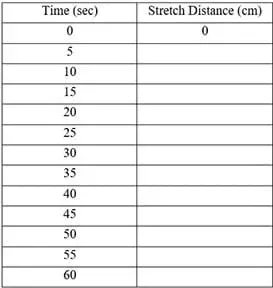
- Demonstrate the best practice for stretching gum and recording data using a video camera. These best practices include: stretching gum over and as close to the ruler so as to see, but not cover the numbers on the ruler; making sure that when starting to stretch the gum, the gum end is starting at 0; and when recording data with video to make sure the numbers on the ruler are clearly visible.
- Have students watch stretch video and record the data they captured in the video on the data table.
- Using the data, instruct students to use correct graphing rules to create their own speed graph. The speed graph should:
- Have x- and y- axes
- Place “time” on the x-axis
- Place “distance” on the y-axis
- Use correct units
- Ensure every space represents the same unit
- Label each axis including units
- Give the graph a title
- Use all available space on the graph
- Select several graphs that represent best examples of a constructed graph. Project one example and review how to read the speed graph. Project another example and ask students to list the correct construction qualities of the graph. Project a third example and ask students determine how to explain the features of the graph. Ask for volunteers to share their explanation of the features of the graph.
- Is the gum stretch speeding up or slowing down?
- Is there a constant stretching speed?
- How do you determine the slope of stretching speed?
Day 2
- Start the day off with the following question: “When stretching your gum in yesterday’s class, what did you need to be mindful of?” Ideal answer: If you stretched it too fast it would snap. After students answer your opening question, introduce them to the recipe for a “super-stretchy” slime and how they will use the same modeling as in the gum stretch to determine the stretching “speed” of this new material.
- Have students follow the Slime Procedures Sheet (PDF)to create their slime sample; see below for a review of those procedures:
- Measure 118 ml of water using a graduated cylinder and pour the water into a 600 ml beaker.
- Mark the water line on the beaker using a permanent marker.
- Pour out the water and dry the inside of the beaker.
- Pour glue into the marked 600 ml beaker to the permanent marker line. (Note: make sure to pour the glue into the middle of the beaker, so glue does not get stuck to the side, causing an inaccurate measurement.)
- Using an electronic balance, measure 1.5 g of baking soda; add this amount to the glue in the 600 ml beaker.
- Add two drops of blue food coloring and baking soda.
- Stir with a rubber spatula until food coloring is completely mixed.
- Measure out 7.4 ml of contact solution using a 10 ml graduated cylinder; pour the contact solution into a 50 ml beaker.
- Using a pipette, add a few drops of contact solution at a time to the glue, baking soda, and food coloring mixture while stirring at the same time with a rubber spatula; the mixture should begin to take on slime-like qualities.
- Store the slime sample into a labeled Ziploc bag until time for testing.
- Review the gum stretch activity and ask students: “When testing your gum, what was hard to keep constant?” Ideal answer: the force of each student’s pull. Tell students about a method they will use to determine the optimum stretching speed of slime while keeping the testing variables consistent.
- Have students create the testing station by following the Testing Stations Construction Sheet (PDF).
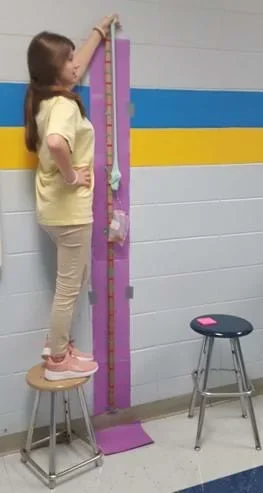 Determining the optimum speed of slime using a tensile test.Copyright 2019 Jamie Sorrell, University of Southern Mississippi RET
- Students will test their slime sample by following the Testing Procedures Sheet (PDF).
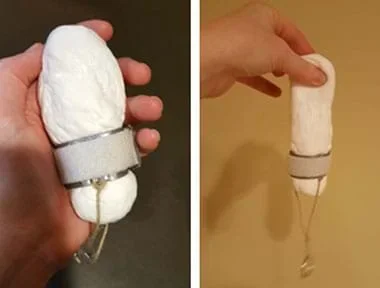 How to shape the slime when testing.Copyright 2019 Jamie Sorrell, University of Southern Mississippi RET
- Place a sticky note label at the top of the testing station. The label should have the amount of added stress weight to increase speed. (In the case of the initial test, there should be no added stress so put “0 g” on the note.)
- Mold the slime into a cylinder.
- Hold the slime at one end and place the other end at the top of the measuring tape marked zero.
- Record the slime stretching over the measuring tape using a camera.
- Record the stretching distance every 5 seconds until it reaches the floor or snaps (Use the Data Table (PDF)).
- Put 10 marbles in a Ziploc bag and record its mass.
- Place new sticky note label at the top of the testing station. The label should have the amount of added stress weight; that is, the mass of the marbles in the Ziploc bag.
- Mold the slime back into a cylinder.
- Put the bag of marbles into a bigger bag and attach them to the tensile tool.
- Attach the weighted tensile tool to one end of the slime cylinder with the rough surface of the Velcro facing in/around the slime.
- Hold the other end of the slime cylinder, and place the weighted end at the top of the measuring tape marked zero.
- Video the slime stretching over the measuring tape using a cell phone video camera.
- Record the slime stretching distance every 5 seconds until it reaches the floor or snaps.
- Continue steps 6-13 adding 10 marbles every cycle.
- Graph results using Google Sheets or Microsoft Excel; students may also elect to graph their data by hand on graph paper. See Google Sheets Directions (PDF) or Microsoft Excel Directions (PDF).
- Have students determine the final rate of each slime drop. Each group will present their graphs, slime rates and their conclusion through a group verbal presentation. In the presentation, each student is responsible to explain the results from at least one slime drop.
- Use the Conclusion Grading Rubric (PDF) to grade student presentations.
- average speed
- The speed calculated over the entire duration of a trip; average speed = total distance/total time.
- instantaneous speed
- The rate at which an object is moving at a given moment in time.
- linear graph
- A collection of data points which can form a straight line. The slope of the line on a distance-time graph is speed.
- speed
- The ratio of the distance an object moves over the amount of time the object is or was in motion; speed = distance/time.
- tensile
- The capability of how a given material can stretch.
- tensile strength
- How much stress a material can withstand while being pulled apart.
Pre-Activity Assessment
Observations: Students can observe the method for collecting speed data from the gum stretch. They will work together to collect data and present in a linear distance/time graph.
Activity Embedded Assessment
Analyze: Have students be active participates in sample creation and testing. Students will document their quantitative data in the Data Table (PDF) then perform data analysis through creation of a speed graph.
Post-Activity Assessment
Presentations: Students will print their results of the data on a presentation graph and share their results/conclusions with the class. The students will be assessed using the Conclusion Grading Rubric (PDF).
- To save time, construct the testing centers and the tensile tool before beginning the activity, as well as arranging the marbles into preset groups of increasing mass.
- Create extra tensile tools for backups.
Students can investigate the reactants of slime. Students can determine which reactant causes the slime to stretch fast. See Slime Reactant Investigation Lab Sheet (PDF).
Chem Matters: The Science of Slime!, American Chemical Society. December 2004. https://www.acs.org/content/dam/acsorg/education/resources/highschool/chemmatters/articlesbytopic/solidsliquidsgases/chemmatters-dec2004-slime.pdf. Retrieved November 12, 2019.
Easy Slime Recipe with Saline Solution. Little Bins for Little Hands. August 21, 2008. https://littlebinsforlittlehands.com/how-to-make-saline-solution-slime-recipe/ Retrieved November 12, 2019.
Physics for Kids: Speed and Velocity. Ducksters Education Site. www.ducksters.com/science/physics/speed_and_velocity.php Retrieved November 12, 2019.
Wysession, Frank, & Yoancopoulos. Physical Science Concepts in Action. Pearson School. 2011.
Contributors
Jamie Sorrell; Kayla Karl
Supporting Program
Research Experience for Teachers Program, School of Polymers and High Performance Materials, University of Southern Mississippi
Acknowledgements
This activity was developed under the Research Experiences for Teachers (RET) in Engineering and Computer Science Site for Sustainable Polymer Engineering Research program in the University of Southern Mississippi’s School of Polymers and High Performance Materials, funded by National Science Foundation RET grant no. EEC 1406753. However, these contents do not necessarily represent the policies of the NSF, and you should not assume endorsement by the federal government.
Copyright
2019 by Regents of the University of Colorado; original © 2018 University of Southern Mississippi