
Sensors and Scatterplots
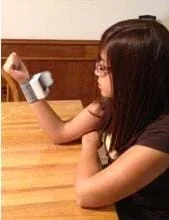 A student uses a wrist blood pressure sensor to measure her blood pressure and pulse rate.Copyright 2013 RET-ENET Program, The University of Texas-Pan American.
Students are introduced to several types of common medical sensor devices, such as ear and forehead thermometers, glucometers and wrist blood pressure monitors; they use the latter to measure their blood pressure and pulse rates. Students also measure their heights and weights in order to calculate their BMIs (body mass index). Then they use the collected data to create and analyze scatterplots of the different variables to determine if any relationships exist between the measured variables. Discussions about the trends observed and possible health concerns conclude the activity.
Sensor devices are tools designed by biomedical engineers for use in the medical field, as well as for other engineering applications. Medical research and development is growing as engineers design newer and better performing sensors. As part of the design cycle, engineers measure, collect and analyze data. When investigating relationships between two variables, scatterplots are utilized to enable engineers to examine any trends that exist.
After this activity, students should be able to:
- Collect and organize data.
- Create scatterplots.
- Analyze a scatterplot by determining the relationship between axis variables and data trend.
- Draw line of best fit and make predictions.
- CCSS.Math.Content.6.SP.B.5 Summarize numerical data sets in relation to their context, such as by:
Grade 6
Do you agree with this alignment? - CCSS.Math.Content.6.SP.B.5a Reporting the number of observations.
Grade 6
Do you agree with this alignment? - CCSS.Math.Content.6.SP.B.5b Describing the nature of the attribute under investigation, including how it was measured and its units of measurement.
Grade 6
Do you agree with this alignment? - CCSS.Math.Content.6.SP.B.5c Giving quantitative measures of center (median and/or mean) and variability (interquartile range and/or mean absolute deviation), as well as describing any overall pattern and any striking deviations from the overall pattern with reference to the context in which the data were gathered.
Grade 6
Do you agree with this alignment? - CCSS.Math.Content.6.SP.B.5d Relating the choice of measures of center and variability to the shape of the data distribution and the context in which the data were gathered.
Grade 6
Do you agree with this alignment? - CCSS.Math.Content.7.NS.A.3 Solve real-world and mathematical problems involving the four operations with rational numbers.
Grade 7
Do you agree with this alignment? - CCSS.Math.Content.8.SP.A.1 Construct and interpret scatter plots for bivariate measurement data to investigate patterns of association between two quantities. Describe patterns such as clustering, outliers, positive or negative association, linear association, and nonlinear association.
Grade 8
Do you agree with this alignment? - CCSS.Math.Content.8.SP.A.3 Use the equation of a linear model to solve problems in the context of bivariate measurement data, interpreting the slope and intercept.
Grade 8
Do you agree with this alignment? - CCSS.Math.Practice.MP2 Reason abstractly and quantitatively.
Grades K-12
Do you agree with this alignment? - CCSS.Math.Practice.MP4 Model with mathematics.
Grades K-12
Do you agree with this alignment?
- Students will develop an understanding of the relationships among technologies and the connections between technology and other fields of study.
Grades K-12
Do you agree with this alignment? - Advances and innovations in medical technologies are used to improve healthcare.
Grades 6-8
Do you agree with this alignment? - STEL-3G Explain how knowledge gained from other content areas affects the development of technological products and systems.
Grades 6-8
Do you agree with this alignment?
- SEP.1.6-8.2 Construct and interpret graphical displays of data to identify linear and nonlinear relationships.
Grades 6-8
Do you agree with this alignment? - CCC.8.6-8.11 Technologies extend the measurement, exploration, modeling, and computational capacity of scientific investigations.
Grades 6-8
Do you agree with this alignment? - SEP.3.6-8.6 Construct an explanation that includes qualitative or quantitative relationships between variables that describe phenomena.
Grades 6-8
Do you agree with this alignment? - SEP.7.6-8.4 Collect data to produce data to serve as the basis for evidence to answer scientific questions or test design solutions under a range of conditions.
Grades 6-8
Do you agree with this alignment?
- 7.3.A add, subtract, multiply, and divide rational numbers fluently; and
Grade 7
Do you agree with this alignment? - 6.12 Measurement and data. The student applies mathematical process standards to use numerical or graphical representations to analyze problems. The student is expected to:
Grade 6
Do you agree with this alignment? - 6.1.D communicate mathematical ideas, reasoning, and their implications using multiple representations, including symbols, diagrams, graphs, and language as appropriate;
Grade 6
Do you agree with this alignment? - 7.3.B apply and extend previous understandings of operations to solve problems using addition, subtraction, multiplication, and division of rational numbers.
Grade 7
Do you agree with this alignment? - 8.5.D use a trend line that approximates the linear relationship between bivariate sets of data to make predictions;
Grade 8
Do you agree with this alignment? - 8.11.A construct a scatterplot and describe the observed data to address questions of association such as linear, non-linear, and no association between bivariate data;
Grade 8
Do you agree with this alignment?
For the teacher's introduction:
- computer with projector to show the Introduction to Sensors and Scatterplots Presentation (PPTX), a Microsoft® PowerPoint® file
- variety of medical sensors, such as: thermometers (ear, mercury oral, digital oral, forehead strips), glucometer, blood pressure monitor (borrow or purchase); if purchasing, approximate costs are: ear thermometer $45, digital oral thermometer $20, glucometer $20, and forehead strip thermometer kit $13
Each group needs:
- wrist blood pressure monitor, available for $20-35 at Amazon.com or local discount store/pharmacy (note: wrist monitors can be shared among groups if necessary)
- tape measure
- sticky notes, any size, one per student
- ruler
- calculator
- computer with internet access to Create A Graph (if not available, see note below)
- Sensors and Scatterplots Pre-Activity Assessment (PDF), one per student
- Student Data Sheet (PDF), one per student
- Creating and Analyzing Scatterplots Worksheet (PDF), one per student
- Scatterplots with Technology Worksheet (PDF), one per student
- copy of completed Class Data Sheet (PDF), one per student
- Sensors and Scatterplots Post-Activity Assessment (PDF), one per student
To share with the entire class:
- 2-3 digital body weight scales
- Class Data Sheet (PDF)
Materials note: This activity uses the Create A Graph online tool at https://nces.ed.gov/nceskids/createagraph/default.aspx, an application that enables students to independently and quickly create graphs. Thus, students need access to computers with internet connections for part of the Day 3 activity. For teachers and students who do not have internet access, an alternate worksheet is provided that uses Microsoft® Excel® to create scatterplots. In addition, another worksheet is available for manual graphing. See the Attachments section.
- Sensors and Scatterplots Introduction Presentation (pptx)
- Sensors and Scatterplots Introduction Presentation (pdf)
- Sensors and Scatterplots Pre-Activity Assessment (docx)
- Sensors and Scatterplots Pre-Activity Assessment (pdf)
- Sensors and Scatterplots Pre-Activity Assessment Sample (docx)
- Sensors and Scatterplots Pre-Activity Assessment Sample (pdf)
- Student Data Sheet (docx)
- Student Data Sheet (pdf)
- Student Data Sheet Sample (docx)
- Student Data Sheet Sample (pdf)
- Class Data Sheet (docx)
- Class Data Sheet (pdf)
- Creating and Analyzing Scatterplots – Excel Worksheet (docx)
- Creating and Analyzing Scatterplots – Excel Worksheet (pdf)
- Creating and Analyzing Scatterplots Worksheet (docx)
- Creating and Analyzing Scatterplots Worksheet (pdf)
- Creating and Analyzing Scatterplots Worksheet Student Example (pdf)
- Creating and Analyzing Scatterplots – Manual Graphing Worksheet (docx)
- Creating and Analyzing Scatterplots – Manual Graphing Worksheet (pdf)
- Scatterplots with Technology Worksheet (docx)
- Scatterplots with Technology Worksheet (pdf)
- Scatterplots with Technology Worksheet Answer Key (docx)
- Scatterplots with Technology Worksheet Answer Key (pdf)
- Sensors and Scatterplots Post-Activity Assessment (docx)
- Sensors and Scatterplots Post-Activity Assessment (pdf)
- Sensors and Scatterplots Post-Activity Assessment Sample (pdf)
Students should know how to do the following:
- Solve problems involving rational numbers.
- Calculate averages.
- Graph in the coordinate plane.
Students should be familiar with the following:
- Create and analyze scatterplot trends.
- Make predictions from lines of best fit.
(Be prepared to show sample medical sensors, the presentation and [optional] two short online videos. Also have ready copies of the pre-activitiy assessment worksheets.)
How many of you have had a fever recently? (Expect a few students to raise their hands.) What kind of thermometer was used to measure your fever? (Expect a variety of responses.) A variety of thermometers are available to measure body temperature. Earlier thermometers were made of glass and used mercury to measure your temperature (if available, show students a mercury thermometer). Although they work well enough, mercury thermometers have some problems: for instance, it takes 3-7 minutes to read your temperature, and they are made of glass. When broken, these thermometers release mercury, which is dangerous to handle. Engineers started looking at these problems, and with the advancement of electronics, the digital thermometer was developed, which has nearly made the mercury thermometer an antique. The digital oral thermometer takes about 1 minute to get a reading while the ear and forehead thermometers take 1-3 seconds (if available, show students examples of digital thermometers). These designs make it easy and fast to take a temperature reading. In fact, the newest forehead thermometer design uses an infrared light so your forehead is never touched—this is perfect for taking a temperature reading for someone who is sleeping.
Have your parents ever taken you to the doctor when you had a high fever? (Expect some "yes" answers.) At the doctor's office, a visit usually begins with a medical assistant taking your vital signs: your weight, height, temperature, blood pressure and pulse. These measurements provide the doctor with important medical information about your health.
Today, we will use sensors to collect some of these measurements and then use the data to create and analyze scatterplots. Measuring, collecting and analyzing data accurately are important parts of the engineering design cycle. Scatterplots are useful to engineers when they are investigating relationships between two variables—just like we are going to be doing in this activity. Let's view a presentation that will clarify the variables and relationships we will be investigating.
(Proceed to show the presentation, followed by the pre-activity worksheets.)
Background
Body mass index, or BMI, is used as a screening tool for children to identify possible weight problems that may lead to health issues as an adult. The greater (higher) the BMI, the greater the risk of contracting diseases associated with obesity, including high blood pressure, diabetes, arteriosclerosis (narrowing and thickening of the arteries) and high cholesterol levels.
The following YouTube video illustrates these concerns: https://www.youtube.com/watch?v=uonXKiLZ9AE (note: make sure to preview the video to ensure that the content is appropriate for your students, as the video shows a graphic liposuction surgery; the video can be stopped right before the surgery scene, however, to eliminate any risk of inappropriateness). Although this video raises serious health concerns, children who lose weight and maintain a healthy lifestyle can erase the concerns discussed in this video, https://www.youtube.com/watch?v=-GRT0M0HuXY. It is important for students to learn about BMI and blood pressure, and this activity introduces both and demonstrates how easy it is for students to monitor them using simple medical sensors.
If you have small classes (less than 20 students), combine data from two or more classes so that the scatterplots have a sufficient number of data points.
Before the Activity
- Gather sample sensors for the activity introduction, as well as all materials needed for each group.
- A portion of this activity requires use of the Create A Graph tool at https://nces.ed.gov/nceskids/createagraph/default.aspx. If students do not have access to the internet, Microsoft Excel can be used to create the scatterplots with a different worksheet. If computers are not available, the scatterplots can be done manually with a different worksheet that has a few modifications (change relationships) to complete the additional scatterplots. Depending on your classroom resources, make copies of the appropriate Creating and Analyzing Scatterplots Worksheet; see the Attachments section for all worksheets.
- Make copies of the Sensors and Scatterplots Pre-Activity Assessment (PDF), Student Data Sheet (PDF), Creating and Analyzing Scatterplots Worksheet (PDF) and Scatterplots with Technology Worksheet (PDF), one each per student.
- Print out one copy of the Class Data Sheet (PDF), to be used by the entire class.
- After Day 1, make enough copies of the completed Class Data Sheet so that each student has a copy for Day 2 and Day 3.
- For the last day, make copies of the Sensors and Scatterplots Post-Activity Assessment (PDF), one per student.
With the Students
Day 1: Collecting Data
- Divide the class into groups of three students each and distribute the Student Data Sheets to each student.
- Following the Student Data Sheet instructions, have students weigh and measure themselves, and calculate BMI values.
- Next, using a wrist blood pressure cuff, and following the Student Data Sheet instructions, have student measure their blood pressures and pulse rates. Make sure they record their measurements on their data sheets and then transfer their data to the Class Data Sheet.
Day 2: Creating and Analyzing Scatterplots
- Direct students to organize into the same groups they had during the Day 1 activities. Distribute the Creating and Analyzing Scatterplots Worksheet, one per student (each student should complete his/her own worksheet), and copies of the completed Class Data Sheet from Day 1.
- Using the Class Data Sheets, students create scatterplots of BMI vs. systolic blood pressure (see Figure 1). Then, they analyze the scatterplot, identify a trend and write an explanation of the relationship between BMI and systolic blood pressure.
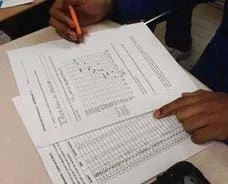 Figure 1: A student creates a scatterplot of systolic blood pressure vs. BMI.Copyright 2013 RET-ENET Program, The University of Texas-Pan American.
 - Next, using the Class Data Sheets again, have students create scatterplots of pulse rate vs. systolic blood pressure. They analyze the scatterplot, identify a trend and write an explanation of the relationship between pulse rate and systolic blood pressure.
- The students may also complete the second page of the class data worksheet which includes some statistics on random students. This allows them to calculate the variance and standard deviations of the sample sets. Explain that the higher the variance (or standard deviation) value, the more the data is scattered, and the more difficult it can be to find trends. Also explain that these values may be improved with more data sets (the students can expand this activity by calculating variance and standard deviation for the entire class!)
- Students turn in their worksheets at the end of the class period.
Day 3: Scatterplots with Technology
- Direct students to work in the same groups as in Days 1 and 2.
- Distribute the Scatterplots with Technology Worksheets to students (each student completes his/her own worksheet).
- On the worksheet, students use the Create A Graph application found at https://nces.ed.gov/nceskids/createagraph/default.aspx (or Microsoft® Excel® or manual methods) to generate scatterplots for the collected class data. If desired, graphs can be printed and lines of best fit drawn on the scatterplots. If Microsoft® Excel® is used, ask the students to plot a line of best fit as well as the R2 value. The R2 value is useful for determining "goodness of fit", or well the line describes the data set. Instructions may be found here: https://support.office.microsoft.com/en-US/article/add-change-or-remove-a-trendline-in-a-chart-fa59f86c-5852-4b68-a6d4-901a745842ad
- Using the class data sheets, have students create and analyze scatterplots of BMI vs. pulse rate, following the instructions on the Creating and Analyzing Scatterplots Using Technology Worksheet (see Figure 2).
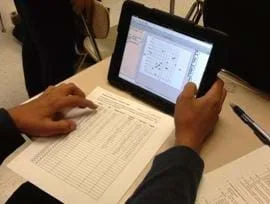 Figure 2. A student uses the Create A Graph application to create a scatterplot on his iPad®.Copyright 2013 RET-ENET Program, The University of Texas-Pan American.
 - Next, direct students to follow the worksheet instructions to create and analyze scatterplots that compare male and female data.
(Note: If the class size is fewer than 20 students or the mix of females/males in a class is far from equal [the female/male ratio should be ~50/50; a ratio of 60/40 is acceptable], it might be necessary to combine class data sheets.)
- Have students turn in the worksheets at activity end.
After the Activity
Have students present summaries of the BMI and blood pressure relationships they observed during the activity. Select a different relationship (individual vs. class vs. male vs. female, etc.) for each group to present to the class. Inform them that they they must present the data, the scatterplot and the analysis of the relationship they observed.
The expected results are as follows:
- A positive trend (correlation) exists between systolic blood pressure and BMI, which means that generally, as BMI increases, so does systolic blood pressure. (See Figure 3 for an example graph created with the Create A Graph online application.)
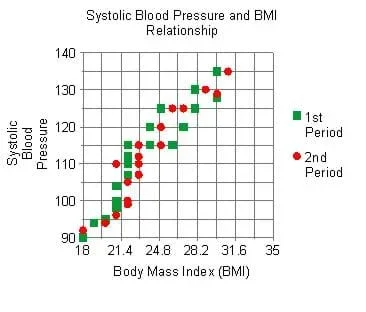 Figure 3. Example scatterplot created with Create A Graph shows a positive relationship: as BMI increases, so does systolic blood pressure.Copyright 2013 U.S. Department of Education. Institute of Education Sciences, http://nces.ed.gov/nceskids/createagraph/
 - No correlation exists between pulse rate and systolic blood pressure, so expect the second graphs to not show any trends.
- In the third scatterplot, as BMI increases so does pulse rate. When comparing male and female data, generally girls have higher BMI values due to the normal existence of more fat on female bodies compared to male bodies, so expect to see that reflected on the scatterplots.
After the presentations, lead a class discussion about the implications that high BMI values can have about people's health. Higher BMI values have been shown to indicate the possibility of serious health concerns, such as high blood pressure and diabetes. By collaborating with physicians, engineers play an important role in the medical field by designing advanced medical technologies that improve the quality of life for people.
- bmi
- Acronym for body mass index. A number calculated from a person's weight and height for the purpose of identifying potential health issues.
- diastolic blood pressure
- A measure of blood pressure when the heart is at rest between beats.
- line of best fit
- A straight line that best represents the data on a scatterplot.
- medical sensor
- A device used to measure physiological responses.
- negative correlation
- A relationship between two variables such that the values of one variable increase as the values of the other variable decrease.
- positive correlation
- A relationship between two variables such that their values increase or decrease together.
- pulse rate
- The number of times a heart beats per minute.
- systolic blood pressure
- A measure of blood pressure when the heart is pumping blood.
- trend
- A description of the relationship between two variables on a scatterplot.
Pre-Activity Assessment
Pre-Activity Worksheet: After presenting the Sensors and Scatterplots Introduction Presentation (PPTX), have students complete the Sensors and Scatterplots Pre-Activity Assessment (PDF), which is designed to check their understanding of the types of trends in scatterplots. Students need to be able to identify the following trends: positive correlation, negative correlation, no correlation, and need to be able to make predictions from trend lines since they will be creating and analyzing scatterplots.
Activity Embedded Assessments
Student Data Sheet: Students measure and record their weights and heights, and then calculate their BMI values. Also, they measure their blood pressures and pulse rates. Verify that students have collected their data accurately and have calculated their BMI, blood pressure and pulse values correctly on the Student Data Sheets (PDF). This data is used by the students to create and analyze scatterplots.
Creating and Analyzing Scatterplots Worksheet: Students use their completed Creating and Analyzing Scatterplots Worksheets (PDF) to create and analyze scatterplots of systolic blood pressure vs. BMI. For these plots, expect to see positive trends: the higher the systolic blood pressure, the higher the BMI value. Students also draw lines of best fit and make predictions from the scatterplots. The second scatterplot they create examines the relationship between pulse rate and systolic blood pressure; expect it to show that no relationship exists between these two variables.
Scatterplots with Technology Worksheet: Students use the completed Scatterplots with Technology Worksheets (PDF) to create and analyze two scatterplots using the Create A Graph website. The first scatterplot examines the relationship between BMI and pulse rate; expect the results to show positive trends. The second scatterplot examines the difference between male and female data for the BMI vs. systolic blood pressure relatioinship. Expect this scatterplot to show that females generally have higher BMI values. Verify that scatterplots are constructed and questions are answered correctly.
Post-Activity Assessment
Post-Activity Assessment: Have students complete the Sensors and Scatterplots Post-Activity Assessment (PDF), which is designed to evaluate their abilities to create and analyze scatterplots. Using the class data sheet, students select two different variables to analyze, construct a scatterplot, analyze and explain the correlation between the two variables and draw a line of best fit for the scatterplot. They also reflect on what they learned during this investigation.
Remind students to use caution when handling the sample sensor equipment, especially if it is borrowed. Some of the electronic components and connections are fragile and breakable.
- If no internet connection is available for the computers, use Microsoft Excel and the Creating and Analyzing Scatterplots – Excel Worksheet (PDF) instead.
- If no computers are available, then use the Creating and Analyzing Scatterplots – Manual Graphing Worksheet (PDF) for the activity.
Have students use the data collected to construct scatterplots on a graphing calculator. The line of regression (line of best fit) can then be found using the calculator.
Have students use the data to create other forms of data representation such as bar graphs, line plots, histograms, stem and leaf plots, box and whisker plots, and circle graphs.
Have students use other sensors, such as thermometers, to collect and analyze data.
Have students brainstorm new real-world examples of positive and negative correlations in a context different than the application discussed in this lesson. For instance, the number of pages printed by an inkjet printer and the amount of ink remaining in the printer cartridge (negative correlation), or the distance traveled by a car and the elapsed time (positive correlation).
For lower grades, use measured data to create grade level appropriate data representations, such as bar graphs, line plots or circle graphs.
Show students the "Obesity Epidemic in America" video on the risks associated with high BMI values (2:43 minutes): https://www.youtube.com/watch?v=uonXKiLZ9AE
Show students the "Dr. Miriam Vos Discusses Health Risks Related to Childhood Obesity" video on how normalizing weight reverses health risks (1:13 minutes): https://www.youtube.com/watch?v=-GRT0M0HuXY
About BMI for Children and Teens. Last updated September 13, 2011. Centers for Disease Control and Prevention. Accessed October 17, 2013. http://www.cdc.gov/healthyweight/assessing/bmi/childrens_bmi/about_childrens_bmi.html
Chronic Disease Prevention and Health Promotion. Last updated May 26, 2011. Centers for Disease Control and Prevention. Accessed October 17, 2013. http://www.cdc.gov/chronicdisease/resources/publications/AAG/obesity.htm
Contributors
Elma M. Piñon; Mounir Ben Ghalia
Supporting Program
RET-ENET Program, Electrical Engineering Department, The University of Texas-Pan American
Acknowledgements
This activity was created through The University of Texas-Pan American's Electrical Engineering Research Experiences for Teachers in Emerging and Novel Engineering Technologies (RET-ENET) Program with support from National Science Foundation grant number CNS 1132609. However, these contents do not necessarily represent the policies of the National Science Foundation, and you should not assume endorsement by the federal government.
Copyright
2013 by Regents of the University of Colorado; original © 2013 The University of Texas-Pan American