
Air Pollution in the Pacific Northwest
Legacy Curriculum
Hey there! This curriculum is no longer being curated or supported. It may contain materials that are no longer available or outdated information. Please use this document for reference.
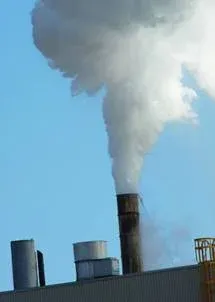 Students take a closer look at air pollutionCopyright 2004 Microsoft Corporation, One Microsoft Way, Redmond, WA 98052-6399 USA. All rights reserved.
Students are introduced to measuring and identifying sources of air pollution, as well as how environmental engineers try to control and limit the amount of air pollution. In Part 1, students are introduced to nitrogen dioxide as an air pollutant and how it is quantified. Major sources are identified, using EPA bar graphs. Students identify major cities and determine their latitudes and longitudes. They estimate NO2 values from color maps showing monthly NO2 averages from two sources: a NASA satellite and the WSU forecast model AIRPACT. In Part 2, students continue to estimate NO2 values from color maps and use Excel to calculate differences and ratios to determine the model's performance. They gain experience working with very large numbers written in scientific notation, as well as spreadsheet application capabilities.
Environmental engineers examine and quantify air pollution in order to determine how to alleviate this human-caused problem. Two main areas of study are: 1) remote sensing of air pollutants, 2) numerical modeling (from fundamental theories) of air pollutants. By quantifying and identifying air pollution sources, environmental engineers create better ways to sustain a healthy global environment.
After this activity, students should be able to:
- Explain how nitrogen dioxide behaves as an air pollutant.
- Measure air pollution using classroom tools.
- Explain where air pollution comes from and how it interacts with the atmosphere.
- Interpret maps and graphs.
- Quantify pollution sources and locate polluted areas using maps and graphs.
- Create plots and calculations using scientific notation and a spreadsheet application (Excel).
- Explain how environmental engineers apply what they know to help control the amount of air pollution.
Activity goals:
- To give students experience making calculations in Microsoft Excel, such as using the equal sign to make calculations, using "E" to represent scientific notation, and repeating calculations quickly in a table.
- To learn about a regulated air pollutant and its primary sources.
- To gain experience reading information from three different types of graphs.
- CCSS.Math.Content.6.SP.B.5 Summarize numerical data sets in relation to their context, such as by:
Grade 6
Do you agree with this alignment? - CCSS.Math.Content.6.SP.B.5a Reporting the number of observations.
Grade 6
Do you agree with this alignment? - CCSS.Math.Content.6.SP.B.5b Describing the nature of the attribute under investigation, including how it was measured and its units of measurement.
Grade 6
Do you agree with this alignment? - CCSS.Math.Content.6.SP.B.5c Giving quantitative measures of center (median and/or mean) and variability (interquartile range and/or mean absolute deviation), as well as describing any overall pattern and any striking deviations from the overall pattern with reference to the context in which the data were gathered.
Grade 6
Do you agree with this alignment? - CCSS.Math.Content.6.SP.B.5d Relating the choice of measures of center and variability to the shape of the data distribution and the context in which the data were gathered.
Grade 6
Do you agree with this alignment? - CCSS.Math.Content.7.RP.A.2b Identify the constant of proportionality (unit rate) in tables, graphs, equations, diagrams, and verbal descriptions of proportional relationships.
Grade 7
Do you agree with this alignment? - CCSS.Math.Content.8.SP.A.1 Construct and interpret scatter plots for bivariate measurement data to investigate patterns of association between two quantities. Describe patterns such as clustering, outliers, positive or negative association, linear association, and nonlinear association.
Grade 8
Do you agree with this alignment? - CCSS.Math.Content.8.SP.A.2 Know that straight lines are widely used to model relationships between two quantitative variables. For scatter plots that suggest a linear association, informally fit a straight line, and informally assess the model fit by judging the closeness of the data points to the line.
Grade 8
Do you agree with this alignment?
- In order to discern the effects of technology on the environment, students should learn that:
Grades K-12
Do you agree with this alignment?
- MS-ESS3-3 Apply scientific principles to design a method for monitoring and minimizing a human impact on the environment.
Grades 6-8
This resource focuses on the following Three Dimensional Learning aspects of NGSS:
Science & Engineering Practices- Apply scientific principles to design an object, tool, process or system.Do you agree with this alignment?
Disciplinary Core Ideas- Human activities have significantly altered the biosphere, sometimes damaging or destroying natural habitats and causing the extinction of other species. But changes to Earth's environments can have different impacts (negative and positive) for different living things.Do you agree with this alignment?
Crosscutting Concepts- The uses of technologies and any limitations on their use are driven by individual or societal needs, desires, and values; by the findings of scientific research; and by differences in such factors as climate, natural resources, and economic conditions. Thus technology use varies from region to region and over time.Do you agree with this alignment?
- Relationships can be classified as causal or correlational, and correlation does not necessarily imply causation.Do you agree with this alignment?
Do you agree with this alignment? - Apply scientific principles to design an object, tool, process or system.
Each student needs:
- Air Pollution in the Pacific Northwest Worksheet (PDF)
- computer with Microsoft Excel
- Starter xls (Excel) file (see attachment)
- pen or pencil
- Excel Step-by-Step Instructions for students, contained in the Teacher Supplemental Information (PDF)
To share with the entire class:
- computer with Microsoft Excel for teacher's use
- (optional) digital projector connected to the teacher's computer
- (optional) overhead projector and transparencies of some attachments
- (optional) road map of Washington (or your region of study for this activity)
Who can define "environmental engineering" for me? (Listen to student definitions.) Environmental engineering is applying what you know about chemistry, biology, physics and math to solve real-world problems involving our natural environment. What are some possible problems environmental engineers might solve, or have solved? (Spend some time brainstorming ideas with students.) For example, pollution in a stream: environmental engineers design water purification systems to clean the water and get rid of the pollution. Another example might be air pollution: environmental engineers measure and take steps to control and limit the amount of pollution in the air. When looking at air pollution, environmental engineers must look at three important areas (described below):
Remote sensing of air polllutants is done using a spectroscopic technique. Just as a prism separates light into colors, a spectroscope does so digitally. Each type of molecule uniquely absorbs light at different wavelengths. The concentrations of certain types of molecules in the atmosphere can be determined using the satellite instrument by analyzing the sunlight reflected off the Earth, which has passed through all of the molecules, and comparing it to direct sunlight from the Sun, which has not passed through the atmosphere. Astronomers use similar spectroscopic techniques to determine the composition of stars.
Community chemistry transport models (CCTMs) use weather forecasts and emissions inventories to predict air pollution in a large region. Well-quantified emissions inventories that estimate daily mobile, biogenic, area and point sources enable engineers to model chemistry and transport that takes place in an air shed. Knowing the emission sources, forecasted temperature, precipitation, cloud cover, and solving fundamental equations of physics and chemistry enable accurate predictions to be calculated for a variety of different air pollutants.
Modeling and measuring techniques are important to environmental engineers. By accurately modeling the environment, we can compare to actual measurements and investigate what doesn't agree. This helps us discover new things about the environment. It is important for environmental engineers to measure and model the environment, but it's also important that they work with the government and industry to help avoid unnecessary environmental impacts.
(Proceed to discuss nitrogen dioxide and related content material, as provided in the Teacher's Supplemental Information (PDF), which also contains step-by-step instructions for the Excel portion of the activity.)
The activity can easily be adjusted for any US county in the Washington, Oregon and Idaho area by obtaining the correct county map from the EPA's website at https://www3.epa.gov/air/emissions/where.htm.
Before the Activity
- For Part 1, make copies of the two-page Air Polllution Worksheet (PDF), one per student. Print or copy them on a color printer/copier so the pollution areas show up.
- Become familiar with the color maps of nitrogen dioxide and identify cities where pollution shows up.
- Become familiar with the US EPA-regulated air pollutants contained in the NAAQS (National Ambient Air Quality Standards) and the characteristics of nitrogen dioxide (see the Teacher Supplemental Information (PDF)).
- For Part 2, become familiar with the Excel steps in the Teacher Supplemental Information.
- Make sure each computer has Microsoft Excel installed and working on it.
- Make sure each computer has a copy of the "CREAM-AirPollution.xls" file on it. You may want to edit the original and remove the solution sheet.
- If using a projector, connect it to the teacher's computer and display the starter xls file.
Discussion Preparation
- Be ready to have students identify the different major cities in and around Washington State (or your region of focus for this activity). It can be helpful to use a map showing interstate roads in the region to compare to the color maps; a correlation exists between major freeways and mobile source pollution.
- Be ready to support students in discussing mathematical aspects such as latitude and longitude, units used to quantify air pollution (that is, number of molecules, or tons), and scientific notation.
- When discussing the atmosphere, be prepared for student discussion that may encompass topics such as global warming, ozone layer, atmospheric composition, computers and technology, and sources of air pollution, such as vehicles and power plants. Be prepared to clarify, as necessary, that atmospheric chemistry is driven by the Sun and weather processes, and that many different types of air pollution exist.
With the Students
- Briefly refresh students' memories of units, scientific notation and coordinates. Introduce the characteristics of nitrogen dioxide pollution.
- Part 1: Hand out the worksheets.
- Ask students to list some of the characteristics they know about nitrogen dioxide pollution.
- Using the worksheet, have students quantify the major sources of nitrogen oxides in their county and in the nation. Put the units into perspective via discussion. For example, ask students to discuss the units on the graphs. The worksheet gives units of tons of nitrogen oxides. What is a ton? How many pounds are in a ton? How many nitrogen oxide molecules is that? How much does a molecule weigh?
- Regroup students to identify the cities shown. Use other maps as needed. Have students identify latitude and longitude and have them complete the table of coordinates.
- Regroup students to read values from the color maps on the second page. Ask them to estimate the molecules per square centimeter above Seattle and Portland and help students finish recording estimates for all five cities for both AIRPACT and NASA. Encourage students to use "E+" as a form of scientific notation.
- Have students report what range of values they found on the color maps of nitrogen dioxide. Ask them to check with neighbors to see if they came up with similar numbers.
- Tell students that they will work with Excel on the computers the next day to make plots and finish the worksheet calculations. Make sure they know they are not supposed to calculate differences and ratios by hand. The computer will do the work for them tomorrow, but they will need their worksheets.
- Homework: Assign students to come to class the next day with an idea of which cities the AIRPACT forecast model performs best and worst for. Ask them to think of how they might quantify best and worst.
- Part 2: Recall nitrogen dioxide as an air pollutant and the previous day's activity.
- Have each student sit at a computer. If necessary, organize into pairs or groups to share computers.
- Direct students to open the starter xls file (which opens Microsoft Excel).
- Distribute copies of the Excel Activity Instructions (see attachment).
- Review the steps on the overhead projector for students to follow along.
- Direct students to record their Excel calculations for ratio and difference into their worksheets.
- Using their calculations of difference and ratio, have students determine which cities show the best and worst agreement between the modeled (AIRPACT) and satellite (OMI) concentrations of nitrogen dioxide.
- Have students discuss which cities the AIRPACT performed best and worst, with the idea that as environmental engineers, we want to accurately predict the NOx pollution. By identifying areas on the map where the model and the satellite measurements do not agree, we might be able to find problems in the model and better understand air chemistry in that region. For instance, if we see a bias in Seattle, we might wonder why such a large difference exists. Is it due to a problem with the satellite or the model? How accurate are the measurements? Do we have problems with complex terrain and meteorology in the area? Might the emissions inventory be wrong? Could pollution from Asia that comes across the Pacific Ocean be a factor?
- Ask students to describe how ratio and difference is a measurement of performance.
- Collect completed worksheets and diagrams.
- Close Excel and shut down the computers.
- spectroscopy
- The study of the interaction between light and molecules as a function of wavelength (λ).
- numerical model
- A computer program, or network of computers, that attempts to simulate an abstract model of a particular system.
- nitrogen dioxide
- The chemical compound with the formula NO2, largely emitted from mobile sources.
- mobile source emission
- A wide variety of vehicle, engine and equipment that generate air pollution and that move, or can be moved, from place to place.
Pre-Activity Assessment
Ask students what they know about NASA, Earth observing satellites, and weather forecasting.
Activity Embedded Assessment
Expect students to be able to tell you the main source of nitrogen dioxides. The context of the assignment should stress that vehicles are major polluters.
Post-Activity Assessment
What are different ways we can quantify the amount of air pollution in an area (units and techniques)? What are some possible solutions to help solve this problem? What could environmental engineers do?
Contributors
Farren Herron-Thorpe
Supporting Program
CREAM GK-12 Program, Engineering Education Research Center, College of Engineering and Architecture, Washington State University
Acknowledgements
This content was developed by the Culturally Relevant Engineering Application in Mathematics (CREAM) Program in the Engineering Education Research Center, College of Engineering and Architecture at Washington State University under National Science Foundation GK-12 grant no. DGE 0538652. However, these contents do not necessarily represent the policies of the NSF, and you should not assume endorsement by the federal government.
Copyright
2013 by Regents of the University of Colorado; original © 2009 Board of Regents, Washington State University