
What's Up with All This Traffic?
Expanding on the topic of objects in motion covering Newton's laws of motion, acceleration and velocity, which are taught starting in third grade, students are introduced to new concepts of speed, density, level of service (LOS) (quality of roadways), delay and congestion. Every day we are affected by congestion—even if we do not step out of our homes. For example, the price we pay for goods increases due to increases in shipping costs caused by congestion delays. A congestion metric would help us to compare roadways and assess improvement methods. A common metric used to measure congestion is called level of service (LOS).
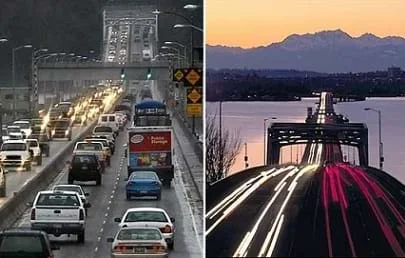 Engineers analyze traffic and congestion to make important decisions on where to spend construction funds.Copyright Washington State Department of Transportation http://www.wsdot.wa.gov/Projects/SR520Bridge/Photos/Daily.htm
It is estimated that traffic congestion caused roughly 700 million person hours of delay per year in the early 1980s, more than 2 billion hours of delay in the 1990s, and nearly 3.5 billion hours of delay by 2000. The costs of congestion from time delay, reduced productivity, lost opportunity and environmental emissions are approaching $100 billion a year. Continuing growth in the nation's population and economic activity ensures that these costs will continue to rise. LOS is used by engineers to determine priorities for allocating funding for roadway improvements to reduce congestion.
After this lesson, students should be able to:
- Explain that speed is a measurement of motion.
- Calculate speed given distance traveled and time.
- Describe the graphical relationship of distance vs. time for constant speed.
- Describe congestion and its levels.
- Identify the impacts of congestion.
- Explain the responsibilities of engineers to reduce congestions and its associated costs.
- CCSS.Math.Content.6.NS.B.2 Fluently divide multi-digit numbers using the standard algorithm.
Grade 6
Do you agree with this alignment? - CCSS.Math.Content.6.NS.B.3 Fluently add, subtract, multiply, and divide multi-digit decimals using the standard algorithm for each operation.
Grade 6
Do you agree with this alignment? - CCSS.Math.Content.6.RP.A.3d Use ratio reasoning to convert measurement units; manipulate and transform units appropriately when multiplying or dividing quantities.
Grade 6
Do you agree with this alignment?
- SC.4.P.12.1 Recognize that an object in motion always changes its position and may change its direction.
Grade 4
Do you agree with this alignment? - SC.4.P.12.2 Investigate and describe that the speed of an object is determined by the distance it travels in a unit of time and that objects can move at different speeds.
Grade 4
Do you agree with this alignment? - SC.6.P.12.1 Measure and graph distance versus time for an object moving at a constant speed. Interpret this relationship.
Grade 6
Do you agree with this alignment?
- Identify trends and monitor potential consequences of technological development.
Grades 6-8
Do you agree with this alignment?
- MS-ESS3-3 Apply scientific principles to design a method for monitoring and minimizing a human impact on the environment.
Grades 6-8
This resource focuses on the following Three Dimensional Learning aspects of NGSS:
Science & Engineering Practices- Apply scientific principles to design an object, tool, process or system.Do you agree with this alignment?
Disciplinary Core Ideas- Human activities have significantly altered the biosphere, sometimes damaging or destroying natural habitats and causing the extinction of other species. But changes to Earth's environments can have different impacts (negative and positive) for different living things.Do you agree with this alignment?
Crosscutting Concepts- The uses of technologies and any limitations on their use are driven by individual or societal needs, desires, and values; by the findings of scientific research; and by differences in such factors as climate, natural resources, and economic conditions. Thus technology use varies from region to region and over time.Do you agree with this alignment?
- Relationships can be classified as causal or correlational, and correlation does not necessarily imply causation.Do you agree with this alignment?
Do you agree with this alignment? - Apply scientific principles to design an object, tool, process or system.
How do we measure congestion? Engineers use a common metric (or measurement tool) called level of service or LOS. LOS is a measure of the effectiveness by which traffic engineers determine the quality of travel on roadways. Roads are assigned letters from A through F, with A being the best and F being the worst. LOS A is when traffic flows at or above the speed limit and occurs late at night in urban areas and frequently in rural areas. LOS F is when traffic is forced to a stop or forced to move extremely slow. Really bad bumper-to-bumper travel is an example of LOS F. Figure 1 shows the progression of congestion from LOS A to F.
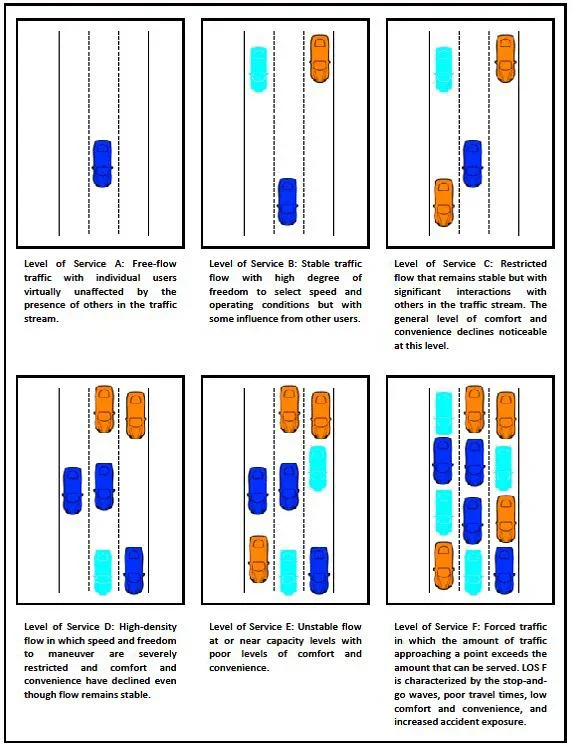 Figure 1. Level of service (LOS) characteristics.Copyright 2010 Jorge Fuentes, STARS, University of South Florida
LOS can be determined in two ways. The first is through the use of densities, the number of vehicles per mile per lane. Essentially, you can take a snapshot of a roadway, measure its length, and count the number of lanes and vehicles it has going in one direction. With those values, density can be calculated and compared to the Figure 2 chart to find the roadway's corresponding LOS. The units of measurement for traffic density are passenger cars per mile per lane (pc/mi/ln). However, who wants to take pictures every hour and count vehicles?
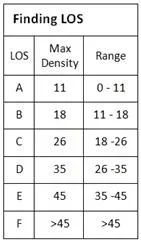 Figure 2. Determining LOS by density levels.Copyright 2010 Jorge Fuentes, STARS, University of South Florida
The second method uses automatic traffic counters, which are those black wires that are stretched across a road. They help to gather data on flow and average vehicle speed along particular roadway sections. Flow is the number of vehicles passing along a point on the road in one hour. Speed is the measurement of how quickly an object moves by measuring the distance the object traveled and dividing it by the amount of time it took the object to travel. If we do not have a traffic counter, we can calculate flow by knowing the average speed of the vehicles and the density of the road. Then, by looking at the Figure 3 graph and using our average speed and flow values, we can determine the LOS level.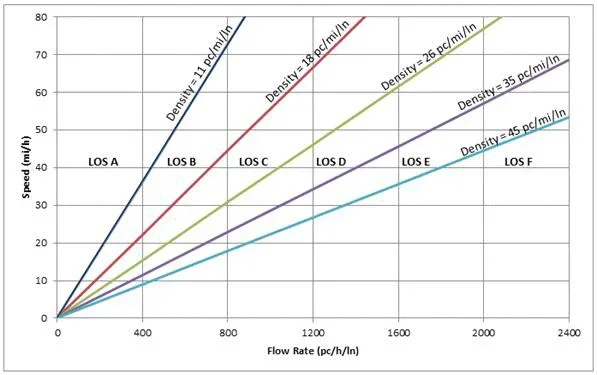 Figure 3. LOS for freeway segments.Copyright 2010 Jorge Fuentes, STARS, University of South Florida
The Figure 3 graph is composed of a horizontal axis showing flow rates and a vertical axis showing speed. The variously colored diagonal lines provide an additional source of information; they are density levels that correspond to flow rates and speeds. They serve to outline areas of LOS levels. For example, if vehicles on a roadway are driving with an average speed of 50 miles per hour (mph) and have a flow rate of 800 passenger cars per hour per lane (pc/h/ln), what LOS would the roadway have? Looking on the graph, the coordinate of (800, 50) falls between density lines 18 and 26 pc/mi/ln, which is in the LOS C area. Therefore, if vehicles are traveling on a roadway with a flow rate of 800 pc/h/ln and average speed of 50 mph, the roadway LOS is C.
Following is the mathematical procedure to derive density using the units of measurement for speed and flow: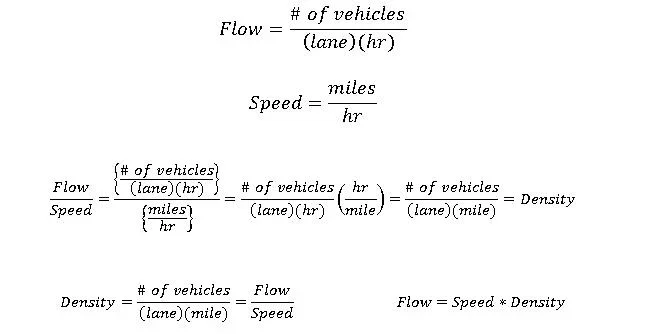
Have you ever noticed times when the roads are filled with cars and other times when the roads are free of vehicles? Has anyone noticed that the more cars on the road, the slower speeds your parents drive or the longer it takes for you to arrive at your destination? Has an accident or a car with a blown tire on the side of the road ever caused your parents to slow down, allowing surrounding cars to get closer? These are all descriptions of congestion, which you may have heard your parents talk about. It is simply roads full of cars, trucks and buses. The more vehicles that are on a roadway the more congested it is, and usually it leads to stopped or stop-and-go movement. Engineers like to describe congestion as an excess of vehicles on a portion of roadway at a particular time resulting in speeds that are slower than normal. Also, one roadway may be congested while another one nearby may not be. The amount, location and time of congestion are always changing.
So, why do you think it is important to understand congestion? Well, who likes to be stuck in traffic when you can be doing something else? We call the time lost by sitting in traffic due to congestion "time delay." It is estimated that traffic congestion caused roughly 700 million person hours of delay per year in the early 1980s, more than 2 billion hours of delay in the 1990s, and nearly 3.5 billion hours of delay by 2000. The costs of congestion—time delay costs, reduced productivity and opportunity, environmental impacts, etc.—are approaching $100 billion a year, and these costs continue to rise. Following the lesson refer to the associated activity Grading Congestion: Modeling and Analyzing Traffic Congestion for students to use basic tools (stopwatches, measuring wheels and calculators) to determine LOS on a modeled track using both flow and density procedures. Every day you are impacted by the effects of congestion even if you do not step out of your home. Increased inventory and shipping costs due to delay caused by congestion are incorporated into the prices of items you buy at the store.
- congestion
- An excess of vehicles on a portion of roadway at a particular time resulting in slower than normal speeds.
- delay
- The time lost by sitting in traffic due to congestion.
- density
- The number of vehicles per mile per lane.
- destination
- The end location of a person's trip.
- flow
- The number of vehicles per hour per lane.
- level of service (los)
- A measure-of-effectiveness by which traffic engineers determine the quality of travel on roadways.
- speed
- The measure of an object's change in position during a unit of time.
- traffic
- The movement of vehicles along a roadway.
Pre-Lesson Questions: Ask students the following questions:
- Have you ever noticed times when there are a lot of cars on the road and other times when there are not so many?
- What are some examples? When have you noticed the roads filled with cars? (Possible examples: Mornings on the way to school, evening "rush hour" around 5 pm, etc.)
- Do you remember a time of day when very few cars were on the road? (Possible examples: Late at night, very early in the morning, on Super Bowl Sunday, etc.)
- When more cars are on the road, what happens to the speed your parents drive? Or to the amount of time it takes to arrive at your destination? (Answers: Parents drive slower; it takes longer to reach the destination.)
- What types of events might cause your parents to slow down while driving, allowing surrounding cars to get closer? (Possible answers: Traffic accidents, a car with mechanical problems on the side of the road, a spill or debris on the roadway, etc.)
During the Lesson Questions: Ask students the following questions:
- Ask students to define the vocabulary words that were introduced, such as destination, speed and level of service. (See the Vocabulary section for definitions.)
- What roadways are filled with lots of cars most of the time? (Possible answers: Boulevards, highways, interstates, freeways.)
- What roadways do not usually have as many cars on them?(Possible answers: Lanes, drives, neighborhood streets.)
- During what times does congestion seem to be the worst? (Answer: 7:30 am–9:30 am and 4:30 am–6:30 am, considered to be "rush hour" periods.)
Summary Questions: Ask students the following questions:
- When density increases, what happens to LOS? (Answer: It decreases.)
- When the roads are filled with cars, does it take them more or less time to get to their destinations? (Answer: More time.)
- What tools are needed to determine speed? (Answer: A stopwatch and a distance measuring device such as a measuring tape or measuring wheel.)
Data Gathering Homework: Assign students to count cars and observe vehicle speeds the next time they ride in cars or buses. Count and record on paper the number of vehicles seen around them that are heading in the same direction and ask the driver the speed s/he is driving. At a later class period, have students share and discuss their findings. (Example answer: 20 cars and 20 mph.)
Winston, Clifford, and Ashley Langer. "The Effect of Government Highway Spending on Road Users' Congestion Costs." Journal of Urban Economics (2006). AEI-Brookings Joint Center. Web. 13 Oct. 2009. http://www.brookings.edu/views/papers/winston/200605-aeijc.pdf
Harrington, Winston, Alan J. Krupnick, and Anna Alberini. "Overcoming Public Aversion to Congestion Pricing." (1998). Resources for the Future. Web. 13 Oct. 2009. http://www.rff.org/rff/Documents/RFF-DP-98-27.pdf
Transportation Research Board. (2000). Highway Capacity Manual 2000. National Research Council, Washington, DC
- What's Up with All This Traffic?
Contributors
Javier Fuentes; Patricio Rocha; Tapas K. Das; Dayna Lee Martinez
Supporting Program
STARS GK-12 Program, College of Engineering, University of South Florida
Acknowledgements
This curriculum was developed by the USF Students, Teachers and Resources in Sciences (STARS) Program under National Science Foundation grant numbers DGE 0139348 and DGE 0638709. However, these contents do not necessarily represent the policies of the NSF, and you should not assume endorsement by the federal government.
Copyright
2013 by Regents of the University of Colorado; original © 2010 College of Engineering, University of South Florida