
A Closer Look at Natural Disasters Using GIS
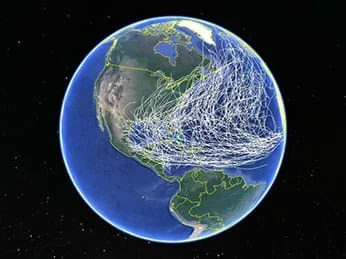 Historical hurricane path data mapped to the globe.Copyright 2018 Kent Kurashima, using Google Earth Pro and historical hurricane data from Google Earth. U.S. Dept. of State Geographer, 2018 Google. 2009 GeoBasis-DE/BKG. Data SIO. NOAA, U.S. Navy, NGA, GEBCO
As if they are environmental engineers, student pairs are challenged to use Google Earth Pro (free) GIS software to view and examine past data on hurricanes and tornados in order to (hypothetically) advise their state government on how to proceed with its next-year budget—to answer the question: should we reduce funding for natural disaster relief? To do this, students learn about maps, geographic information systems (GIS) and the global positioning system (GPS), and how they are used to deepen the way maps are used to examine and analyze data. Then they put their knowledge to work by using the GIS software to explore historical severe storm (tornado, hurricane) data in depth. Student pairs confer with other teams, conduct Internet research on specific storms and conclude by presenting their recommendations to the class. Students gain practice and perspective on making evidence-based decisions. A slide presentation as well as a student worksheet with instructions and questions are provided.
Many types of engineers use GIS to reveal data patterns, process geographic information, and serve as spatial support systems. For example, engineers create, populate and use experiments and models to capture worldwide temperature data for forecasting purposes such as by generating GIS-made world heat maps to show and predict temperature changes at various locations. Engineers who work at the U.S. Environmental Protection Agency use GIS to display data that shows how toxic chemicals travel through air—a data display that aids them in making decisions to keep people safe and to reduce the emission and transport of those chemicals for cleaner air.
After this activity, students should be able to:
- Explain the difference between maps, GPS and GIS.
- Use GIS (Google Earth Pro) to reveal patterns in historical severe storm data and make real-world decisions and recommendations based on those patterns.
- Develop, communicate, and justify an evidence-based scientific explanation regarding natural hazards, and explain their potential local and global impacts
Grades 9-12
Do you agree with this alignment? - Analyze and interpret data about natural hazards using direct and indirect evidence
Grades 9-12
Do you agree with this alignment? - Make predictions and draw conclusions about the impact of natural hazards on human activity – locally and globally
Grades 9-12
Do you agree with this alignment? - Use specific equipment, technology, and resources such as satellite imagery, global positioning systems (GPS), global information systems (GIS), telescopes, video and image libraries, and computers to explore the universe )
Grades 9-12
Do you agree with this alignment? - Develop, communicate, and justify an evidence-based scientific explanation addressing questions about Earth's history
Grades 9-12
Do you agree with this alignment? - Analyze and interpret data regarding Earth's history using direct and indirect evidence
Grades 9-12
Do you agree with this alignment?
- STEL-8N Use various approaches to communicate processes and procedures for using, maintaining, and assessing technological products and systems.
Grades 9-12
Do you agree with this alignment?
- HS-ESS3-1 Construct an explanation based on evidence for how the availability of natural resources, occurrence of natural hazards, and changes in climate have influenced human activity.
Grades 9-12
This resource focuses on the following Three Dimensional Learning aspects of NGSS:
Science & Engineering Practices- Construct an explanation based on valid and reliable evidence obtained from a variety of sources (including students' own investigations, models, theories, simulations, peer review) and the assumption that theories and laws that describe the natural world operate today as they did in the past and will continue to do so in the future.Do you agree with this alignment?
Disciplinary Core Ideas- Resource availability has guided the development of human society.Do you agree with this alignment?
- Natural hazards and other geologic events have shaped the course of human history; [they] have significantly altered the sizes of human populations and have driven human migrations.Do you agree with this alignment?
Crosscutting Concepts- Empirical evidence is required to differentiate between cause and correlation and make claims about specific causes and effects.Do you agree with this alignment?
- Modern civilization depends on major technological systems.Do you agree with this alignment?
Do you agree with this alignment? - Construct an explanation based on valid and reliable evidence obtained from a variety of sources (including students' own investigations, models, theories, simulations, peer review) and the assumption that theories and laws that describe the natural world operate today as they did in the past and will continue to do so in the future.
Each group needs:
- computer with Internet access
- Google Earth Pro, a free geospatial software application that displays a virtual globe and provides the capability to analyze and capture geographic data; download at https://www.google.com/earth/download/gep/agree.html
- Hurricane and Tornado Files (ZIP), a zip file containing 30 files in cpg, dbf, kst, prj, sbn, sbx, shp, and shx format to upload into Google Earth Pro; contains 2000-2013 hurricane and tornado location and timing data from https://www.ncdc.noaa.gov/ibtracs/index.php?name=ibtracs-data and https://www.spc.noaa.gov/gis/svrgis/; note that the shp files are the only files students interact with; the other files are processed behind the scenes by Google Earth Pro
- GIS Student Walk-Through Worksheet (PDF)
To share with the entire class:
- capability to show the class the GIS Presentation (PPTX), a PowerPoint® file
- graph paper or lined paper
Review the Gathering Global Data: Mind Bending GPS Occultations lesson for GPS background information.
Do you or someone you know read or watch the news constantly? Does anyone in your family tune into the news specifically to watch the weather report? Catching the weather forecast reveals to us if we need to pack an umbrella for tomorrow’s rain or wake up a little early to clear snow off the car. Sometimes the report informs us of more devastating weather such as heat waves or developing hurricanes. Sometimes you may not even need to listen to what the meteorologist says about the weather, but just look at the images shown. A lot of meteorological information is effectively conveyed with simple maps or graphic images, for example, look at this map that shows the amount of U.S. snowfall (show students slide 1; also Figure 1).
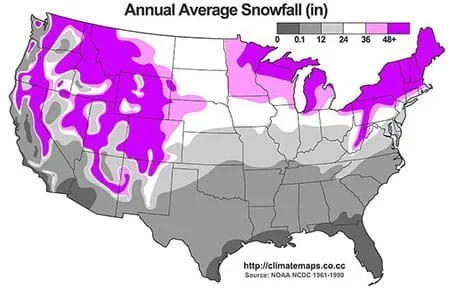 Figure 1. Average annual snowfall in the U.S., 1961-1990, in inches.Copyright 2011 Alex Matus, Wikimedia Commons CC BY-SA 3.0 http://climatemaps.co.cc https://commons.wikimedia.org/wiki/File:United_states_average_annual_snowfall.jpg
But how are those simple—and extremely informative—maps/images created? (Listen to student answers. Expect some students to say that putting forecasted data on a map creates the images, which is a correct answer.)
Displaying data related to locations on the Earth’s surface is called geographic information system—abbreviated as GIS. Can you think of any specific examples of GIS, maybe from weather reports or other aspects of science? (Possible student answers: Maps that show temperatures, hurricane forecast paths, illness outbreak locations, and Starbucks locations.) What types of people might use GIS? (Possible answers: Meteorologists, scientists, engineers, botanists, chemists, zoologists, researchers and medical doctors.)
The abbreviation GIS sounds similar to another system used by researchers—GPS—which stands for global positioning system. How does GIS differ from GPS? (Oversee a short discussion. The answer is that GPS uses satellites to send information to GPS receivers to determine location, while GIS displays data related to positions on Earth. If students do not provide the correct answer, move forward with the slide presentation and activity. Reveal and clarify the answer during the slide presentation.)
(First, set the stage for the upcoming activity.) Now that we have covered some background, here is your engineering challenge: Our state government is proposing a budget to address numerous issues around the state. However, compromises must be made in order to fund the most important issues. You are a team of environmental engineers working for the state and you notice that the proposed budget reduces the disaster relief fund with the explanation that the number and impact of hurricanes/tornados has greatly decreased over the years so disaster relief is not necessary. Skeptical of that assertion, you decide to use your GIS knowledge to examine the historical data on hurricanes/tornados in your area so that you can advise the state on how to proceed with the budget.
(Now that students have the upcoming challenge/task in mind, continue with the slide presentation to provide them with a background about maps, GPS and GIS.)
Background
The global positioning system (GPS) is a satellite-based radio navigation system owned by the U.S. government and operated by the U.S. Air Force. The system is composed of 32 satellites that continuously orbit the Earth, broadcasting signals about their current time and position. GPS receivers use the signal data from multiple satellites to calculate the exact receiver position (to tell you where you are!). The location is calculated by measuring the distance to the satellites based on the time it takes for the device to receive the signals.
A geographic information system (GIS) is a software system that organizes and presents spatial or geographic data in all sorts of ways, enabling visualization, manipulation, analysis and management of the data. Countless GIS application tools enable users to examine and geographically represent location-based data for many different purposes.
Before the Activity
- Pre-load students’ computers with the Google Earth Pro, a free geospatial software application.
- To keep the activity within 120 minutes, pre-load students’ computers with the data provided in the Hurricane and Tornado Files (ZIP) zip file. Further instructions are provided in the worksheet (PDF).
- Make copies of the six-page GIS Student Walk-Through Worksheet (PDF).
- On Day 1, have the 15-slide GIS Presentation (PPTX) ready to show the class. The PowerPoint® file is animated, so a mouse or keyboard click brings up the next text, image or slide.
With the Students
- Conduct the quick pre-activity assessment as described in the Assessment section.
- Introduce the GIS topic to students by presenting the Introduction/Motivation section content and the slide presentation.
- Divide the class into student pairs.
- Give each group a worksheet, which includes instructions and questions for them to provide written answers. Direct the junior engineering teams to work through the worksheet, guided by its detailed procedure.
- Make sure that the programs and data are working for all pairs. As necessary, refer to the Troubleshooting Tips.
- Give teams time to work on the activity and complete the worksheet until 10 minutes remain in the class period. As you walk around, verify that students are not stuck, assist them as needed, and ask them questions to see how they are doing. Suggested prompts:
- What location did you select? Why?
- Have you found any interesting data on your hurricane/tornado?
- Did changing data colors improve your visualization of the data? Or did it help you to reveal anything further in the data?
- Remember that the city you are researching is planning to reduce its disaster relief fund budget. Given your research so far, does that seem like a good idea?
- During the final 10 minutes of class, lead a discussion about what students found while using GIS and completing the worksheet. Ask each team to.
- Report on and discuss your selected location and whether or not it is prone to hurricanes/tornados.
- Describe the specific tornado/hurricane chosen, based on your research for Questions 7 and 12.
- Explain whether or not you recommend that your selected location needs to maintain relief funding for natural disasters.
- Conclude by asking the class the three post-activity reflection questions provided in the Assessment section.
- epidemiology
- The study and analysis of the patterns, causes and effects in defined populations as they pertain to health and disease conditions. See the slide presentation for information about Dr. John Snow and the 1854 London cholera outbreak.
- gis
- Abbreviation for geographic information system. A software system that captures, stores, manipulates, analyzes, manages and presents spatial or geographic data, which is data related to physical locations (usually on the Earth’s surface).
- gps
- Abbreviation for global positioning system. A global navigation satellite system that provides geolocation and time information to GPS receivers. The GPS system provides positioning capabilities to military, civil and commercial users around the world.
Pre-Activity Assessment
Quick Poll: Take a class poll to see who knows and can define GPS, and who knows and can define GIS. To further determine the depth of GIS knowledge, ask students to provide GIS examples.
Activity Embedded Assessment
Worksheet: At computers, using Google Earth Pro, have student pairs complete the GIS Student Walk-Through Worksheet (PDF), including its investigation and analysis questions, which requires some Internet research and conferring with other student pairs. Review their answers to gauge their depth of comprehension.
Post-Activity Assessment
Project Reflection: In discussion format, conclude by asking students the following questions to gauge their overall understanding of the activity subject matter:
- What is the difference between GPS and GIS? (Answer: GPS is a system that uses satellites to broadcast location and time data that can be picked up by GPS receivers to determine receiver location; a GIS is a software system that generates data displays based on GIS location information.)
- Have you ever seen a GIS map before? Did you know what GIS was when looking at the map? What was the GIS map showing you? (Possible student answers: Sickness outbreak maps, weather or temperature maps, wildlife maps, etc.)
- In our hypothetical challenge today, how did the GIS activity enable you to make decisions for the health and safety of people in the path of severe storms? (See what students have to say about this. Possible example answers: Viewing the historical storm data in the Google Earth Pro app revealed the number of hurricanes/tornados that have passed through specific locations, which helped us decide if relief funding might be needed and if the placement of an emergency relief center might be useful for citizens in the area. As if we were engineers, we examined historical storm data as evidence upon which to determine the likelihood of a future need for aid resources.)
If errors are occurring with the programs and/or data:
- Verify that the Google Earth Pro program was downloaded onto the computer.
- Verify that the program is Google Earth Pro and not Google Earth. Sometimes, even if you select download Google Earth Pro, you get Google Earth. Make sure the application says Pro and the icon is a gray globe, NOT a blue one.
- Verify that students are using the intended data (“Hurricanes2000to2013.shp” or “Hurricanes2010to2013.shp” and “Tornado2000to2013.shp” or “Tornado2010to2013.shp”).
Extend this GIS analysis activity by using different datasets, such as the following topics provided by the College of Integrated Science and Engineering, James Madison University in Virginia, at https://www.jmu.edu/cise/index.shtml, which are each focused on a question with pertinent data provided for analysis (and organized by different levels of middle/high school GIS familiarity): disease spread (swine flu, tuberculosis, cholera), piracy attack locations and local economic conditions, demographics for retail store placement, world economies and standards of living, natural disasters and health care facilities, energy production and consumption by country, drinking water source and quality, watershed comparison, carbon footprint by population and country size, bat habitat by location/species, state agriculture productivity and population size, agriculture economies and high-sales farms, and invasive plant and animal species spread.
If students have a hard time understanding the size distortion created by the very common Mercator mapping approach, use Google’s interactive The True Size of… map to drag and drop the shapes of countries around the globe to compare their relative sizes. Surprising!
Geographic information system. Last updated October 13, 2017. Wikipedia, The Free Encyclopedia. Accessed October 17, 2017. https://en.wikipedia.org/w/index.php?title=Geographic_information_system&oldid=805110464
Global positioning system. Last updated October 12, 2017. Wikipedia, The Free Encyclopedia. Accessed October 17, 2017. https://en.wikipedia.org/w/index.php?title=Global_Positioning_System&oldid=805064279
“IBTrACS-WMO Data.” International Best Track Archive for Climate Stewardship (IBTrACS), NOAA’s National Centers for Environmental Information, National Climatic Data Center (NCDC). Accessed February 2018. (source of hurricane data) https://www.ncdc.noaa.gov/ibtracs/index.php?name=ibtracs-data
Severe Weather GIS Page, Storm Prediction Center. Last modified June 13, 2017. NOAA’s National Weather Service. Accessed February 2018. (U.S. severe report database for tornadoes and hail/wind converted into shapefile [.shp] format as well as a GIS database; source of tornado data) http://www.spc.noaa.gov/gis/svrgis/
Contributors
Kent Kurashima
Supporting Program
Integrated Teaching and Learning Program, College of Engineering University of Colorado Boulder
Acknowledgements
The contents of these digital library curricula were developed by the Integrated Teaching and Learning Program under National Science Foundation GK-12 grant no. DGE 0946502. However, these contents do not necessarily represent the policies of the National Science Foundation, and you should not assume endorsement by the federal government.
Copyright
2016 by Regents of the University of Colorado