
Graphing the Rainbow
Students are introduced to different ways of displaying visual spectra, including colored "barcode" spectra, like those produced by a diffraction grating, and line plots displaying intensity versus color, or wavelength. Students learn that a diffraction grating acts like a prism, bending light into its component colors.
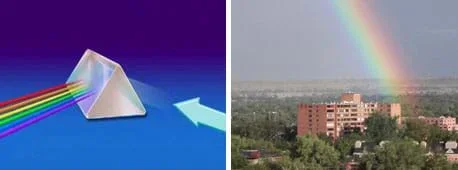 When white light enters a prism, it bends (refracts), and colors are produced. The same thing happens when sunlight hits a water droplet. The colors that result from this bent light form the rainbows that are so familiar to us.Copyright (left) National Aeronautics and Space Administration and (right) 2004 Denise W. Carlson. Used with permission.
Understanding graphs and plots is crucial to engineering, as engineering in all fields is driven by the need to obtain scientific data. Engineering methods are constantly improved and new types of engineering are created based upon the types of data needed to advance science.
After this activity, students should be able to:
- Explain that light from different sources, when passed through a prism or diffraction grating, can be separated into component colors.
- Explain the basic tools engineers use to view spectra.
- Match a "barcode" spectrum with its corresponding line plot.
- Develop and design a scientific investigation regarding absorption, reflection, and refraction of light
Grade 8
Do you agree with this alignment?
- CCSS.Math.Content.8.SP.A.1 Construct and interpret scatter plots for bivariate measurement data to investigate patterns of association between two quantities. Describe patterns such as clustering, outliers, positive or negative association, linear association, and nonlinear association.
Grade 8
Do you agree with this alignment? - CCSS.Math.Content.HSS-ID.B.6 Represent data on two quantitative variables on a scatter plot, and describe how the variables are related.
Grades 9-12
Do you agree with this alignment?
- STEL-1J Develop innovative products and systems that solve problems and extend capabilities based on individual or collective needs and wants.
Grades 6-8
Do you agree with this alignment?
- MS-PS4-2 Develop and use a model to describe that waves are reflected, absorbed, or transmitted through various materials.
Grades 6-8
This resource focuses on the following Three Dimensional Learning aspects of NGSS:
Science & Engineering Practices- Develop and use a model to describe phenomena.Do you agree with this alignment?
Disciplinary Core Ideas- A sound wave needs a medium through which it is transmitted.Do you agree with this alignment?
- When light shines on an object, it is reflected, absorbed, or transmitted through the object, depending on the object's material and the frequency (color) of the light.Do you agree with this alignment?
- The path that light travels can be traced as straight lines, except at surfaces between different transparent materials (e.g., air and water, air and glass) where the light path bends.Do you agree with this alignment?
- A wave model of light is useful for explaining brightness, color, and the frequency-dependent bending of light at a surface between media.Do you agree with this alignment?
- However, because light can travel through space, it cannot be a matter wave, like sound or water waves.Do you agree with this alignment?
Crosscutting Concepts- Structures can be designed to serve particular functions by taking into account properties of different materials, and how materials can be shaped and used.Do you agree with this alignment?
Do you agree with this alignment? - Develop and use a model to describe phenomena.
Each student needs:
- 1 copy of Graphing the Rainbow Worksheet (PDF)
- 1 pencil
Students should be familiar with line graphing methods and understand that graphs can be used to represent physical data. Students should have some understanding of the nature of light, i.e., rainbows are formed with light, light can be different colors, etc.
How is a rainbow formed? It is created by light, and that light comes from the Sun. When the light passes through water droplets in the clouds, we can see the colors that we cannot usually see with our eyes. All light makes a pattern, and today we will be exploring the patterns that are hidden in light that we cannot normally see unless we have special tools to see them. Any light source, whether it is a light bulb, a computer monitor, a star, or a planet — when passed through a prism or a diffraction grating — displays a unique pattern of bright and dark stripes called spectra (the plural of "spectrum").
Prisms and diffraction gratings are tools we can use to see these patterns. Instrumentation developed by engineers can also measure exactly how bright each color is, since this is a difficult thing to do with our eyes. The instrumentation assigns a number value to brightness that can be plotted on a graph in which the x-axis position (horizontal) represents color and the y-axis (vertical) represents brightness, or intensity.
Engineers develop instrumentation based upon the properties of light. Engineers create instrumentation to see spectral patterns of light and study the patterns to improve and develop new instrumentation. They usually use diffraction gratings. They also study the processes and the types of light that create specific spectral patterns. Engineers studying space science are interested in answering questions about the composition of planetary atmospheres, planetary moons, stars and gasses within the solar system and universe.
Background
White light, like that produced by an incandescent light bulb (with electricity passing through it), is composed of all of the colors of light in the rainbow combined. To our eyes, it simply looks white. A diffraction grating (or a prism) acts to break the light into its component colors. Certain colors "bend" more than others through the grating or prism, which is why the colors line up like a rainbow.
Light passing through a cool gas produces what is called an absorption pattern when seen through a diffraction grating or a prism, and dark lines appear in the continuous spectrum. The dark lines are actually created by the gas absorbing the energy of the light. We can identify the gas based on the distinctive pattern of lines that appear in the spectrum. Conversely, an emission spectrum is seen as bright lines against a dark background and is produced by a hot gas emitting photons. Again, the pattern the gas creates is dependent on the type of gas. A particular hot gas shows emission lines in the exact same places that the same cool gas shows absorption lines. The pattern does not change, but whether you see an absorption or emission pattern through the grating does change depending whether the gas is hot or cool. The resulting spectrum has a characteristic pattern of light and dark that, when analyzed, reveals the composition of the light source.
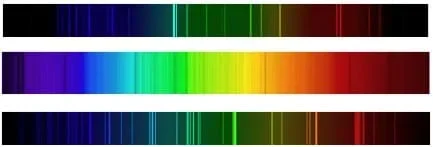 Emission (top and bottom bars) and absorption (middle bar) spectra.Copyright LASP
When light passes through a material (including gases and liquids), many things may happen to it:
Absorption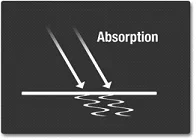 Copyright http://missionscience.nasa.gov/ems/03_behaviors.html
As previously described, the light may be absorbed. This happens when the light photons (or "packages") hit an object, and it's molecules are shaken up by the light. This causes the material to become hotter.
Reflection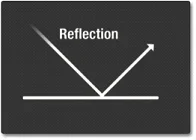 Copyright http://missionscience.nasa.gov/ems/03_behaviors.html
Reflection occurs when light bounces off of a material. The types (wavelengths) of light reflected depend on the composition of the material.
Diffraction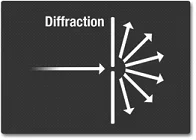 Copyright http://missionscience.nasa.gov/ems/03_behaviors.html
Diffraction occurs when light is bend and spread around an object or a slit.
Scatter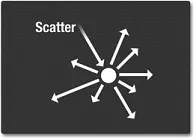 Copyright http://missionscience.nasa.gov/ems/03_behaviors.html
Scattering occurs when light bounces of an object in a variety of direction. The sky is blue due to light scattering. The higher energy (shorter wavelength) light (violet and blue) tends to be scattered by the atmosphere, while the longer wavelength light (yellow and red) does not. Therefore blue and violet and scattered, and the sky appears blue (more blue than violet because human's eyes are more sensitive to blue).
Refraction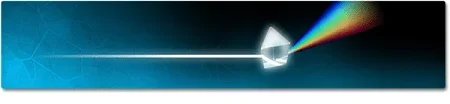 Copyright http://missionscience.nasa.gov/ems/03_behaviors.html
Refraction occurs when light changes direction when passing through an object. The different wavelengths are changed at different rates and allows colors to be separated The previous examples of a glass prism and rain drops are examples of refraction.
Before the Activity
- Complete the "Patterns and Fingerprints" activity.
- Make copies of the Graphing the Rainbow Worksheet (PDF)
- (optional) Make an overhead transparency of page two of the worksheet.
With the Students
- Hand out the worksheets.
- Using the worksheet as a guide, demonstrate how a visible light pattern can be graphically represented in different ways. It may help to show an overhead projection of page two of the worksheet.
- Walk around the room, talking to individual students about the graphs from the worksheet.
- Ask students questions about what they see in the plots and why the pictures correspond to a specific graph on the worksheet.
- spectrum (plural: spectra)
- The pattern light produces when passed through a prism or diffraction grating, as seen through a spectrograph.
- spectrograph
- A device that allows one to see a spectrum; it usually has a prism or diffraction grating inside.
- diffraction
- When light bends around an obstacle or through a small opening like those in a diffraction grating.
- diffraction grating
- Usually a piece of film covered with very thin, parallel grooves.
- continuous spectrum
- The rainbow that white light is composed in which each color is equally bright.
- emission spectrum
- Bright lines that appear through the spectrograph against a dark background.
- absorption spectrum
- Dark lines that appear against the continuous spectrum seen through a spectrograph.
- light source
- Any object that produces light.
Pre-Lesson Assessment
Class Discussion: Ask students what they can tell you about light. Probe them to find out what they already know and understand.
Activity Embedded Assessment
Class Discussion: Ask students why they think light forms rainbows or patterns when passed through a prism or diffraction grating. (Note: The bending of light through a prism does not have to do with varying speeds of the colors! All colors travel at the same speed.)
Worksheet: Have students complete the activity worksheet; review their answers to gauge their mastery of the subject.
Post-Activity Assessment
Think-Pair-Share: Ask students to discuss with a peer what steps engineers take before designing instruments that study light. Randomly select groups to share. Discuss ideas as a class.
Graphing: Graphing and plotting are tools that all engineers use. Graphing and plotting real-world situations allow engineers to analyze whether a tool is working, how to design an effective tool, and whether the tool can be used to create software for looking at data (just like the data in this activity). Ask students to graphically represent a real-world situation, such as driving at a certain speed, coming immediately to a complete stop at some point, and then resuming that same speed. Another example might be a plot representing the descending from the top of a flight of stairs to arrive at some distance at the bottom (a distance vs. time plot). In this instance, have students represent what it would look like if they stopped on a stair for a very long time. This establishes whether they understand how graphing spectra is a representation of a real situation that occurs with light (as opposed to motion, distance or some other variable). It also establishes whether students can apply what they have learned in a different context. Ask students to come up with their own "real-world" graphs, and ask volunteers to explain their graphs to the class.
Colorblind and vision-impaired children will have difficulty with this activity. Students with corrective lenses will not have difficulty. Pair colorblind and blind students with other students to assist them.
Continue the spectroscopy unit by completing the associated, "Using Spectral Data to Explore Saturn and Titan" activities.
Fisher, Diane. "Taking Apart the Light." "The Technology Teacher." March 2002.
Contributors
Laboratory for Atmospheric and Space Physics (University of Colorado at Boulder)
Supporting Program
Laboratory for Atmospheric and Space Physics (LASP), University of Colorado Boulder
Acknowledgements
The contents of this digital library curriculum were developed under a grant from the Fund for the Improvement of Postsecondary Education (FIPSE), U.S. Department of Education, and National Science Foundation GK-12 grant no 0338326. However, these contents do not necessarily represent the policies of the Department of Education or National Science Foundation, and you should not assume endorsement by the federal government.
Copyright
2007 by Regents of the University of Colorado.