
Start Networking!
To get a better understanding of complex networks, students create their own, real social network example by interacting with their peers in the classroom and documenting the interactions. They represent the interaction data as a graph, calculate two mathematical quantities associated with the graph—the degree of each node and the degree distribution of the graph—and analyze how these quantities can be used to infer properties of the social network at hand.
 What can we learn about the characteristics of complex networks by analyzing graphs?Copyright Office of Adolescent Health, US Department of Health and Human Services, Washington State Office of the Insurance Commissioner http://www.hhs.gov/ash/oah/resources-and-publications/learning/coll-tk/index.html#chapter-2/section-2-3/ http://www.insurance.wa.gov/social/index.shtml
We are all members of social networks. Many of us use social networking websites—built by software engineers—to keep in touch and up to date with the people in our social circles. Our money changes hands in exchange for goods and services, creating economic networks studied by financial engineers. Infectious diseases spread via contact networks and are studied by bioengineers and public health researchers. Information flows over our friendship and acquaintance networks, often facilitated by technologies developed by electrical and computer engineers.
After this activity, students should be able to:
- Represent data as a graph.
- Calculate the degree of each node of a graph as well as the degree distribution of a graph.
- CCSS.Math.Content.7.NS.A.3 Solve real-world and mathematical problems involving the four operations with rational numbers.
Grade 7
Do you agree with this alignment? - CCSS.Math.Content.HSS-ID.A.1 Represent data with plots on the real number line (dot plots, histograms, and box plots).
Grades 9-12
Do you agree with this alignment? - CCSS.Math.Content.HSS-MD.B.7 (+) Analyze decisions and strategies using probability concepts (e.g., product testing, medical testing, pulling a hockey goalie at the end of a game).
Grades 9-12
Do you agree with this alignment?
- SC.912.N.4.1 Explain how scientific knowledge and reasoning provide an empirically-based perspective to inform society's decision making.
Grades 9-12
Do you agree with this alignment?
- STEL-2V Analyze the stability of a technological system and how it is influenced by all the components in the system, especially those in the feedback loop.
Grades 9-12
Do you agree with this alignment?
- use representations to model and interpret physical, social, and mathematical phenomena
Grades -1-12
Do you agree with this alignment?
Each student needs:
- sheet of paper
- pen or pencil
Social networks are prolific and important to many branches of modern science and engineering. Money changes hands in exchange for goods and services, creating our economic networks. Infectious diseases spread via contact networks. Information flows over our friendship and acquaintance networks.
Today we are going to build a real social network by collecting data on your interactions in the classroom. Then you'll represent this data as a graph and compute two mathematical quantities associated with the graph so that we can learn how these quantities can be used to infer properties of the social network at hand.
Background
Refer to the Teacher Background section of the associated Sets-Nodes-Edges: Representing Complex Networks in Graph Theory lesson for information on graphs, degree of nodes and degree distribution of graphs.
With the Students
- Ask each student in the class to write his or her name at the top of a sheet of paper.
- Instruct the students to move around the classroom and sign each other's papers if they agree to do so. For example, John and Ann meet and agree to sign each other's sheet of paper. In this case, John's sheet of paper will have his and Ann's name written on it. Likewise, Ann's sheet of paper will have hers and John's name written on it.
- Allow this activity to proceed long enough for students to collect a few signatures (perhaps two to three, on average). Avoid giving too much time because you do not want every student to collect signatures from every other student—a situation that leads to non-interesting results.
- Ask students to return back to their seats and ask one volunteer to collect all sheets of paper.
- Ask one student to make a graph of the interaction data obtained from Step 3 on the classroom board. Represent each student by a node (labeled with his/her name or initials). Draw an edge between two nodes if the students represented by those nodes have exchanged signatures (see Figure 1 for an example). It is easiest to draw the graph if the nodes are placed on a large circle around the border of the board.
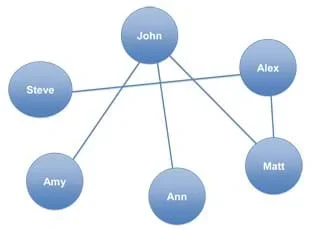 Figure 1. Example graph of interaction data.Copyright 2012 Garrett Jenkinson, Johns Hopkins University
The Figure 1 graph is an example of an outcome that might be drawn on the board. In this example, six students are in the class: Ann, Matt, Alex, John, Steve and Amy. An edge is drawn between students who exchanged signatures. For example, John and Ann exchanged signatures, whereas Steve and Amy did not.
- Ask another student to calculate the degree of each node and the degree distribution of the resulting graph. The degree of a node is given by counting the number of edges connected to the node. Using Figure 1 example data, the results are shown in Table 1 (left). The degree distribution can be found by calculating how many nodes have a given degree and by dividing these numbers by the total number of nodes in the network. Using Figure 1 example data, the results are shown in Table 1 (right). This data can also be plotted, resulting in the Figure 2 bar graph.
- Conclude with a class discussion to analyze the graph. See the questions in the Assessment section.
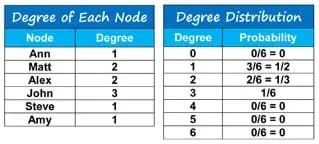 Table 1. Example calculated degree of each node and degree distribution.Copyright 2012 Garrett Jenkinson, Johns Hopkins University
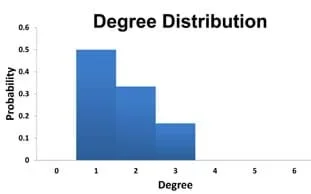 Figure 2. Example plotting of degree distribution data.Copyright 2012 Garrett Jenkinson, Johns Hopkins University
- complex network
- A set of individuals (students, neurons, molecules, computers, web pages) that interact with each other in a certain fashion.
- degree distribution
- A function telling what fraction of the nodes in a graph has a given degree.
- degree of a node
- The number of edges connecting to the node.
- graph
- A set of vertices and a set of edges that connect the vertices. Graphs are used as visual representations of complex networks.
Pre-Activity Assessment
Opening Questions: Before starting the activity, ask students a few questions to review what they have learned in the associated Sets-Nodes-Edges: Representing Complex Networks in Graph Theory lesson.
- What is a social network?
- What is a graph?
- Can you come up with examples of systems that can be represented as graphs?
- What is the degree of a node?
- What is the degree distribution of a graph?
Activity Embedded Assessment
Engagement: While students are networking, monitor them and observe who is participating.
Post-Activity Assessment
Concluding Discussion: After the activity is complete, gauge student comprehension by asking them the following analysis questions about the class social network and discussing as a class:
- Which fellow students are the most and least successful in collecting signatures? What are the degrees of the nodes associated with these two students? (Answer: Looking at the graph, student nodes with the most signatures are the ones with the most edges from them and thus the highest degree numbers. Student nodes with the fewest signatures have the fewest edges and the lowest degree numbers. High degree nodes represent "hubs'' that control many properties of the network as a whole and are important points of study by network scientists and engineers.)
- What does the calculated degree distribution indicate about the resulting social network? (Answer: The most likely number of signatures collected by an individual is given by the mode of the distribution; that is, by the degree with the highest probability. If the distribution is narrow around the mode, then the students are more or less equally successful in collecting signatures. A wide distribution indicates that some students are not as successful as other students in collecting signatures.)
- What happens to the graph if one student decides not to participate in the activity of collecting signatures from his/her classmates? What is the degree of the node associated with this student? (Answer: The node assigned to this student will have no edges and will not be connected to other nodes in the network. Its degree will be zero.)
- What happens to the graph and its degree distribution if enough time is allowed so that each student can collect signatures from all other fellow students? (Answer: If every student obtains signatures from every other student, then all nodes in the network would have edges to all other nodes. In this case, the degree distribution would take only one non-zero value, assigned to the degree that equals the total number of nodes in the network. This value is one.)
Contributors
Garrett Jenkinson; John Goutsias; Debbie Jenkinson; Susan Frennesson
Supporting Program
Complex Systems Science Laboratory, Whitaker Biomedical Engineering Institute, The Johns Hopkins University
Acknowledgements
The generous support of the National Science Foundation, Directorate for Computer and Information Science and Engineering (CISE), Division of Computing and Communication Foundations (CCF), is gratefully acknowledged.
Copyright
2013 by Regents of the University of Colorado; original © 2012 The Johns Hopkins University