
Exploration of ECG and EMG Technologies
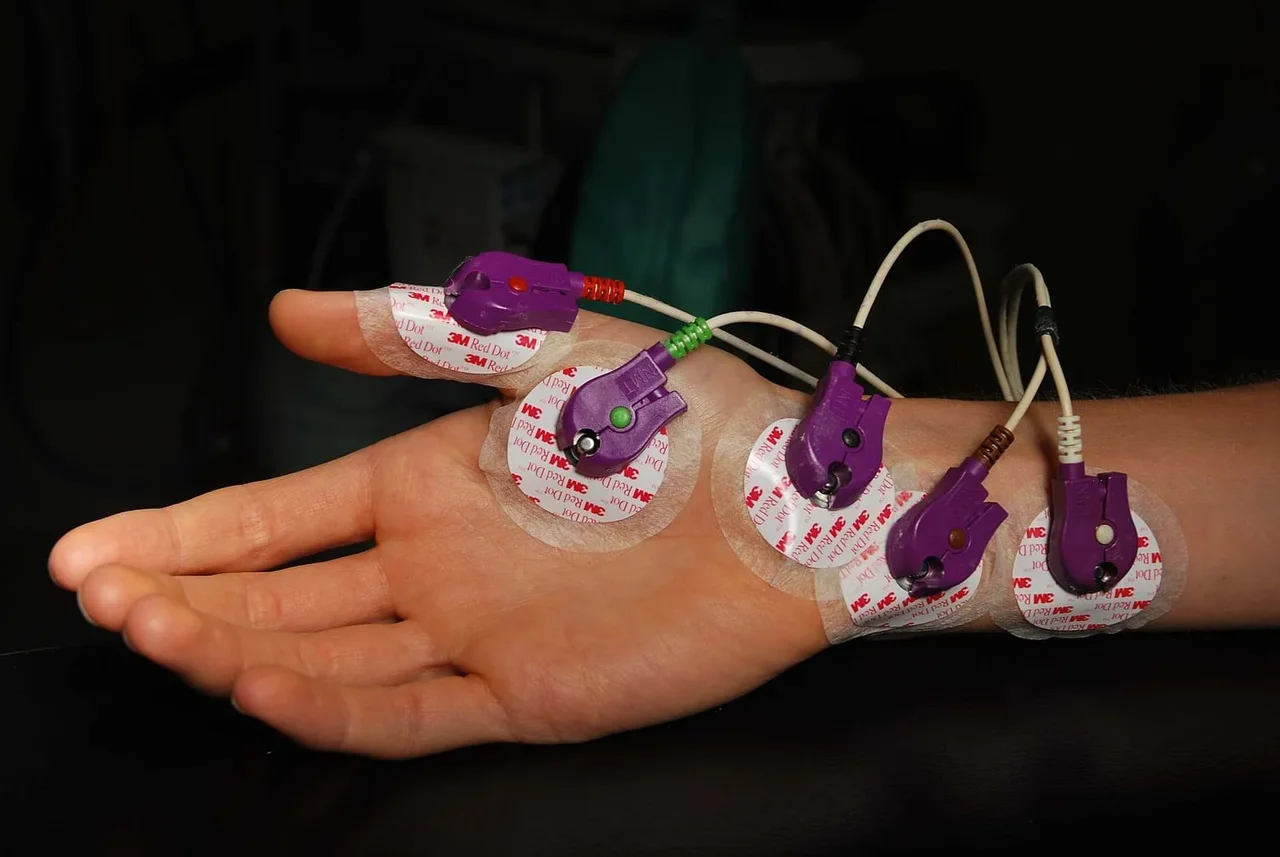 Sensors helps track ECG and EMG readings, but we can use code to help interpret or design ways to better understand how these readings tell us about a person’s health.Copyright 2019 Erin Shappell, University of Missouri RET
Students learn about electrocardiography (ECG) and electromyography (EMG) and apply this knowledge to an engineering design activity. First, they briefly compare the heart to a common electronic device, such as a computer or smartphone, to understand how the heart uses electricity to pump blood through the body just as computers and smartphones use electricity to open apps, update the screen, etc. Students then use a Jupyter Notebook, an interactive tool containing pre-written Python code, to analyze and plot real EMG and ECG data. They are asked to adjust plots, make observations, and sketch snippets of the data they viewed.
Students also learn about how ECG and EMG measurement capabilities have been integrated into wearables such as smart watches so that users can track their own heart and muscle health daily. In the associated activity, students draw inspiration from smart devices and use the engineering design process to design their own wearable device to track the heart or muscle health of a patient.
Analyzing data and connecting the math and science concepts from this analysis to a real-world design problem is critical to engineering. This lesson introduces students to electrocardiogram (ECG) and electromyography (EMG) data and applies it to problems of identifying and monitoring various heart and neuromuscular disorders. Students are introduced to engineering and design firsthand when they complete the design activity where they use the engineering design process to propose a design for their own ECG or EMG device for identifying or monitoring a disorder/disease of their choice. Designing a device like this is often the job of biomedical engineers.
After this activity, students should be able to:
- Analyze EMG data using pre-written Python code.
- Analyze ECG data using pre-written Python code.
- List and explain important uses for the ECG and EMG in healthcare.
- Discuss how and why tracking patients’ ECG and EMG waves is beneficial in healthcare.
- List some heart and neuromuscular disorders/diseases that may be diagnosed with the help of ECG or EMG analysis.
- Apply the engineering design process and what they know about ECG and EMG to propose a portable healthcare device that uses neural wave analysis.
- SEP.1.6-8.1 Analyze and interpret data to determine similarities and differences in findings.
Grades 6-8
Do you agree with this alignment? - CCC.8.9-12.15 Engineers continuously modify these technological systems by applying scientific knowledge and engineering design practices to increase benefits while decreasing costs and risks.
Grades 9-12
Do you agree with this alignment? - SEP.1.9-12.3 Analyze data using computational models in order to make valid and reliable scientific claims.
Grades 9-12
Do you agree with this alignment? - SEP.1.6-8.3 Analyze and interpret data to provide evidence for phenomena.
Grades 6-8
Do you agree with this alignment?
Each group needs:
- laptop/tablet per group member
- Google account per group member
- All three activity worksheets per group member (1 per day): What is an ECG? Jupyter Notebook Activity (PDF), What is an EMG? Jupyter Notebook Activity (PDF), and Applications of ECG and EMG Design Activity (PDF)
- What is an ECG? Presentation (pptx)
- What is an ECG? Presentation (pdf)
- What is an ECG? Jupyter Notebook Activity (docx)
- What is an ECG? Jupyter Notebook Activity (pdf)
- What is an ECG? Jupyter Notebook Activity Answer Key (docx)
- What is an ECG? Jupyter Notebook Activity Answer Key (pdf)
- What is an ECG? Activity Pre-Quiz (docx)
- What is an ECG? Activity Pre-Quiz (pdf)
- What is an ECG? Activity Pre-Quiz Answer Key (docx)
- What is an ECG? Activity Pre-Quiz Answer Key (pdf)
- What is an ECG? Activity Post-Quiz (docx)
- What is an ECG? Activity Post-Quiz (pdf)
- What is an ECG? Activity Post-Quiz Answer Key (docx)
- What is an ECG? Activity Post-Quiz Answer Key (pdf)
- Jupyter Notebook Guide (pdf)
- WhatIsAnECG_NOTEBOOK (ipynb)
- ECG_Example1 (csv)
- ECG_Example2 (csv)
- What is an EMG? Presentation (pptx)
- What is an EMG? Presentation (pdf)
- What is an EMG? Jupyter Notebook Activity (docx)
- What is an EMG? Jupyter Notebook Activity (pdf)
- What is an EMG? Jupyter Notebook Activity Answer Key (docx)
- What is an EMG? Jupyter Notebook Activity Answer Key (pdf)
- What is an EMG? Activity Pre-Quiz (docx)
- What is an EMG? Activity Pre-Quiz (pdf)
- What is an EMG? Activity Pre-Quiz Answer Key (docx)
- What is an EMG? Activity Pre-Quiz Answer Key (pdf)
- What is an EMG? Activity Post-Quiz (docx)
- What is an EMG? Activity Post-Quiz (pdf)
- What is an EMG? Activity Post-Quiz Answer Key (docx)
- What is an EMG? Activity Post-Quiz Answer Key (pdf)
- WhatIsAnEMG_NOTEBOOK (ipynb)
- EMG_Example1 (csv)
- EMG_Example2 (csv)
- Applications of ECG and EMG Presentation (pptx)
- Applications of ECG and EMG Presentation (pdf)
- Applications of ECG and EMG Activity (docx)
- Applications of ECG and EMG Activity (pdf)
- Applications of ECG and EMG Pre-Quiz (docx)
- Applications of ECG and EMG Pre-Quiz (pdf)
- Applications of ECG and EMG Pre-Quiz Answer Key (docx)
- Applications of ECG and EMG Pre-Quiz Answer Key (pdf)
- Applications of ECG and EMG Post-Quiz (docx)
- Applications of ECG and EMG Post-Quiz (pdf)
- Applications of ECG and EMG Post-Quiz Answer Key (docx)
- Applications of ECG and EMG Post-Quiz Answer Key (pdf)
- Applications of ECG and EMG Rubric (docx)
- Applications of ECG and EMG Rubric (pdf)
A familiarity with basic wave analysis (i.e., understand frequency, amplitude, and period of a wave).
Have you ever wondered how your heart works and how you are able to move your muscles? How is your heart able to never stop pumping blood through your body? What about how your arms and legs move? The heart and nervous systems run on electricity, like how your computer and your smart phone do. The electrical activity of the heart can be measured and monitored by creating an electrocardiogram (ECG), which contains data on the heart’s voltage. Similarly, the electrical activity in the nervous system can be measured using electromyography (EMG). ECG and EMG data can be examined by doctors and researchers to determine if the patient has an abnormality or disease.
In this activity, you will learn how to analyze both ECG waves and EMGs. You will use Python code and Jupyter notebook to analyze EMG and ECG data. Then you will learn how this EMG and ECG data are used in healthcare and some specific disorders/diseases they are used to diagnose and monitor. Then, we will complete a design activity that will walk us through the engineering design process and lead us through creating our own designs of wearable devices that use ECG or EMG to diagnose or monitor potential disease.
Background
Electrocardiogram (ECG) data is characterized by an easily recognizable waveform: a larger peak, called the QRS complex, which is preceded and followed by two smaller peaks called the P and T waves, respectfully. Real, raw ECG data may not show these waveforms perfectly, but the QRS complex (or large peak) should be recognizable.
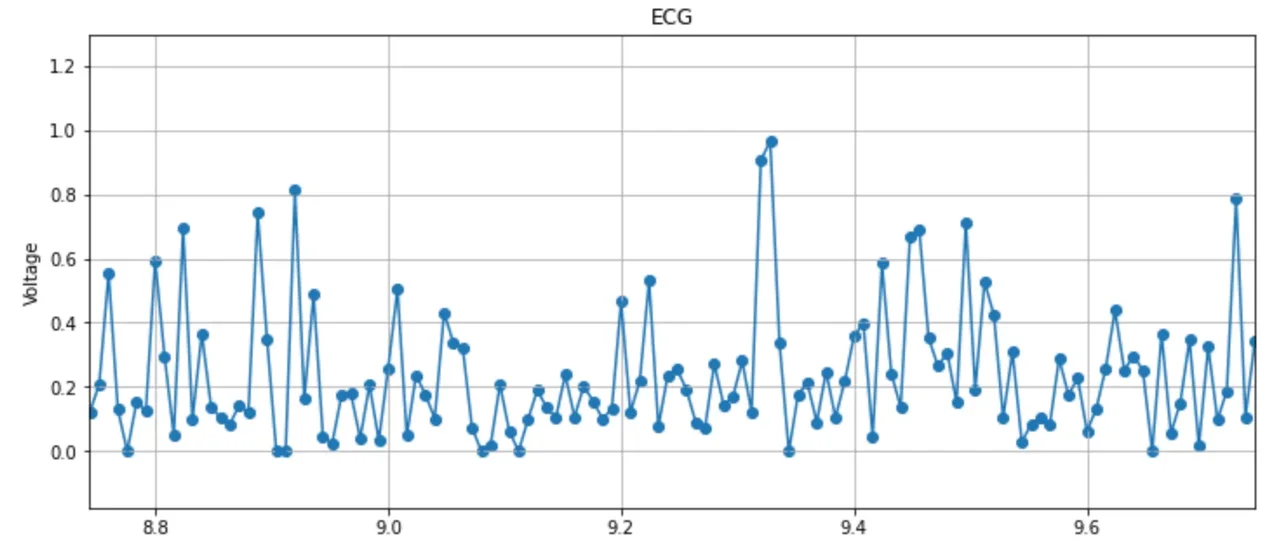 Figure 1: A graph of an ECG reading.Copyright 2019 Erin Shappell, University of Missouri RET
Electromyogram (EMG) data is characterized by spikes that correspond to the subject muscle’s movements and level of movement. Larger, more frequent spikes suggest that the muscle is being used for strong activity, such as lifting a heavy weight. Small, less frequent spikes suggest that the muscle is being used for lighter activity, such as bending the elbow.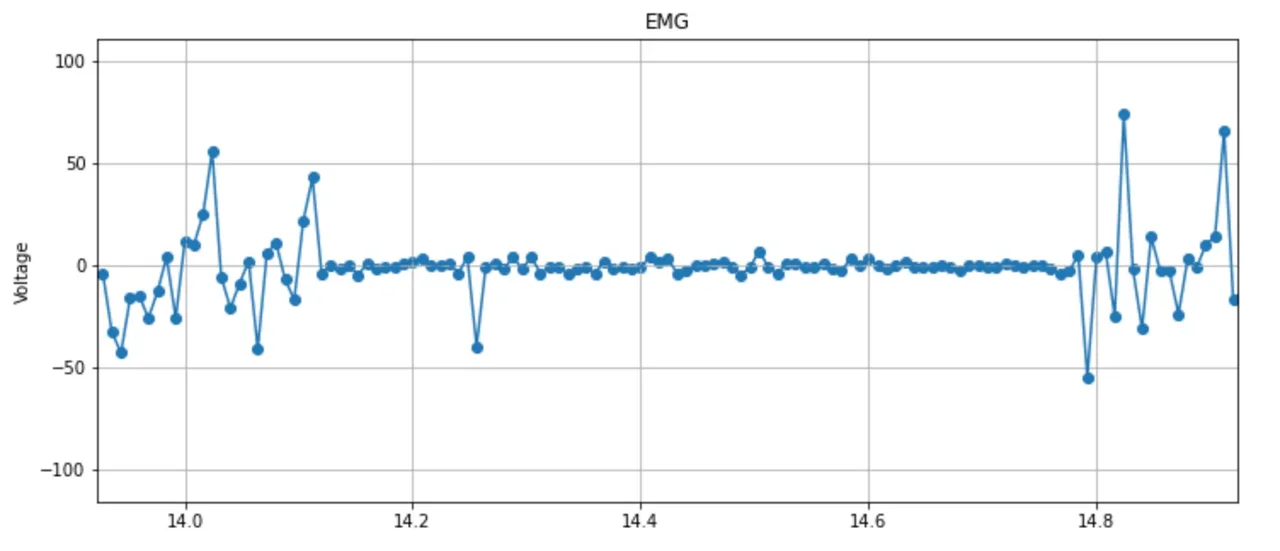 Figure 2: A graph of an EMG reading.Copyright 2019 Erin Shappell, University of Missouri RET
Before the Activity
- Review the Jupyter Notebook Guide (PDF) and complete the tutorials referenced in the guide.
- Make copies of the activity sheets What is an ECG? Jupyter Notebook Activity (PDF), What is an EMG? Jupyter Notebook Activity (PDF), and Applications of ECG and EMG Design Activity (PDF).
- Review the engineering design process with students.
With the Students
Day 1
- Divide class into groups of 2 – 4 students, although students may work on this activity individually.
- Present the What is an ECG? Presentation (PPTX) to introduce students to heart functions and ECG waveforms.
- Hand out a copy of the activity sheet, What is an ECG? Jupyter Notebook Activity (PDF), to each student. Each student should turn in their own copy, even if they are in groups. Ensure that students have access to the csv files: ECG_Example1 (CSV) and ECG_Example2 (CSV).
- Demonstrate how to open and run a Jupyter Notebook as shown in the Jupyter Notebook Guide (PDF).
- Encourage students in groups to help each other if they get stuck. If students are working individually, they may ask their neighbors for help.
Day 2
- Separate the class into the same groups as Day 1.
- Present the What is an EMG? Presentation (PPTX) to introduce students to EMG waveforms and motor neurons.
- Hand out a copy of the activity sheet, What is an EMG? Jupyter Notebook Activity (PDF), to each student. Each student should turn in their own copy, even if they are in groups. Ensure that students have access to the csv files: EMG_Example1 (CSV)and EMG_Example2 (CSV).
- Encourage students in groups to help each other if they get stuck. If students are working individually, they may ask their neighbors for help.
Day 3
- Hand out a copy of the Applications of ECG and EMG Design Activity (PDF) to each group. Each group should turn one design.
- Present the Applications of ECG and EMG Presentation (PPTX) to explore how doctors use ECG and EMG data to detect and mitigate health problems.
- Students may use Google (or another search engine) for inspiration and ideas, but they may NOT copy an existing idea (for example, students cannot design a smart watch).
- Encourage each student to research independently and then share with the group, each group will then design one wearable device.
- electrocardiogram (ecg)
- A graph of voltage versus time of the electrical activity of the heart using electrodes placed on the skin.
- electromyography (emg)
- A technique for evaluating and recording the activation signal of muscles.
- heart
- A muscular organ that pumps blood through the body, traditionally thought to be the seat of emotion.
- heart arrhythmia
- An irregular heartbeat.
- muscle
- A contractile form of tissue which animals use to effect movement.
- muscular dystrophy
- A group of genetic diseases which cause progressive skeletal muscle weakness, defects in muscle proteins, and the death of muscle cells and tissue.
Pre-Activity Assessment
Day 1:
Pre-Quiz: Conduct the What is an ECG? Activity Pre-Quiz (PDF).
Day 2:
Pre-Quiz: Conduct the What is an EMG? Activity Pre-Quiz (PDF).
Day 3:
Pre-Quiz: Conduct the Applications of ECG and EMG Activity Pre-Quiz (PDF).
Activity Embedded (Formative) Assessment
Day 1:
ECG Activity: Students complete the What is an ECG? Jupyter Notebook Activity (PDF).
Day 2:
EMG Activity: Students complete the What is an EMG? Jupyter Notebook Activity (PDF).
Day 3:
Applications of ECG and EMG: Students complete the Applications of ECG and EMG Design Activity (PDF).
Post-Activity (Summative) Assessment
Day 1:
Post-Quiz: Conduct the What is an ECG? Activity Post-Quiz (PDF).
Day 2:
Post-Quiz: Conduct the What is an EMG? Activity Post-Quiz (PDF).
Day 3:
Post-Quiz: Conduct the Applications of ECG and EMG Activity Post-Quiz (PDF).
After students complete their designs, have some students volunteer to share their designs. Have the volunteers take turns sharing their sketches and their design considerations (where is their device worn on the body, what disorder/disease is it diagnosing/monitoring, etc.)
Optional: Teach Engineering has a great unit on Creative Engineering Design that could extend on students’ exposure to the engineering design process in this activity.
Students should have individual access to Google (or other search engine) for researching information for the design activity. Students should also have access to Google Colab and Jupyter Notebook (Available online through Google Drive).
Contributors
Erin Shappell; Dr. Satish Nair; Keegan Welch; Isabel Banks; Nathan Opsal; Adam Menker
Supporting Program
Research Experiences for Teachers in Neural Engineering, University of Missouri
Acknowledgements
This work is based upon work supported in part by the National Science Foundation under grant no. EEC-1801666—Research Experiences for Teachers in Neural Engineering at the University of Missouri. Any opinions, findings and conclusions or recommendations expressed in this material are those of the authors and do not necessarily reflect the views of the National Science Foundation.
Copyright
2023 by Regents of the University of Colorado; original © 2019 University of Missouri