
Gaitway to Acceleration: Walking Your Way to Acceleration
Legacy Curriculum
Hey there! This curriculum is no longer being curated or supported. It may contain materials that are no longer available or outdated information. Please use this document for reference.
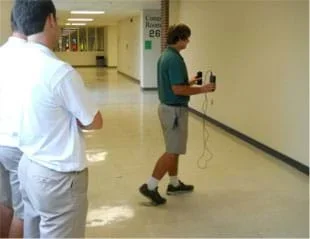 Collecting gait data.Copyright 2014 Jeremy Scheffler, University of Nebraska Omaha
Student teams use sensors—motion detectors and accelerometers—to collect walking gait data from group members. They import their collected position and acceleration data into Excel® for graphing and analysis to discover the relationships between position, velocity and acceleration in the walking gaits. Then they apply their understanding of slopes of secant lines and Riemann sums to generate and graph additional data. These activities provide practice in the data collection and analysis of systems, similar to the work of real-world engineers.
Engineers analyze systems that they want to maintain or change. For instance, an environmental engineer might wonder why a natural system is becoming unstable. A software engineer might analyze how a particular software application behaves when it is given unorthodox input. A mechanical engineer might analyze why a system has an unexpected energy loss. Through the engineering design process, engineers collect data about systems and analyze that data. This activity provides a hands-on laboratory experience in which students collect data and then analyze it to determine relationships between the data variables.
After this activity, students should be able to:
- Collect data and analyze it to determine relationships between the variables.
- Explain the relationships between position, velocity and acceleration.
- Given a velocity vs. time graph, produce corresponding position and acceleration graphs.
- Given an acceleration vs. time graph, produce corresponding velocity and position graphs.
- CCSS.Math.Content.HSN-VM.A.3 (+) Solve problems involving velocity and other quantities that can be represented by vectors.
Grades 9-12
Do you agree with this alignment? - CCSS.Math.Content.HSS-ID.A Summarize, represent, and interpret data on a single count or measurement variable
Grades 9-12
Do you agree with this alignment? - CCSS.Math.Content.HSS-ID.A.1 Represent data with plots on the real number line (dot plots, histograms, and box plots).
Grades 9-12
Do you agree with this alignment?
- CCSS.Math.Content.HSN-VM.A.3 (+) Solve problems involving velocity and other quantities that can be represented by vectors.
Grades 9-12
Do you agree with this alignment? - CCSS.Math.Content.HSS-ID.A Summarize, represent, and interpret data on a single count or measurement variable
Grades 9-12
Do you agree with this alignment? - CCSS.Math.Content.HSS-ID.A.1 Represent data with plots on the real number line (dot plots, histograms, and box plots).
Grades 9-12
Do you agree with this alignment?
- Technological problems must be researched before they can be solved.
Grades 9-12
Do you agree with this alignment? - STEL-8Q Synthesize data and analyze trends to make decisions about technological products, systems, or processes.
Grades 9-12
Do you agree with this alignment?
- Process data and report results.
Grades K-12
Do you agree with this alignment?
- Use multiple processes and diverse perspectives to explore alternative solutions.
Grades K-12
Do you agree with this alignment? - Operate Systems - Understand technology systems and use hardware and networks to support learning.
Grades K-12
Do you agree with this alignment?
Each group needs:
- motion detector (see options, below)
- accelerometer (see options, below)
- belt or strap, to secure the motion detector and accelerometer to a student's body
- computer with Microsoft Excel® (or similar) application; alternatively, have students create programs using Python, Java or other programming languages that perform calculations and create graphs
- "Gaitway" to Acceleration Summative Assessment (PDF), one per person
For motion detectors, the author used Vernier products, but other motion detectors, along with the necessary accompanying graphing calculators or other similar devices, would work as well. Possible motion detectors options include:
- LabQuest 2
- Go!Motion ($109): https://www.vernier.com/products/sensors/motion-detectors/go-mot/
- Calculator-Based Ranger (CBR) 2 ($99): https://www.vernier.com/products/sensors/motion-detectors/cbr2/
- Motion Detector ($79): https://www.vernier.com/products/sensors/motion-detectors/md-btd/
- Texas Instruments CBL
Possible interface options:
- Go!Link ($61): https://www.vernier.com/products/interfaces/go-link/
- LabQuest Mini ($149): https://www.vernier.com/products/interfaces/lq-mini/
- LabQuest 2 ($329): https://www.vernier.com/products/interfaces/labq2/
- CBL 2 (for TE graphing calculators) ($166): https://www.vernier.com/products/interfaces/cbl2/
Possible software options:
- Logger Lite (free download): https://www.vernier.com/products/software/logger-lite/
- Logger Pro ($249): https://www.vernier.com/products/software/lp/
For accelerometers: The LabQuest 2 has an internal accelerometer. Possible other accelerometers include:
- Low-g accelerometer ($89): https://www.vernier.com/products/sensors/accelerometers/lga-bta/
- 3-axis accelerometer ($99): https://www.vernier.com/products/sensors/accelerometers/3d-bta/
- internal accelerometer of a smartphone (or tablet or other device), combined with a downloaded app to access data; many free or low-cost accelerometer apps are available through Google Play for Android devices; for example, the "Physics Toolbox Accelerometer" by Vieyra Software was successfully tested and data was collected and transferred to a computer
- "Gaitway" to Acceleration Activity a-t and v-t Graphs (xlsx)
- "Gaitway" to Acceleration Activity x-t and v-t Graphs (xlsx)
- "Gaitway" to Acceleration Summative Assessment (docx)
- "Gaitway" to Acceleration Summative Assessment (pdf)
- 'Gaitway" to Acceleration Summative Assessment Answer Key (docx)
- "Gaitway" to Acceleration Summative Assessment Answer Key (pdf)
A working knowledge of the terms position, velocity and acceleration, and a fluency in Microsoft Excel® in order to perform the necessary data analysis.
Today's activity is composed of two parts. Collectively, they provide you with data collection and analysis practice—similar to the work of real-world engineers.
In the first part, working in groups, you will use motion detectors and accelerometers to collect data related to your gait, which is how you walk. Engineers often collect data about systems to be able to create models. It is an important skill to learn about what data you need to collect and how to collect that data in order to describe a system.
In the second part of the activity, you will analyze the collected data to determine the relationships between position, velocity and acceleration of your gait. Engineers are constantly analyzing data to see if modifications to processes and systems are having the desired effect. This analysis might occur at several stages of the engineering design process, such as an initial analysis of the problem or in the later testing and/or improvement steps.
Background
Determining how a system works is essential for engineers. This activity provides hands-on practice in data collection and analysis of that data. In this laboratory experience, students apply mathematics and physics to data that they have collected. They explore the relationships between an object's position over time, its velocity and its acceleration. The collection and analysis of data can be important at many stages of the engineering design process.
Part 1 of the procedure can be completed using a Vernier motion detector (or Go!Motion) and LabQuest 2, which has an internal accelerometer, or other alternatives mentioned in the Materials List, such as a sensor/interface/software system that records measurements and creates graphs from the internal accelerometers in smartphones. With a motion detector connected and the internal accelerometer enabled, the LabQuest 2 collects data and generates graphs of position vs. time and acceleration vs. time of students' gaits. Students can either use the graphs displayed by the LabQuest 2 for their analyses or transfer the data to Microsoft Excel® (or similar program) to create the graphs. Part 2 of the procedure can be completed using Excel®, or the alternatives suggested in the Materials List.
Below is an explanation of the data and graphs students generate, provided for the teacher in the attached example student data results files: "Gaitway" to Acceleration Activity x-t and v-t Graphs (XLSX) and "Gaitway" to Acceleration Activity a-t and v-t Graphs (XLSX).
- The position vs. time graph shows a slow initial velocity followed by an increase in speed, then a somewhat constant velocity, and finally a decrease in speed to a slow final velocity. Calculating velocities using slopes results in a velocity vs. time graph with features that match this description of motion.
- The acceleration vs. time graph is much more erratic on a step-by-step basis, and it is not possible to describe the motion without using integration to calculate velocities and produce the corresponding velocity vs. time graph, which generally matches the shape of the other velocity vs. time graph.
Before the Activity
- Gather materials and make copies of "Gaitway" to Acceleration Summative Assessment (PDF), one per person.
- Test the equipment and interfaces to minimize technology glitches during the activity.
- Arrange for student access to computers with Microsoft Excel®.
With the Students—Part 1
- After asking students the warm-up questions (provided in the Assessment section) and presenting the Introduction/Motivation content, divide the class into groups of three or four students each.
- Tell students that they will be using motion detectors and accelerometers to collect data relating to position vs. time and accelerometers vs. time of their walking gaits.
- To begin, have one student in each group serve as a human subject for data collection, correctly positioning the data collection hardware on his/her body. (See Figures 1 and 2). To do this, students first use a belt or strap to attach a motion detector to the front of a group member and an accelerometer to his or her front or back. Position the motion detector so it is directed horizontally toward a wall that is perpendicular to the direction the student will be walking, and orient the accelerometer with its axis horizontal and parallel to the direction the student will be walking.
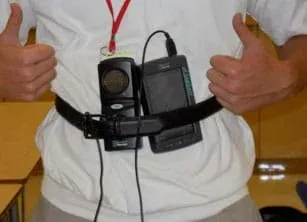 Figure 1. A student wearing the data collection devicesCopyright 2014 Jeremy Scheffler, University of Nebraska Omaha
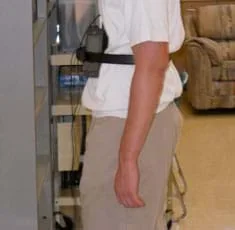 Figure 2. Showing the direction of walk.Copyright 2014 Jeremy Scheffler, University of Nebraska Omaha
 - Have students collect position vs. time and acceleration vs. time data from the two sensors simultaneously while their group members walk forward toward a wall. Collect the data with a sample rate of at least 20 Hz, and have the sensors interpret the direction from the human subject toward the wall as the positive direction.
- Have student groups write descriptions of the motion of the human subject group member who walked with the motion detector and accelerometer. (Note: Depending on time constraints, either have all students in the groups perform the walk to collect data or only selected members.)
- After data has been collected, direct students to produce position vs. time graphs for the motion detector data, and acceleration vs. time graphs for the accelerometer data. The easiest way to create the graphs is by using some graphing utility, such as via a computer or graphing calculator.
- Direct the students to examine their graphs to identify features that correspond to the characteristics of the walkers' motions.
- Finally, have each group present its results to the class.
With the Students—Part 2
- Tell students that they will analyze their data and use position data to generate velocity and acceleration data, and use acceleration data to generate velocity and position data.
- To begin, direct students to import their position vs. time data to Excel® and create a graph. Then have them use the slopes of secant lines for small time intervals on the position vs. time graph to calculate approximate values of the instantaneous velocity for each time value and construct a graph of velocity vs. time.
- Next, students use the slopes of secant lines for small time intervals on the velocity vs. time graph to calculate approximate values of the instantaneous acceleration for each time value and construct a graph of acceleration vs. time. At this point, have groups write descriptions of the motion represented by the graphs.
- Next, students import their acceleration vs. time data and construct a graph of acceleration vs. time. Using Riemann sums for small time intervals on the acceleration vs. time graph, students calculate approximate values of the instantaneous velocity for each time value (initial velocity must be given or assumed), and construct a graph of velocity vs. time.
- Next, students use Riemann sums for small time intervals on the velocity vs. time graph to calculate approximate values of the instantaneous position for each time value, (initial position must be given or assumed) and construct a graph of position vs. time.
- Finally, groups write descriptions of the motion represented by the graphs.
- To conclude, have each group compare the two sets of graphs, discuss similarities and differences, and present their results and conclusions to the class.
- acceleration
- The rate of change of an object's velocity.
- gait
- The way a person walks, including size of step, pace, weight distribution, etc.
- position
- An object's location relative to a reference point.
- riemann sum
- The approximation of the area of a region under a curve.
- secant line
- A line that locally intersects two points on the curve. Secant lines can be used to approximate the tangent to a curve by moving the points of intersection of the secant line closer to the point of tangency.
Pre-Activity Assessment: Ask students the following warm-up questions to gauge their prior knowledge:
- What is acceleration? (Answer: Acceleration is the rate of change in [derivative of] velocity with respect to time.)
- As an object moves, how does its velocity change? (Answer: The velocity of an object changes based on how the object's motion changes. If the object's motion changes direction or slows down or speeds up, its velocity changes. If the object's motion remains at a constant speed in the same direction, its velocity is unchanged.)
- As an object moves, how does its acceleration change? (Answer: The acceleration of an object changes based on how the object's motion and velocity changes. If the object's motion changes direction or its velocity increases or decreases, the object's acceleration changes. If the object's velocity remains constant, its acceleration is unchanged.)
Formative Assessment: As students are engaged in the activity ask these (or similar) questions:
- Can you describe the relationships between position, velocity and acceleration graphically using slopes and areas?
- Can you describe the relationships between position, velocity and acceleration mathematically as rates of change?
- Do you understand the difference between average and instantaneous quantities?
- Can you apply secant slopes and Riemann sums to obtain approximate instantaneous values for position, velocity, and acceleration?
Summative Assessment: Assign students to individually complete the "Gaitway" to Acceleration Summative Assessment (PDF). Review their answers to gauge their depth of comprehension.
- Position, Velocity and Acceleration
- Gaitway to Acceleration: Walking Your Way to Acceleration
Contributors
Jeremy Scheffler; Brian Sandall
Supporting Program
IMPART RET Program, College of Information Science & Technology, University of Nebraska Omaha
Acknowledgements
The contents of this digital library curriculum were developed as a part of the RET in Engineering and Computer Science Site on Infusing Mobile Platform Applied Research into Teaching (IMPART) Program at the University of Nebraska Omaha under National Science Foundation RET grant number CNS 1201136. However, these contents do not necessarily represent the policies of the National Science Foundation, and you should not assume endorsement by the federal government.
Copyright
2015 by Regents of the University of Colorado; original © 2014 Board of Regents, University of Nebraska