
Position, Velocity and Acceleration
Legacy Curriculum
Hey there! This curriculum is no longer being curated or supported. It may contain materials that are no longer available or outdated information. Please use this document for reference.
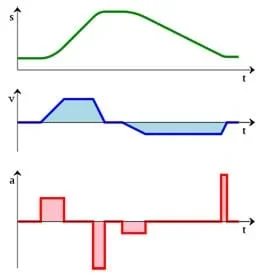 Object motion graphs.Copyright 2007 Pieter Kuiper, Wikimedia Commons http://commons.wikimedia.org/wiki/File:1-D_kinematics.svg
Students observe four different classroom setups with objects in motion (using toy cars, a ball on an incline, and a dynamics cart). At the first observation of each scenario, students sketch predicted position vs. time and velocity vs. time graphs. Then the classroom scenarios are conducted again with a motion detector and accompanying tools to produce position vs. time and velocity vs. time graphs for each scenario. Students compare their predictions with the graphs generated by technology and discuss their findings. This lesson requires assorted classroom supplies, as well as motion detector technology.
Many types of engineers, such as systems engineers, structural engineers and civil engineers, carefully observe and analyze systems to determine what causes them to behave as they do. They examine how systems work and make predictive models of them. In this lesson, students observe systems and make predictions about what they see, just like real engineers do. Doing this serves as a hands-on application of aspects of the engineering design process, the steps when needs are identified and research is conducted.
After this lesson, students should be able to:
- Define position and velocity.
- Identify the relationships between position and velocity.
- Observe a system and make predictions about what they see, just like real engineers do.
- CCSS.Math.Content.HSS-ID.A.1 Represent data with plots on the real number line (dot plots, histograms, and box plots).
Grades 9-12
Do you agree with this alignment?
- CCSS.Math.Content.HSS-ID.A.1 Represent data with plots on the real number line (dot plots, histograms, and box plots).
Grades 9-12
Do you agree with this alignment?
- Technological problems must be researched before they can be solved.
Grades 9-12
Do you agree with this alignment? - STEL-8Q Synthesize data and analyze trends to make decisions about technological products, systems, or processes.
Grades 9-12
Do you agree with this alignment?
- Process data and report results.
Grades K-12
Do you agree with this alignment?
- Use multiple processes and diverse perspectives to explore alternative solutions.
Grades K-12
Do you agree with this alignment? - Operate Systems - Understand technology systems and use hardware and networks to support learning.
Grades K-12
Do you agree with this alignment?
A basic understanding of the concepts of position, velocity and acceleration, and how they relate to each other.
To collect data for generating position vs. time and velocity vs. time graphs, have students use sonar-based Vernier motion detectors or similar devices. These sensors require software to interpret the data. With the Vernier device, use Logger Pro, or Logger Lite—a free download. Some motion detectors also require an interface, but Vernier has a version that connects directly to a computer via USB. Vernier also has a CBR version that connects directly to a compatible TI-calculator and uses internal software to record data.
Possible motion detector options:
- Go!Motion ($109): https://www.vernier.com/products/sensors/motion-detectors/go-mot/
- Calculator-Based Ranger (CBR) 2 ($99): https://www.vernier.com/products/sensors/motion-detectors/cbr2/
- Motion Detector ($79): https://www.vernier.com/products/sensors/motion-detectors/md-btd/
Possible interface options:
- Go!Link ($61): https://www.vernier.com/products/interfaces/go-link/
- LabQuest Mini ($149): https://www.vernier.com/products/interfaces/lq-mini/
- LabQuest 2 ($329): https://www.vernier.com/products/interfaces/labq2/
- CBL 2 (for TI graphing calculators) ($166): https://www.vernier.com/products/interfaces/cbl2/
Possible software options:
- Logger Lite (free download): https://www.vernier.com/products/software/logger-lite/
- Logger Pro ($249): https://www.vernier.com/products/software/lp/
As students compare their predicted graphs to the graphs produced using the motion detector data, the ultimate goal is for them to understand that the slope of a tangent line at a given point is the object's instantaneous velocity and that a velocity vs. time graph is just a representation of an object's instantaneous velocities over time. If necessary, guide the class discussion so that students reach this understanding.
In order to complete the associated activity,"Gaitway" to Acceleration: Walking Your Way to Acceleration, students must understand what a secant line to a curve is and how to compute Riemann sums. So, teach students the following lesson content to prepare them for the associated activity.
Secant lines: A secant line of a curve is a line that intersects a curve in a local region at two points on the curve. As the two intersection points become closer together on the curve, the secant line becomes closer and closer to the tangent line at a point on the curve. In calculus, the derivative evaluated at a point on the curve is the slope of the tangent line at that evaluated point. A secant line is a way to approximate derivatives without taking a derivative.
In the associated activity, the data does not have a corresponding equation (although you could perform a regression to find one) so taking a derivative is not possible. Secant lines allow the approximation of the derivative (which would represent the velocity of the object) without requiring the computation of the derivative. If you create a curve from the associated points found by taking a derivative (or approximating using secant lines), you can create a velocity curve of the object. Computing secant lines for this curve in the same fashion as the previous example is a method for approximating the second derivative, which represents the acceleration of the object. Again, by using secant lines, the acceleration can be approximated without having an equation and using calculus. To compute a secant line, select two points, calculate the slope, plug one of the selected points and the slope into point slope form, and then algebraically manipulate it into any form of the line that you wish. When working from the object's position, the secant line evaluated at an appropriate "x" value yields a "y" value that represents the object's velocity (first derivative). When working from the object's velocity, the secant line evaluated at an appropriate "x" value yields a "y" value that represents the object's acceleration (second derivative).
Riemann sum: A Riemann sum is an approximation of the area under a curve. The sum is computed by dividing the region into polygons (rectangles, trapezoids, etc.) that when combined approximate the area under the curve. The area for each of the polygons is computed using an appropriate area equation and the results are added to approximate the region. Using Riemann sums, a numerical approximation of a definite integral can be found. Similar to the secant line, a Riemann sum can be used to approximate an object's velocity or position without having an equation that you can integrate. An integral is the inverse of a derivative. Hence, a Riemann sum approximation works backwards from a secant line approximation. Given an object's acceleration curve, a Riemann sum can be used to determine an object's velocity curve. Given an object's velocity curve for an object, a Riemann sum can be used to determine an object's position curve.
Various Definitions of Acceleration
In recognizable terms: In common words, acceleration is a measure of the change in speed of an object, either increasing (acceleration) or decreasing (deceleration). This definition is not completely accurate because it disregards the directional component of the velocity vector. Vectors have two components—magnitude and direction. When discussing speed, we only consider the change in magnitude.
In conceptual terms: Acceleration is a quantity in physics that is defined to be the rate of change in the velocity of an object over time. Since velocity is a vector, acceleration describes the rate of change in the magnitude and direction of the velocity of an object. When thinking in only one dimension, acceleration is the rate that something speeds up or slows down.
In mathematical terms: Many different mathematical variations exist for acceleration. Below is a partial listing:
- Newton's second law of motion: For a body with constant mass, the acceleration is proportional to the net force acting on it. Fnet = ma
- Rate of change in velocity with respect to time, slope of velocity vs. time graph (two forms):
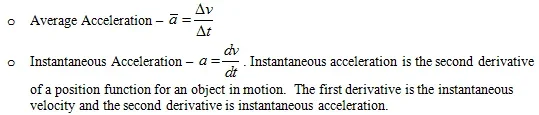
- Constant acceleration is when the velocity of an object in motion changes by an equal amount in equal interval time periods. Using algebra, the following kinematic equations can be derived:

In process terms: To compute the acceleration of an object, it is first essential to understand what type of motion is occurring. Once the type of motion is determined, a variety of mathematical equations can be applied, depending on the situation. Unfortunately, the acceleration is only easy to find in situations in which the object's motion is predictable. For instance, when an object is undergoing harmonic motion, the acceleration of the object can be determined because the object's position is predictable at any point in time.
In applicable terms: Any object in motion has acceleration. If the object's velocity is changing, the object is either accelerating or decelerating. If the object has constant velocity, the object's acceleration is zero. If an object is moving at a constant speed following a circular path, the object experiences a constant acceleration that points toward the center of the circle.
(Have ready the supplies [toy cars, ball, incline, dynamics cart] to present the four motion scenarios, plus motion detectors with their necessary software and/or interfaces, as described in more detail in the Lesson Background section.)
In this lesson, you will observe moving objects and discuss position, velocity and acceleration to describe motion. The four different scenarios of moving objects are:
- Two toy cars that move across a table or floor with constant speeds, one faster than the other.
- A ball that speeds up at a uniform rate as it rolls down an incline.
- A dynamics cart that slows down at a uniform rate as it rolls across a table or floor.
- A person walking across the room with a speed that changes irregularly.
For each scenario, observe the moving objects and sketch predicted position vs. time and velocity vs. time graphs for each. After you observe all the examples, consider these questions. (Refer to Table 1; read the questions aloud, write them on the classroom board, or show the class the Six Questions Visual Aid (PDF).)
(Proceed to demonstrate the four scenarios in the classroom, directing students to sketch predicted graphs for each and then answer the questions in Table 1.)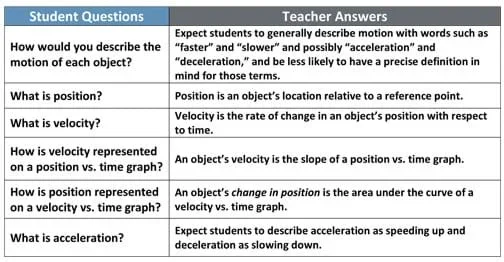 Table 1. Questions for students and answers for the teacher.
Now, using a motion detector, interface and software, observe each moving object again, while collecting data to generate position vs. time and velocity vs. time graphs as the objects are moving. To accomplish this, use a sonar-based motion detector. These devices measure where an object is located as long as it is directly in front of the sensor and nothing between the object and the sensor blocks the sound waves. Then use software to interpret the data collected using the motion detector. Finally, compare your predicted graphs to the graphs produced using the motion detector's data and discuss any differences.
- acceleration
- The rate of change of an object's velocity.
- dynamics cart
- A low-friction cart with mass designed to perform high-quality motion experiments.
- position
- An object's location relative to a reference point.
- riemann sum
- The approximation of the area of the region under a curve.
- secant line
- A line that locally intersects two points on the curve. Secant lines can be used to approximate the tangent to a curve by moving the points of intersection of the secant line closer to the point of tangency.
- velocity
- The rate of change in an object's position with respect to time.
Pre-Lesson Assessment: Ask students the following questions to gauge their prior knowledge:
- Explain your understanding of velocity. (Answer: Velocity is the rate of change in [derivative of] position with respect to time.)
- How does velocity change as an object moves? (Answer: The velocity of an object changes based on how the object's motion changes. If the object's motion changes directions or slows down or speeds up, its velocity changes. If the object's motion remains at a constant speed in the same direction, its velocity is unchanged.)
- What is acceleration? (Answer: Acceleration is the rate of change in [derivative of] velocity with respect to time.)
Formative Assessment: As students are engaged in the lesson, ask these (or similar) questions:
- Can you draw accurate representations of what a velocity vs. time graph would look like for the scenarios?
- Do you understand how velocity can be represented on a position vs. time graph?
- Can you make reasonable comparisons between position vs. time graphs and velocity vs. time graphs?
Lesson Summative Assessment: Assign students to answer the following writing prompt:
- Using your experiences in this lesson, explain how you can find the instantaneous velocity of an object or draw a velocity vs. time graph given the object's position vs. time graph. (Answer: To find the instantaneous velocity of an object given the position vs. time graph, find the slope of the tangent line to the curve at the desired point. To draw a velocity vs. time graph from a position vs. time graph, compute the instantaneous velocity of the object at regular intervals and then graph those values at the time that they occurred and connect the "dots" with a smooth curve.)
- Position, Velocity and Acceleration
Contributors
Jeremy Scheffler; Brian Sandall
Supporting Program
IMPART RET Program, College of Information Science & Technology, University of Nebraska Omaha
Acknowledgements
The contents of this digital library curriculum were developed as a part of the RET in Engineering and Computer Science Site on Infusing Mobile Platform Applied Research into Teaching (IMPART) Program at the University of Nebraska Omaha under National Science Foundation RET grant number CNS 1201136. However, these contents do not necessarily represent the policies of the National Science Foundation, and you should not assume endorsement by the federal government.
Copyright
2015 by Regents of the University of Colorado; original © 2014 Board of Regents, University of Nebraska