
Gait Analysis
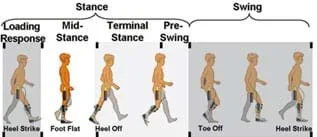 One human gait cycle.Copyright 1992 Perry J. Gait analysis: Normaland pathological function. Thorofare (NJ): SLACK via U.S. Department of Veterans Affairs http://www.rehab.research.va.gov/jour/11/484/page459.html
In this open-ended, hands-on activity that provides practice in engineering data analysis, students are given gait signature metric (GSM) data for known people types (adults and children). Working in teams, they analyze the data and develop models that they believe represent the data. They test their models against similar, but unknown (to the students) data to see how accurate their models are in predicting adult vs. child human subjects given known GSM data. They manipulate and graph data in Excel® to conduct their analyses.
Engineers often create predictive models from collected data to attempt to dynamically represent systems and how they function. Much of the engineering design process is related to problem analysis, data collection, modeling, model testing and model refinement. In this activity, students perform these tasks, which are similar to what real engineers do. For instance, software engineers determine the parameters that a software application must meet to be successful. They design and test the developed software and refine it. Civil engineers gather data about where roads, bridges and buildings will be built and then develop models to explore scenarios about how input such as moisture, wind, temperature and soil types are anticipated affect the structures. Models are developed and tested. These types of projects require data analysis and modeling skills that students learn in this activity.
After this activity, students should be able to:
- Analyze data.
- Define a model relating to the data.
- Make predictions using the developed model.
- CCSS.Math.Content.HSN-Q.A Reason quantitatively and use units to solve problems.
Grades 9-12
Do you agree with this alignment? - CCSS.Math.Content.HSS-ID.A Summarize, represent, and interpret data on a single count or measurement variable
Grades 9-12
Do you agree with this alignment? - CCSS.Math.Content.HSS-ID.B.6 Represent data on two quantitative variables on a scatter plot, and describe how the variables are related.
Grades 9-12
Do you agree with this alignment?
- CCSS.Math.Content.HSS-ID.A Summarize, represent, and interpret data on a single count or measurement variable
Grades 9-12
Do you agree with this alignment? - CCSS.Math.Content.HSS-ID.B.6 Represent data on two quantitative variables on a scatter plot, and describe how the variables are related.
Grades 9-12
Do you agree with this alignment?
- STEL-7AA Illustrate principles, elements, and factors of design.
Grades 9-12
Do you agree with this alignment? - STEL-7Y Optimize a design by addressing desired qualities within criteria and constraints.
Grades 9-12
Do you agree with this alignment?
- Process data and report results.
Grades K-12
Do you agree with this alignment? - Collect and analyze data to identify solutions and/or make informed decisions.
Grades K-12
Do you agree with this alignment?
- CCSS.Math.Content.HSN-Q.A Reason quantitatively and use units to solve problems.
Grades 9-12
Do you agree with this alignment? - CCSS.Math.Content.HSS-ID.A Summarize, represent, and interpret data on a single count or measurement variable
Grades 9-12
Do you agree with this alignment? - CCSS.Math.Content.HSS-ID.B.6 Represent data on two quantitative variables on a scatter plot, and describe how the variables are related.
Grades 9-12
Do you agree with this alignment?
- SEP.2.9-12.2 Ask questions that arise from examining models or a theory to clarify relationships.
Grades 9-12
Do you agree with this alignment? - SEP.1.9-12.2 Apply concepts of statistics and probability (including determining function fits to data, slope, intercept, and correlation coefficient for linear fits) to scientific and engineering questions and problems, using digital tools when feasible.
Grades 9-12
Do you agree with this alignment?
Each group needs:
- computer or laptop with Microsoft Excel® (or similar program)
- Gait Signature Metric Data (XLSX), and Excel® spreadsheet, saved to the computer
Students require the experiences gained in the associated lesson, Walk This Way: Studying Human Movement and its first associated activity, Identifying Gait Metrics, which sets up the vocabulary and concepts, and gets them thinking about how they would differentiate between the gaits of different people.
In this activity, you will be constructing a model that could be used to represent gaits of different age groups given already-collected data. Engineers spend a lot of time observing systems and developing models that attempt to predict how a system behaves. After performing this type of analysis, engineers have a better understanding of the system, its underling constraints, and where it can be improved.
Background
The activity relates to the modeling of gait signature metric (GSM) data. Many different applications for this data exist, including medical diagnoses, biometric recognition and other biomechanics uses. Students gain experience with this data and have practice with engineering analysis and data analysis techniques.
In this activity, students are provided with GSM data compiled by Ik-Hyun Youn at the University of Nebraska Omaha. Each metric is the mean, standard deviation, or coefficient of variation of one the quantities for all steps in a trial.
This activity is a hands-on data analysis activity framed as engineering analysis. The problems are intentionally vague to make them more real-world in nature since most problems do not have clearly defined parameters and guidelines. The open-ended nature puts the responsibility to devise solid approaches and processes in the hands of the students (engineers).It may be frustrating for some students who have not experienced this type of problem, however, the experiences and skills gained through this type of exercise are well worth it.
Teachers require a detailed knowledge of how gait analysis modeling is done. Please refer to the detailed Gait Analysis Activity Tutorial (PDF), which leads the teacher through the entire process for how the activity is completed, including possible solutions.
Before the Activity
- Arrange for computers or laptops with Microsoft Excel® and the Gait Signature Metric Data (XLSX) spreadsheet saved on the computer, one computer per group. The spreadsheet contains the GSM data students analyze in order to construct a predictive model for categorizing subjects, such as adults compared to children.
- Read through the Gait Analysis Activity Tutorial (PDF).
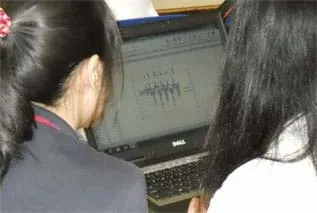 Students examine gait data analysis.Copyright 2014 Jeremy Scheffler, University of Nebraska Omaha
With the Students
- Divide the class into groups of three students each. Working at computers or laptops, have groups open the spreadsheet that has the Gait Signature Metric (GSM) data contained in it. This is the data students will analyze in order to construct predictive models.
- To begin, have students go to the spreadsheet tab titled "Adults & Children." Direct them to decide as a group the best way to sort the data and then graph the data.
- Next, direct each group to identify metrics that could be used to distinguish between adults and children. Prompt them to remember the analysis that was conducted in the associated lesson and the class discussion from the lesson.
- Using one or more of the metrics, each group proceeds to construct a predictive model for categorizing an unknown subject as an adult or a child.
- Then students test their models. They open the spreadsheet tab titled "Unknown Subjects" and access GSM data for unknown subjects.
- Direct groups to apply their models to predict whether the unknown subjects are adults or children. By doing this, they are attempting to assess the reliability of their models and the limitations that introduce uncertainty to their predictions.
- At this point, have each group present to the class its model and predictions for the unknown subjects. Since every group worked from the same starting data, expect the models to be similar but with differences arising from how each group analyzed and approached the problem.
- As a class, the teacher "unhides" column A in the "Unknown Subjects" spreadsheet to reveal whether each of the unknown subjects is an adult or a child. If necessary, refer to the linked website for instructions on how to "unhide" column A under the header, Display all hidden rows and columns at the same time.
- As a class, have students discuss their predictions. Were your predictions correct? Or incorrect? Were some groups better than others? Why?
- To conclude, now that they have more data to analyze, give students time to modify their models in some way to make them better predictors.
- Conclude by administering the closing assessment assignment as described in the Assessment section.
- accelerometer
- A device that measures the physical acceleration experienced by an object.
- dynamicity
- In terms of gait analysis, the quantification of variations in kinematic or kinetic parameters within a step.
- gait
- The stride of a human as s/he moves his/her limbs.
- metric
- A quantitative indicator of a characteristic or attribute.
- model
- In technology, a description of observed or predicted behavior of some system, simplified by ignoring certain details. Models allow complex systems to be understood and their behavior predicted. Source: The Free Online Dictionary of Computing, © Denis Howe 2010 http://dictionary.reference.com/browse/model
- symmetry
- In terms of gait analysis, the quantification of differences between left-foot and right-foot steps.
- variability
- In terms of gait analysis, the quantification of fluctuations from one stride to the next.
Pre-Activity Assessment
Review: Ask students to explain what they know from examining gait data from the associated lesson and its first associated activity. Ask them about the quantities that they measured and how they used the accelerometers to gather data. In addition, ask them what characteristics or physical properties affect a person's gait.
Activity-Embedded Assessment
Questioning: As students are engaged in the activity ask these or similar questions:
- What is involved in the process of data analysis?
- How are you analyzing data to construct a predictive model?
- How are you using a model to interpret new data?
Post-Activity Assessment
Writing Prompt and Performance Assessment: At activity end, administer the Gait Analysis Activity Assessment (PDF), which asks students to individually answer one of three writing prompts, and then analyze, create a model and make predictions using provided GSM data. Refer to the Gait Analysis Activity Assessment Answer Key (PDF). Students' answers reveal their depth of comprehension.
In what other ways might engineers use gait analysis? Tell students about two new wearable products (socks with textile sensors and a gadget that clips to the back of a shoe) designed to measure more than 15 metrics about a runner's gait—such as cadence, foot-strike pattern and landing forces—without the need for elaborate computer analysis and in real time. These are essentially "tools" designed by engineers. What sort of engineering analysis went into the design of these inventions? The purpose of the devices is to spot patterns (trends!), improve performance and prevent injury in a sport that researchers say injures about half of its participants each year. See the September 22, 2014, issue of the Wall Street Journal at http://www.wsj.com/articles/gear-to-help-runners-diagnose-form-and-gait-1411425306.
Contributors
Jeremy Scheffler; Brian Sandall
Supporting Program
IMPART RET Program, College of Information Science & Technology, University of Nebraska-Omaha
Acknowledgements
The contents of this digital library curriculum were developed as a part of the RET in Engineering and Computer Science Site on Infusing Mobile Platform Applied Research into Teaching (IMPART) Program at the University of Nebraska-Omaha under National Science Foundation RET grant number CNS 1201136. However, these contents do not necessarily represent the policies of the National Science Foundation, and you should not assume endorsement by the federal government.
Copyright
2015 by Regents of the University of Colorado; original © 2014 Board of Regents, University of Nebraska