
Applying Statistics to Nano-Circuit Dimensions in Fabrication
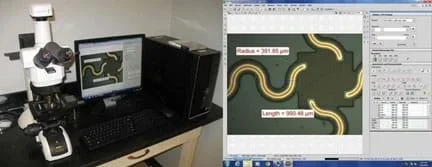 A high-resolution microscope with sophisticated imaging software is required to measure nano-circuit component dimensions; accuracies of 1.49 μm/pixel or better can be achieved.Copyright 2015 Wearable Electronics Laboratory, Energy Park Unit, Mechanical Engineering Department, University of Houston
Measuring the dimensions of nano-circuits requires an expensive, high-resolution microscope with integrated video camera and a computer with sophisticated imaging software, but in this activity, students measure nano-circuits using a typical classroom computer and (the free-to-download) GeoGebra geometry software. Inserting (provided) circuit pictures from a high-resolution microscope as backgrounds in GeoGebra's graphing window, students use the application's tools to measure lengths and widths of circuit elements. To simplify the conversion from the on-screen units to the real circuits' units and the manipulation of the pictures, a GeoGebra measuring interface is provided. Students export their data from GeoGebra to Microsoft® Excel® for graphing and analysis. They test the statistical significance of the difference in circuit dimensions, as well as obtain a correlation between average changes in original vs. printed circuits' widths. This activity and its associated lesson are suitable for use during the last six weeks of the AP Statistics course; see the topics and timing note below for details.
Flexible nano-electronics—that is, electronic circuits that bend and take different forms—have seen rapid development during the last few years because of the plentiful range of applications that are difficult if not impossible achieve with conventional rigid electronics. Nano-wearable electronics are composed of millions of circuits arranged in a thin, lightweight, mechanically flexible, stretchable and conformable structure. They enable comfortable, continuous and mobile monitoring on people and animals. Using wearable electronics, engineers are able to find solutions for challenges such as: What if electronics were soft and pliable? What if electronics conformed to us, instead of us conforming to electronics? In this context, students see a real-world applied use for statistical analysis.
After this activity, students should be able to:
- Empirically quantify how much diffraction affects circuit dimensions during the printing process, and determine if these changes are statistically significant.
- Determine linear and non-linear correlations between variables.
- Use the GeoGebra geometry software to obtain indirect measurements of objects that cannot be measured directly.
- Use Excel® functions and capabilities to process, graph and perform statistical analysis on data.
- Use PowerPoint® to present results and conclusions.
- CCSS.Math.Content.HSN-Q.A Reason quantitatively and use units to solve problems.
Grades 9-12
Do you agree with this alignment? - CCSS.Math.Content.HSS-IC.B.5 Use data from a randomized experiment to compare two treatments; use simulations to decide if differences between parameters are significant.
Grades 9-12
Do you agree with this alignment? - CCSS.Math.Content.HSS-IC.B.6 Evaluate reports based on data.
Grades 9-12
Do you agree with this alignment? - CCSS.Math.Content.HSS-ID.A Summarize, represent, and interpret data on a single count or measurement variable
Grades 9-12
Do you agree with this alignment? - CCSS.Math.Content.HSS-ID.A.2 Use statistics appropriate to the shape of the data distribution to compare center (median, mean) and spread (interquartile range, standard deviation) of two or more different data sets.
Grades 9-12
Do you agree with this alignment? - CCSS.Math.Content.HSS-ID.B Summarize, represent, and interpret data on two categorical and quantitative variables
Grades 9-12
Do you agree with this alignment? - CCSS.Math.Content.HSS-ID.B.6 Represent data on two quantitative variables on a scatter plot, and describe how the variables are related.
Grades 9-12
Do you agree with this alignment? - CCSS.Math.Content.HSS-MD.A Calculate expected values and use them to solve problems
Grades 9-12
Do you agree with this alignment? - CCSS.Math.Practice.MP2 Reason abstractly and quantitatively.
Grades K-12
Do you agree with this alignment? - CCSS.Math.Practice.MP4 Model with mathematics.
Grades K-12
Do you agree with this alignment? - CCSS.Math.Practice.MP5 Use appropriate tools strategically.
Grades K-12
Do you agree with this alignment?
- Students will develop an understanding of the characteristics and scope of technology.
Grades K-12
Do you agree with this alignment? - Students will develop an understanding of the relationships among technologies and the connections between technology and other fields of study.
Grades K-12
Do you agree with this alignment? - Medical technologies include prevention and rehabilitation, vaccines and pharmaceuticals, medical and surgical procedures, genetic engineering, and the systems within which health is protected and maintained.
Grades 9-12
Do you agree with this alignment? - STEL-8Q Synthesize data and analyze trends to make decisions about technological products, systems, or processes.
Grades 9-12
Do you agree with this alignment?
- CCC.8.9-12.15 Engineers continuously modify these technological systems by applying scientific knowledge and engineering design practices to increase benefits while decreasing costs and risks.
Grades 9-12
Do you agree with this alignment? - SEP.1.9-12.2 Apply concepts of statistics and probability (including determining function fits to data, slope, intercept, and correlation coefficient for linear fits) to scientific and engineering questions and problems, using digital tools when feasible.
Grades 9-12
Do you agree with this alignment? - CCC.12.9-12.5 Technological advances have influenced the progress of science and science has influenced advances in technology.
Grades 9-12
Do you agree with this alignment? - SEP.6.9-12.4 Communicate scientific information (e.g., about phenomena and/or the process of development and the design and performance of a proposed process or system) in multiple formats (including orally, graphically, textually, and mathematically).
Grades 9-12
Do you agree with this alignment? - SEP.12.9-12.5 Use mathematical and/or computational representations of phenomena or design solutions to support explanations.
Grades 9-12
Do you agree with this alignment?
- AII.9-12.1.D communicate mathematical ideas, reasoning, and their implications using multiple representations, including symbols, diagrams, graphs, and language as appropriate;
Grades 9-12
Do you agree with this alignment? - MMA.9-12.5 Mathematical modeling in science and engineering. The student applies mathematical processes with algebraic techniques to study patterns and analyze data as it applies to science. The student is expected to:
Grades 9-12
Do you agree with this alignment? - S.9-12.2.F communicate methods used, analyses conducted, and conclusions drawn for a data-analysis project through the use of one or more of the following: a written report, a visual display, an oral report, or a multi-media presentation; and
Grades 9-12
Do you agree with this alignment? - S.9-12.7 Bivariate data. The student applies the mathematical process standards to analyze relationships among bivariate quantitative data. The student is expected to:
Grades 9-12
Do you agree with this alignment? - AII.9-12.1.B use a problem-solving model that incorporates analyzing given information, formulating a plan or strategy, determining a solution, justifying the solution, and evaluating the problem-solving process and the reasonableness of the solution;
Grades 9-12
Do you agree with this alignment?
- CSI.2.A create and properly display meaningful output;
Grades 9-12
Do you agree with this alignment? - CSI.2.C use Graphical User Interfaces (GUIs) to create interactive interfaces to acquire data from a user and display program results;
Grades 9-12
Do you agree with this alignment?
Each group needs:
- computer with Internet access, one per student
- Microsoft Office® applications: Excel®, PowerPoint®, Word®
- (optional) video-creating equipment and software, to make final presentations (instead of PowerPoint®)
- GeoGebra freeware geometry software; download from https://www.geogebra.org/
- GeoGebra Measuring Interface (GGB), a ggb (GeoGebra) file, loaded on each computer
- Nano-Circuit Picture Sets (ZIP), a zip file, loaded on each computer
- (optional) graphing calculator with statistical analysis capabilities, such as TI-Nspire CX or CAS
- Pre-Activity Test (PDF), one per person
- GeoGebra Measuring Interface Manual (PDF), one per person
- GeoGebra Basics Practice (PDF), one per person
- Graphing Data and Statistical Analysis with Excel Practice (PDF), one per person
- Project Rubric (PDF), one per person
To share with the entire class:
- computer that is set up the same as the student computers, but for the teacher's use
- projector, to show the teacher's monitor to the entire class
- Pre-Activity Test (docx)
- Pre-Activity Test (pdf)
- Pre-Activity Test Answer Key (docx)
- Pre-Activity Test Answer Key (pdf)
- GeoGebra Measuring Interface (ggb)
- GeoGebra Measuring Interface Manual (docx)
- GeoGebra Measuring Interface Manual (pdf)
- Nano-Circuit Picture Sets (zip)
- GeoGebra Basics Practice (docx)
- GeoGebra Basics Practice (pdf)
- GeoGebra Basics Practice Answer Key (docx)
- GeoGebra Basics Practice Answer Key (pdf)
- Graphing Data and Statistical Analysis with Excel Practice (docx)
- Graphing Data and Statistical Analysis with Excel Practice (pdf)
- Graphing Data and Statistical Analysis with Excel Practice Answer Key (docx)
- Graphing Data and Statistical Analysis with Excel Practice Answer Key (pdf)
- Project Rubric (docx)
- Project Rubric (pdf)
This end-of-the-year activity is designed for students taking AP Statistics. Specific required skills are:
- Hypothesis testing for dependent and independent samples
- Experimental design skills to obtain simple random samples
- Linear regression
- Algebra 2/pre-calculus, specifically logarithmic and exponential functions
In addition, basic computer skills in using Microsoft® Excel® and GeoGebra are necessary.
Modern electronics technology has plentiful and varied real-life applications. Think about medical applications. For instance, if you want to know your blood pressure, engineers have designed blood pressure (BP) monitors to make those measurements. Now suppose you need to monitor your blood pressure continuously over long periods, say one or two days. That's not a problem because portable and wearable BP monitors are available to perform the job for you (see Figure 1). But, if you wear a BP monitor like this for an entire day, it is annoying for an adult, and even worse for an active child. Thinking like an engineer, can you imagine an alternative, better solution for this situation? How could a BP monitor be more comfortable to use? Would it be possible for a health monitoring device to adapt to the human form?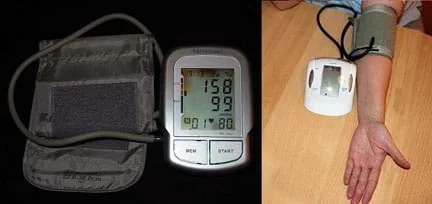 Figure 1. A portable blood pressure monitor is used to measure and record a person's blood pressure over extended periods of time.Copyright (left) 2009 Steven Fruitsmaak, Wikimedia Commons; (right) 2014 bykst, Pixabay https://commons.wikimedia.org/wiki/File:Grade_1_hypertension.jpg https://pixabay.com/en/high-blood-pressure-247139/
In the last decade, engineers have been developing a new kind of electronics that places millions of nano-circuits on flexible materials. This flexible circuitry technology—known as flexible, soft or wearable electronics—enables the design of applications that were unthinkable years ago. For example, one wireless prototype is a flexible piece of soft electronics that adheres to skin in order to monitor a person's vital signs such as body temperature and heart rate. The prototype also contains a battery and an antenna and is able to transmit data to a central location that relays the information to a smart phone.
(Show students the 3:39-minute Monitor Your Health with Electronic Skin video at about existing and future flexible circuitry technology applications: https://www.youtube.com/watch?v=iaRhuWRSBao. See the Additional Multimedia Support section for additional suggestions of resources—articles, photographs, video—to show the class.)
The development of a prototype like this "electronic skin" is a long and complex engineering process, from the initial idea and design, to testing and redesign. This cycle, known as the engineering design process or EDP (see Figure 2), is repeated over and over—as many times as are needed to develop a successful solution. The steps help to guide the design team through the product development process in a logical manner. This process also requires teamwork. Typically, the solving of complex problems requires that specialists in different areas work together.
The EDP is a flexible and cyclical process. For example, engineers may design something and then discover a problem during the testing phase; then they jump back to an earlier design step to make modifications or brainstorm new ideas before moving on through the process. Engineers follow the steps of the design process to guide the development of their ideas and ensure that they create the best possible product (or other design solution) that addresses the requirements and constraints of what they are aiming to achieve.
Let's go through an example. Remember earlier we identified a possible problem: a bulky portable blood monitor is impractical for use by kids. Making the device lighter, smaller and able to conform to kids would be a great solution to the problem. Research shows that nano-electronics may solve the size problem and flexible electronics enables designs to adapt to specific forms. The next step is to design a blood monitor that integrates the two technologies. Different designs and their sub-components are fabricated and tested many times, with changes and revisions incorporated to make improved prototypes. At some point, the best prototype is tested under controlled conditions on humans, with the results evaluated to redesign for improvement. Finally, the prototype is tested again on humans, under normal conditions now, to gain more feedback. The cycle is repeated as necessary to improve device performance before it is produced and sold.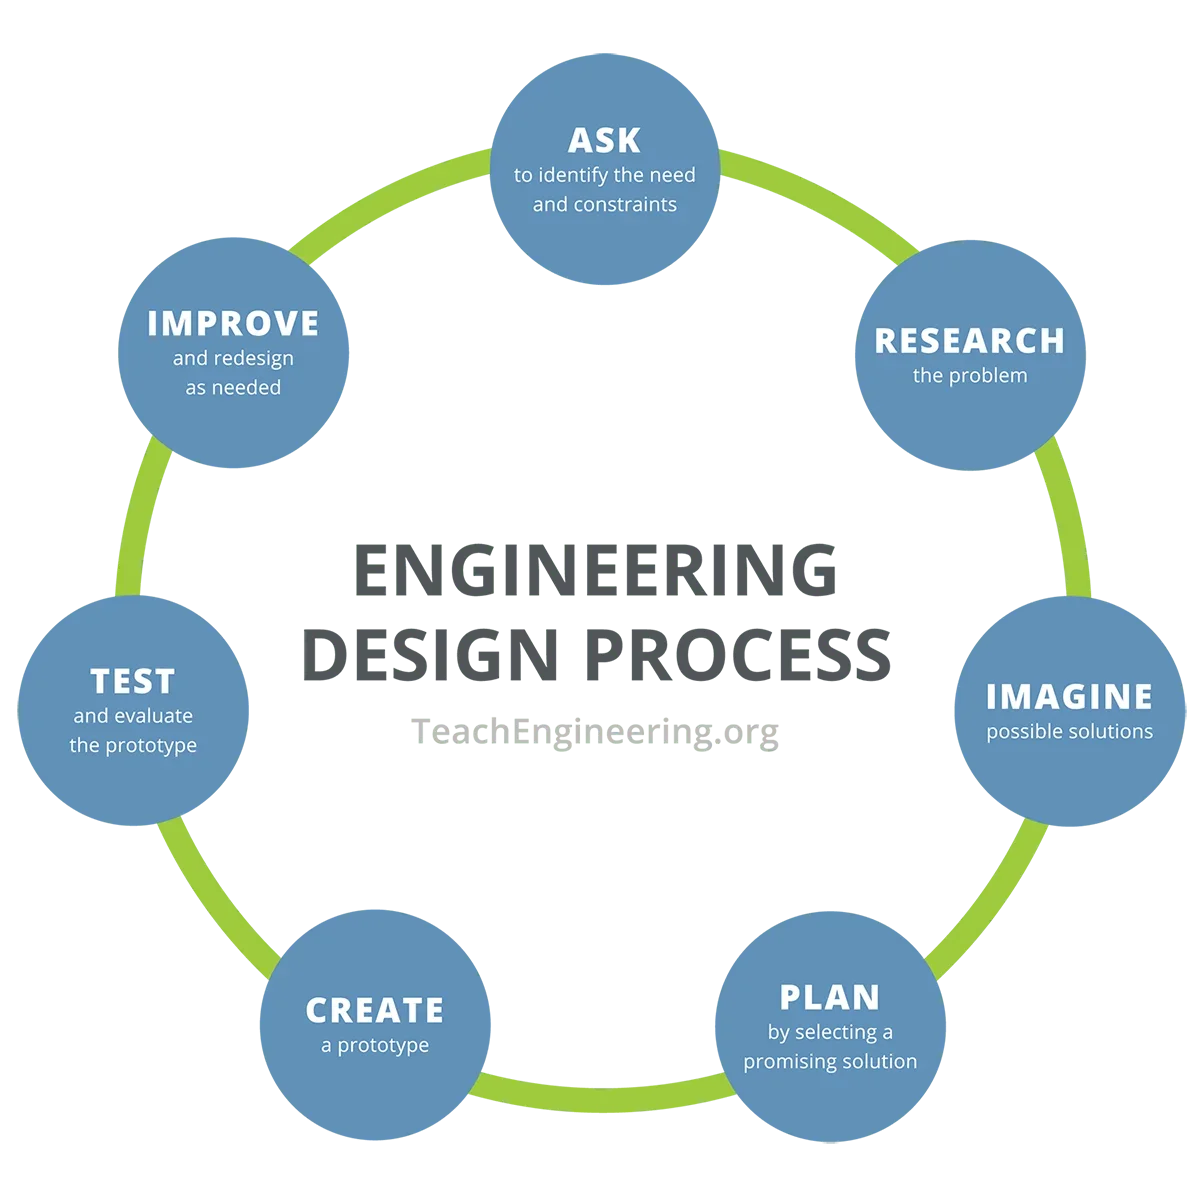 Figure 2. The engineering design process can be used to solve any type of problem.Copyright 2019 TeachEngineering.org. All rights reserved. https://www.teachengineering.org/engrdesignprocess.php
In this activity, you will statistically analyze a problem arising during the fabrication process: the difference in dimensions between the original design and the fabricated circuit. This problem may become critical for the fabrication of increasingly smaller circuits because a severe change in circuit dimensions may affect mechanical properties like strain and stress, or conductivity and resistivity, thus compromising circuit reliability.
Using the GeoGebra geometry software, you will measure the dimensions of nano-circuits on pictures of the original masks and on pictures of the final printed circuits. Then using Excel®, you will graph and analyze the data to determine if the differences in these measurements are statistically significant. To conclude, you will report and present in class your analysis, results and conclusions.
Background
This project was designed and developed in the Wearable Electronics Laboratory at the University of Houston. The purpose of this lesson/activity set is to apply in the context of a real-world, state-of-the-art research problem, the concepts learned in an AP Statistics course: to verify if the fabrication process affects significantly an original circuit's dimensions defined during the design process. Project guidelines:
- Because of the project workload, it is accomplished by teams of three students each.
- Students work on two nano-circuit picture sets: circuit original masks (designs) and fabricated printed circuits.
- Students select samples from these pictures and open them with GeoGebra to perform measurements on the circuit elements using a special interface designed specifically for this. Students may work with paired samples or independent samples.
- The collected measurements are exported to Excel®, and using its graphical and mathematical capabilities, the data is graphed, compared and statistically analyzed.
- Students create a PowerPoint® slide show or a video (mp4, wma, mpeg) to present project results.
- Teams present to the rest of the class their results, analyses and conclusions.
- Make help available for the math and final presentation preparation, during afterschool tutorial time.
- All the project activities are part of the final grade. If two or all three team members justifiably miss any of these activities, have students arrange for a makeup session before the project deadline.
A basic knowledge of GeoGebra geometry software and Microsoft® Excel® is required. GeoGebra is used to make measurement on nano-circuit images, and Excel® is used for graphing and statistical results analysis. For more information, see the Statistical Analysis of Flexible Circuits associated lesson, as well as the resources listed in the Additional Multimedia Support section.
Before the Activity
- Due to the activity complexity, instructors must understand many little details in order to teach it and support students throughout the activity. Thus, it is highly recommended that instructors try the activity by themselves first, carefully performing every step, including the creation of a results presentation that can be used as an example for students. Be sure to read the teacher tips and notes included in the Lines and Circles Guided Practice: Teacher Instructions (PDF). If necessary, request help from the author at mramirez2@galenaparkisd.com.
- Prepare the computers so they have Internet access as well as Microsoft Office® and GeoGebra installed; also load the GeoGebra Measuring Interface (GGB), a ggb file. Prepare on each computer a subdirectory containing the paired nano circuit picture files from the Nano-Circuit Picture Sets (ZIP) zip file. Determine a method to randomly assign a circuit to each team; given the limited number of circuit pictures, more than one team may work with the same circuit set. Optionally, provide for teams an example results slide presentation or video (pptx or mp4 file) created by the teacher.
- Prepare a teacher's computer the same as the student computers. On Day 1, connect it to a projector so as to be able to show the entire class the teacher's monitor.
- Make copies of the Pre-Activity Test (PDF), GeoGebra Measuring Interface Manual (PDF), GeoGebra Basics Practice (PDF), Graphing Data and Statistical Analysis with Excel Practice (PDF) and Project Rubric (PDF), one each per student. Personalize the project rubric with a project due date before printing copies. Note that two versions of the project checklist are provided; decided which to use, or modify one as desired.
- Optionally, make available graphing calculators with statistical functions, which students can use to verify their statistical results with the data sets.
With the Students—Day 1
Topics: Introduction to GeoGebra and the measuring interface
Estimated time: 50 minutes in the classroom/computer lab
- Administer the pre-activity test as described in the Assessment section.
- Present the Introduction/Motivation section content, including information about flexible electronics and the steps of the engineering design process.
- Begin with a brief presentation of the GeoGebra geometry software. Lead the class through the Lines and Circles Guided Practice, as detailed in the teacher's instructions.
- Introduce the GeoGebra Measuring Interface. Give every student a measuring interface manual. Perform a couple of examples showing how to use this interface, using the sample nano-circuits pictures. Note: Because the measuring interface is ad-hoc for measuring the circuits and very simple to use, expect students to have no trouble with the measuring process after this short practice.
- Then have teams conduct on their own one or both of the assignments on the GeoGebra Basics Practice handout: Spheres Student Independent Practice, Rapa-Nui Student Independent Practice. The purpose of doing these practices is for students to gain an understanding of how a scale factor is used in the GeoGebra measuring interface.
With the Students—Day 2
Topics: Project scope definition, first circuit measurements
Estimated time: 50 minutes in the classroom/computer lab
- Give every student a rubric and make sure they understand the scope and grade points for each of the project sections.
- Direct the students to organize themselves into groups of three.
- Randomly assign the circuit picture sets, one set per team. From their assigned sets, have students select their dependent samples (same circuit parts before and after printing) and independent samples (different circuit parts before and after printing). Note: Every set is paired. For example, c1-03m and c1-03p correspond to the same portion of circuit 1, in which m stands for the mask, and p for the printed circuit.
- Have groups begin the circuit measuring and data recording processes, with team members working together. At this grade level, expect AP students to be able to self-assign the necessary roles to make these processes efficient. In this case, one method is for two students to use the GeoGebra interface to measure circuits while the third student records data and circuit names in an Excel® spreadsheet.
With the Students—Day 3
Topics: Measuring samples, data collection
Estimated time: 50 minutes in the classroom/computer lab
Students continue the measuring and data collection process. For statistical analysis purposes, a data set of no less than 20 before/after measurement pairs is sufficient.
With the Students—Days 4-6
Topics: Data graphing and analysis
Estimated time: 150 minutes in the classroom/computer lab
- Pass out the Excel® practice handout. As a class, go through the guided practice (using the average faculty salaries data), explaining to students how to use Excel® to graph data, compute means, standard deviations, mins–maxes and T-test for data sets on spreadsheets.
- Students complete the independent practice (using the unemployment data) on the Excel® practice handout.
- Students perform the statistical analysis of the measured differences in circuits' dimensions for their teams' dependent and independent samples. Expect students to conclude that there is a statistically significant difference in the circuits' widths before-and-after-printing. (For more information, refer to the Lesson Background & Concepts for Teachers section in the associated lesson.)
- Have students share their circuit measurements. On the classroom board, draw a two-column table with a row for each team. Ask each team to write in the first column the obtained sample circuits' average width before printing (masks) and in the second column the obtained sample circuits average width after-printing (printed circuits). Direct students to copy down this table for their own reference.
- Using the combined class data in the table, direct students to create a third column on the table for the circuit average width relative change, computing for each entry the quotient (refer to the Lesson Background & Concepts for Teachers in the associated lesson) using the following equation. The teacher completes the table on the board with these values.
![Equation to calculate circuit average width relative change: [(average width before printing minus average width after printing) divided by average width before printing] multiplied by 100.](https://teachengwebstorageprod.blob.core.windows.net/te-content-prod/uoh_circuit_lesson01_activity1_equation1web-360x47.webp)
- Students graph the circuit's relative width change values (third column, on y-axis) versus original circuit's sample average width (first column, on x-axis). Expect these points to fit a non-linear correlation, not a linear correlation. For these points, students must obtain a correlation.
- Students may first attempt the Add Trend Line option in Excel® (click on graphed points > then click the right mouse button). Doing this, expect them to discover that the points are linked with a power relationship. Because power correlations are beyond the scope of the AP Statistics course in which students only learn about linear correlations, give students this new challenge: Since all you know (by now) is how to determine linear correlations, how could you transform the non-linear trend in your data into a linear trend?
- Give students this hint: In pre-calculus, you learned how to get rid of powers using logarithmic functions. Then write on the board the log's power property: log (xn) = n log (x)
- Next, ask the entire class to brainstorm ideas about how to use this property to address this new challenge. The answer has to be: Take the log of both the first and third column entries. Once students find the answer, require them to add two more columns to their tables and fill them with the corresponding log-values.
- The next step is to graph log(relative width change) vs. log(original circuit's average width). Expect the new log-data graph shape to now fit a linear correlation that students are able to compute, obtaining something like this: log(y) = a + b log(x).
- To find the power correlation, ask the teams to use their knowledge about logarithmic and exponential functions to get rid of logs in the previous equation. Consider giving a prize to the first team that obtains the correct answer: apply the corresponding exponential function to both sides of the equation: e x for ln(x) or 10x for log10(x), obtaining something like: y = e a x b.
With the Students—Days 7-8
Topic: Creating report presentations
Estimated time: 100 minutes in the classroom/computer lab PLUS extra class time to present final team presentations, and out-of-class time for presentation preparation
Require student teams to work after school to complete their results presentations in the form of 10-minute slide or video presentations. Use the in-class sessions for the following activities.
- As a class, review the Project Results Report and Presentations requirements in the rubric to make expectations clear.
- Give students time to work on their teams' reports and presentations—the latter in the form of a slide show (pptx) or video (mp4). Supervise and answer questions, providing guidance and feedback on how to create professional presentations.
- Select a day for teams to present their results and conclusions to the rest of the class, allowing some time for audience questions and answers.
- alternate hypothesis
- Denoted as H1, a statement that directly contradicts a null hypothesis by stating that the actual value of a population parameter is less than, greater than or not equal to the value stated in the null hypothesis.
- coefficient of determination
- A measure of how well the regression line represents the data; labeled as r2. If the regression line passes exactly through every point on the scatter plot, it explains all of the variation and r2=1. The further the line is away from the points, the less it is able to explain the variation of the data and the r2 value approaches 0.
- conductivity
- The degree to which a specified material conducts electricity or heat. It is the reciprocal of resistivity.
- correlation coefficient
- A statistical measure of the degree to which changes to the value of one variable predict change to the value of another; labeled as r. In positively correlated variables, the value increases or decreases in tandem. In negatively correlated variables, the value of one increases as the value of the other decreases.
- dependent samples
- A subset of a population whose elements are measured "before and after" a situation. Also called paired or matched samples.
- diffraction
- A deviation in the direction of a wave at the edge of an obstacle in its path. The spreading of waves around obstacles.
- electrical circuit
- A closed loop through which charges can continuously move. A network consisting of a closed loop, giving a return path for the current.
- empirical
- Based on testing, experience or observation.
- fabrication process
- In electronics, a sequence of well-defined procedures to manufacture a circuit. The process begins with the circuit design, continues with the preparation of the raw materials to be used in the process, then all the manufacturing steps, and ends with the final product or circuit.
- flexible circuit
- A pattern of conductive traces bonded on a flexible substrate. A circuit printed on a flexible dielectric substrate.
- hypothesis testing
- A process to evaluate the credibility of a hypothesis about a population; uses sample data to infer truths about the entire population.
- independent samples
- Two or more samples that have no effect on one another.
- interface
- (computing) Something that enables separate and sometimes incompatible elements to coordinate or communicate. In computer science, hardware or software designed to communicate information between hardware devices, between software programs, between devices and programs, or between computer and users.
- least-squares method
- A statistical method used to determine a line of best fit by minimizing the sum of squares created by a mathematical function. A "square" is determined by squaring the distance between a data point and the regression line.
- linear regression
- In statistics, an approach for modeling the relationship or dependence between a scalar dependent or response variable y and one or more explanatory variables denoted x, by fitting a linear equation y = a + bx.
- log-log graph
- A two-dimensional graph of numerical data that uses logarithmic scales on both the horizontal and vertical axes. Also called log-log plot.
- mean
- The average value of the data; used to derive the central tendency of the data. Also called expected value.
- measurement uncertainty
- The doubt that exists about the result of any measurement because of the precision of the measuring instrument. A quantification of the doubt about the measurement result, usually defined as: measurement taken ± half of the smallest measurement scale of the instrument.
- nanotechnology
- A branch of technology that deals with dimensions and tolerances of less than 100 nanometers in size.
- null hypothesis
- Denoted as H0, the initial statement or assumption about a population parameter, such as the population mean, that is assumed to be true.
- photolithography
- The process of transferring a pattern or design on a mask to the surface of a silicon wafer or plate, using light, and light sensitive materials on the wafer or plate.
- power regression
- Taking the explanatory variable x and fitting for the response variable "y" a function of the form: y = a•xb, where a, b are constants. The function is based on the linear regression of x and y, with both axes scaled logarithmically. Also known as log-log regression.
- printed circuit
- An electrical device in which the wiring and certain components consist of a thin coat of electrically conductive material applied in a pattern on an insulating substrate.
- resistivity
- A property that quantifies how strongly a given material opposes the flow of electric current.
- significance level
- A criterion for judging a decision regarding a null hypothesis. The criterion is based on the probability of obtaining a statistic measured in a sample if the value stated in the null hypothesis were true. The criterion or level of significance is typically set at 5%. When the probability of obtaining the sample mean is less than 5%, assuming the null hypothesis H0 is true, then the evidence does not support the null hypothesis, and this is rejected (but not taken as false), and consequently the alternate hypothesis is accepted (but not taken as true).
- simple random sample
- An unbiased representation of a group; a subset of a statistical population in which each member of the subset has an equal probability of being chosen.
- simulation
- In science and engineering, the representation of the behavior or characteristics of a physical system through the use of another system, usually a computer running programs based on a mathematical representation of the physical system.
- standard deviation
- A numerical value used to indicate how widely individuals in a group vary.
- statistical analysis
- The mathematics of the collection, organization and interpretation of numerical data, in accordance with probability theory and the application of methods such as hypothesis testing to them.
- strain
- The relative change in shape or size of an object due to externally applied forces (strain is dimensionless): change in length/original length (dL/L).
- stress
- The force per unit area applied to an object.
- type i error
- The probability of rejecting a null hypothesis that is actually true. The largest probability of committing a type I error is the significance level value.
- type ii error
- The probability of retaining a null hypothesis that is actually false.
- ultraviolet light
- A type of electromagnetic radiation with wavelengths shorter than visible light but longer than x-rays; in the range 0.4 × 10⁻⁶ and 1 × 10⁻⁸ meters.
- wavelength
- The distance between two points of the same phase in consecutive cycles of a wave. The distance between one peak or crest of a wave and the next peak or crest.
Pre-Activity Assessment
Statistical Inference/Hypothesis Testing Pre-Test: Administer the Pre-Activity Test (PDF) as a way to gauge students' base knowledge and review concepts of hypothesis testing of dependent and independent samples.
Activity Embedded Assessment
Partial Data Graphing and Analysis: Students make graphs of the measured circuits' dimension changes. Make sure students include all data, important values and quantities used in the statistical analysis.
Post-Activity Assessment
Project Report: Teams each prepare a summary activity written report, referring to the Project Rubric (PDF) for guidance. Report content includes: measurement procedure, collected measurement data, measurement graphs, statistical analyses, correlations and conclusions. Review student reports against the rubric to assess student comprehension and competence in the activity subject matter.
Project Results Presentation: Teams create either slide shows or videos that include project background, development, obtained results and corresponding statistical analyses, as detailed in the Project Rubric (PDF). For slide shows, students make in-person presentations of their results. Give teams each 10 minutes to make the presentation to the class, plus a few extra minutes for Q&A sessions. Review team presentations against the rubric to assess student mastery of the concepts.
Because of the complexity of this activity and the necessity to understand many little details in order to teach it and support students, you are welcome to request assistance from the author, Miguel R. Ramirez, at mramirez2@galenaparkisd.com.
For students with good Excel® skills (that is, they know how to use formulas), challenge them to obtain the scale factor by themselves using the GeoGebra spreadsheet to write the corresponding equation to transform the on-screen units into real-world circuit units, perform the necessary computations and record their measurements.
During the Introduction/Motivation, show students the following 3:39-minute video: Monitor Your Health with Electronic Skin about existing and future flexible circuitry technology applications at: https://www.youtube.com/watch?v=iaRhuWRSBao.
Additional suggestions for resources to show students during the Introduction/Motivation:
- Super Thin and Flexible Circuits Clear the Way for Truly Wearable Computers article with photographs at: http://www.businessinsider.com/flexible-thin-electronics-breakthrough-2013-7
- Imperceptible Electronics video (3:07 minutes): https://www.youtube.com/watch?v=k7-Hs7e3t5Q
- Biostamp Temporary Tattoo Electronic Circuits by MC 10 article with photographs at: http://www.dezeen.com/2013/03/28/biostamp-temporary-tattoo-wearable-electronic-circuits-john-rogers-mc10/
- [Wearable] MC10s Stretchable Circuits – Tiny Computers for Your Skin article with photographs at http://nxtinsight.com/wearable-mc10s-stretchable-circuits-tiny-computers-skin/
GeoGebra channel at YouTube: https://www.youtube.com/user/GeoGebraChannel
GeoGebra website at https://www.geogebra.org/
Free tutorials and materials related to this lesson/activity set may be found at Sophia Learning at http://www.sophia.org/. Tutorial topics include Excel® statistical functions and graphing data, GeoGebra basics, photolithography, wearable electronics, nanotechnology, statistics (hypothesis testing and linear correlation), and logarithmic and exponential functions. Access requires students to set up user accounts.
Bell, Stephanie. A Beginner's Guide to Uncertainty of Measurement. Published August 1999. Measurement Good Practice Guide No. 11, Issue 2, National Physical Laboratory, Teddington, Middlesex, UK, 2001. Accessed July 2014. (41-page PDF) https://www.wmo.int/pages/prog/gcos/documents/gruanmanuals/UK_NPL/mgpg11.pdf
Benson, Harris. University Physics. San Francisco, CA: John Wiley & Sons, 1995.
Brase-Brase. Understandable Statistics 8th Edition, Boston, MA: Houghton Mifflin, 2006.
GeoGebra freeware geometry software. Last updated spring 2014. International GeoGebra Institute. Accessed June 22, 2014. (a graphic calculator for geometry, algebra, calculus, statistics and 3D math) http://www.geogebra.org/cms/en/
Hamselou, Jessica. Electronic "Tattoos" to Monitor Vital Signs. Published August 11, 2011. Daily News, New Scientist. Accessed July 2014. http://www.newscientist.com/article/dn20787-electronic-tattoos-to-monitor-vital-signs.html#.VWkU29JViko
How to Find the Power of a Statistical Test. Last updated January 2014. Stat Trek (Teach yourself statistics). Accessed July 1, 2014. http://stattrek.com/hypothesis-test/statistical-power.aspx
Klein, Stacy S. and Alene H. Harris. (2007) "A User's Guide to the Legacy Cycle." Journal of Education and Human Development. Volume 1, Issue 1, ISSN 1934-7200. Accessed July 2014. http://www.scientificjournals.org/journals2007/articles/1088.pdf
Macleod, Peter. (June 2002) A Review of Flexible Circuit Technology and Its Applications. Prime Faraday Technology Watch, PRIME Faraday Partnership, Pera Knowledge, Wolfson School of Mechanical and Manufacturing Engineering, Loughborough University, Loughborough, Leics, UK. ISBN1-84402-023-1. Accessed July 2014. http://www.lboro.ac.uk/microsites/mechman/research/ipm-ktn/pdf/Technology_review/flexible-circuit-technology-and-its-applications.pdf
Welsh, Jennifer. Electronic Tattoo Monitors Brain, Heart and Muscles. Published January 30, 2012. Livescience. Accessed June 2014. http://www.livescience.com/18208-electronic-tattoo-brain-heart.html
Willis, Mike. Propagation Tutorial. Last updated December 26, 2006. Propagation via Diffraction. Accessed June 24, 2014. http://www.mike-willis.com/Tutorial/diffraction.htm
- Statistical Analysis of Flexible Circuits
- Applying Statistics to Nano-Circuit Dimensions in Fabrication
AP Statistics topics and timing note: This activity and its associated lesson are intended to be taught during the last six weeks of the school year to address some of the last topics covered in the AP Statistics course: hypothesis testing and linear correlation. The time span recommended for this lesson AND its associated activity is three weeks (second semester, last three weeks); if students are unfamiliar with GeoGebra or Excel®, provide additional class periods to complete the activity. Use the grades that students obtain in the activity as their six-week test grades and the project results presentations as their final test grades.
Contributors
Miguel R. Ramirez; Cunjiang Yu; Minwei Xu; Song Chen
Supporting Program
National Science Foundation GK-12 and Research Experience for Teachers (RET) Programs, University of Houston
Acknowledgements
This digital library content was developed by the University of Houston's College of Engineering under National Science Foundation GK-12 grant number DGE-0840889. However, these contents do not necessarily represent the policies of the NSF and you should not assume endorsement by the federal government.
The authors also thank RET program director Fritz Claydon, RET academic advisors Stuart Long and Debora Rodrigues, RET advisors Mila Taylor and Marjorie Hernandez, as well as the National Science Foundation for its funding of the RET program.
Special thanks to the Wearable Electronics Laboratory (Flexible/Stretchable Electronics) of the Mechanical Engineering Department at the University of Houston's Cullen College of Engineering, and the Lithography Lab in the Texas Center for Superconductivity at the University of Houston Applied Research Hub in the Energy Research Park.
Copyright
2015 by Regents of the University of Colorado; original © 2015 University of Houston