
Topographic Maps and Ratios: A Study of Denali
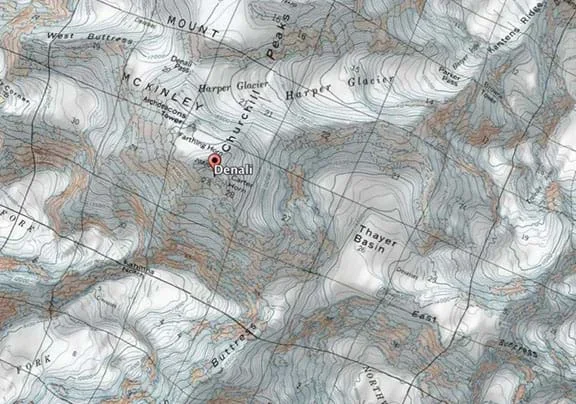 Topographic maps offer many uses and engineers must know how to navigate them. This Google Earth image shows a topographic map with satellite imagery of Denali, a peak in Alaska.Copyright 2017 Jake Schell, University of Wyoming
Students overlay USGS topographic maps into Google Earth’s satellite imagery. By analyzing Denali, a mountain in Alaska, they discover how to use map scales as ratios to navigate maps, and use rates to make sense of contour lines and elevation changes in an integrated GIS software program. Students also problem solve to find potential pathways up a mountain by calculating gradients.
Engineers use ratios, rates and GIS with great frequency and must be able to work with them in various forms. Often, engineers combine physical documents with technology to make the data easier to understand and manipulate. In addition, technology helps engineers increase efficiency and problem solve while simultaneously globalizing businesses and services. The concept of slope or gradient is ubiquitous in mathematics and applies to all STEM fields. For example, when designing a road in mountainous terrain, civil engineers analyze slope to make the road passable while considering costs, while environmental engineers simultaneously assess the slope and terrain type above and below the road for safety purposes.
After this activity, students should be able to:
- Compute unit rates of contour lines.
- Use rates to understand the growth of mountains.
- Determine whether contour lines are proportional.
- Calculate a grade (gradient/slope).
- CCSS.Math.Content.6.RP.A.1 Understand the concept of a ratio and use ratio language to describe a ratio relationship between two quantities.
Grade 6
Do you agree with this alignment? - CCSS.Math.Content.6.RP.A.2 Understand the concept of a unit rate a/b associated with a ratio a:b with b ≠ 0, and use rate language in the context of a ratio relationship.
Grade 6
Do you agree with this alignment? - CCSS.Math.Content.6.RP.A.3 Use ratio and rate reasoning to solve real-world and mathematical problems, e.g., by reasoning about tables of equivalent ratios, tape diagrams, double number line diagrams, or equations.
Grade 6
Do you agree with this alignment? - CCSS.Math.Content.6.RP.A.3d Use ratio reasoning to convert measurement units; manipulate and transform units appropriately when multiplying or dividing quantities.
Grade 6
Do you agree with this alignment? - CCSS.Math.Content.6.SP.B.5b Describing the nature of the attribute under investigation, including how it was measured and its units of measurement.
Grade 6
Do you agree with this alignment? - CCSS.Math.Content.7.EE.B.3 Solve multi-step real-life and mathematical problems posed with positive and negative rational numbers in any form (whole numbers, fractions, and decimals), using tools strategically. Apply properties of operations to calculate with numbers in any form; convert between forms as appropriate; and assess the reasonableness of answers using mental computation and estimation strategies.
Grade 7
Do you agree with this alignment? - CCSS.Math.Content.7.NS.A.3 Solve real-world and mathematical problems involving the four operations with rational numbers.
Grade 7
Do you agree with this alignment? - CCSS.Math.Content.7.RP.A Analyze proportional relationships and use them to solve real-world and mathematical problems.
Grade 7
Do you agree with this alignment? - CCSS.Math.Content.7.RP.A.1 Compute unit rates associated with ratios of fractions, including ratios of lengths, areas and other quantities measured in like or different units.
Grade 7
Do you agree with this alignment? - CCSS.Math.Content.7.RP.A.2a Decide whether two quantities are in a proportional relationship, e.g., by testing for equivalent ratios in a table or graphing on a coordinate plane and observing whether the graph is a straight line through the origin.
Grade 7
Do you agree with this alignment? - CCSS.Math.Content.7.RP.A.2b Identify the constant of proportionality (unit rate) in tables, graphs, equations, diagrams, and verbal descriptions of proportional relationships.
Grade 7
Do you agree with this alignment? - CCSS.Math.Practice.MP5 Use appropriate tools strategically.
Grades K-12
Do you agree with this alignment?
- STEL-1J Develop innovative products and systems that solve problems and extend capabilities based on individual or collective needs and wants.
Grades 6-8
Do you agree with this alignment? - STEL-3E Analyze how different technological systems often interact with economic, environmental, and social systems.
Grades 6-8
Do you agree with this alignment? - STEL-3F Apply a product, system, or process developed for one setting to another setting.
Grades 6-8
Do you agree with this alignment?
- MS-ESS2-2 Construct an explanation based on evidence for how geoscience processes have changed Earth's surface at varying time and spatial scales.
Grades 6-8
This resource focuses on the following Three Dimensional Learning aspects of NGSS:
Science & Engineering Practices- Construct a scientific explanation based on valid and reliable evidence obtained from sources (including the students' own experiments) and the assumption that theories and laws that describe the natural world operate today as they did in the past and will continue to do so in the future.Do you agree with this alignment?
Disciplinary Core Ideas- The planet's systems interact over scales that range from microscopic to global in size, and they operate over fractions of a second to billions of years. These interactions have shaped Earth's history and will determine its future.Do you agree with this alignment?
- Water's movements—both on the land and underground—cause weathering and erosion, which change the land's surface features and create underground formations.Do you agree with this alignment?
Crosscutting Concepts- Time, space, and energy phenomena can be observed at various scales using models to study systems that are too large or too small.Do you agree with this alignment?
Do you agree with this alignment? - Construct a scientific explanation based on valid and reliable evidence obtained from sources (including the students' own experiments) and the assumption that theories and laws that describe the natural world operate today as they did in the past and will continue to do so in the future.
- CCSS.Math.Content.6.RP.A.1 Understand the concept of a ratio and use ratio language to describe a ratio relationship between two quantities.
Grade 6
Do you agree with this alignment? - CCSS.Math.Content.6.RP.A.2 Understand the concept of a unit rate a/b associated with a ratio a:b with b ≠ 0, and use rate language in the context of a ratio relationship.
Grade 6
Do you agree with this alignment? - CCSS.Math.Content.6.RP.A.3 Use ratio and rate reasoning to solve real-world and mathematical problems, e.g., by reasoning about tables of equivalent ratios, tape diagrams, double number line diagrams, or equations.
Grade 6
Do you agree with this alignment? - CCSS.Math.Content.6.RP.A.3d Use ratio reasoning to convert measurement units; manipulate and transform units appropriately when multiplying or dividing quantities.
Grade 6
Do you agree with this alignment? - CCSS.Math.Content.6.SP.B.5b Describing the nature of the attribute under investigation, including how it was measured and its units of measurement.
Grade 6
Do you agree with this alignment? - CCSS.Math.Content.7.EE.B.3 Solve multi-step real-life and mathematical problems posed with positive and negative rational numbers in any form (whole numbers, fractions, and decimals), using tools strategically. Apply properties of operations to calculate with numbers in any form; convert between forms as appropriate; and assess the reasonableness of answers using mental computation and estimation strategies.
Grade 7
Do you agree with this alignment? - CCSS.Math.Content.7.NS.A Apply and extend previous understandings of operations with fractions to add, subtract, multiply, and divide rational numbers.
Grade 7
Do you agree with this alignment? - CCSS.Math.Content.7.NS.A.3 Solve real-world and mathematical problems involving the four operations with rational numbers.
Grade 7
Do you agree with this alignment? - CCSS.Math.Content.7.RP.A Analyze proportional relationships and use them to solve real-world and mathematical problems.
Grade 7
Do you agree with this alignment? - CCSS.Math.Content.7.RP.A.2a Decide whether two quantities are in a proportional relationship, e.g., by testing for equivalent ratios in a table or graphing on a coordinate plane and observing whether the graph is a straight line through the origin.
Grade 7
Do you agree with this alignment? - CCSS.Math.Content.7.RP.A.2b Identify the constant of proportionality (unit rate) in tables, graphs, equations, diagrams, and verbal descriptions of proportional relationships.
Grade 7
Do you agree with this alignment? - CCSS.Math.Practice.MP5 Use appropriate tools strategically.
Grades K-12
Do you agree with this alignment?
- MS-ESS2-2 Construct an explanation based on evidence for how geoscience processes have changed Earth's surface at varying time and spatial scales.
Grades 6-8
Do you agree with this alignment?
Each group needs:
- a computer with Google Earth installed; alternatively, download the software as an app on an iPad or other tablet
- USGS Keyhole Markup Language (KMZ) zipped data file for Google Earth; see “View In” at the top of the page and click Google Earth
- ruler
- Student Activity Sheet (PDF), one per student
Students should be familiar with ratios, rates, and proportional relationships, and be able to convert from fractions to percentages.
Consider what it takes to construct an aerial tram up the side of a mountain. What does it take to plan, design, integrate, and execute such a monumental feat of engineering? (Listen to student ideas.)
Construction of any infrastructure requires the collaboration of a variety of engineers, especially if, for example, they are working on something like an aerial tramway in a steep, rocky area like Jackson Hole, Wyoming. (To engage students in the challenge, show them the video on the construction of the Jackson Hole Aerial Tram.)
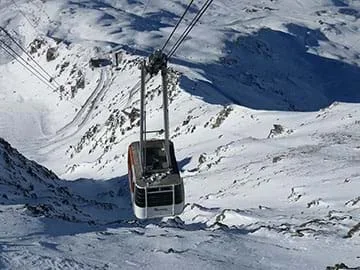 All over the world, aerial tramways are used for people to travel up steep peaks. What would you need to know if you were an engineer tasked with building one to take you to the top of Denali?Copyright 2015 Akiry, Wikimedia Commons CC BY-SA 4.0
https://commons.wikimedia.org/wiki/File:Les_Arcs_-_telepherique_aiguille_rouge.jpg
All over the world, aerial tramways are used for people to travel up steep peaks. What would you need to know if you were an engineer tasked with building one to take you to the top of Denali?Copyright 2015 Akiry, Wikimedia Commons CC BY-SA 4.0
https://commons.wikimedia.org/wiki/File:Les_Arcs_-_telepherique_aiguille_rouge.jpg
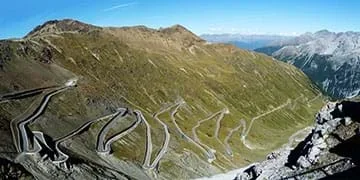 Steep passes are an impressive engineering feat. What kinds of problems would an engineer need to solve to build a pass like this one in southern France?Copyright 2012 xuuxuu, Pixabay, public domain https://pixabay.com/p-69363/?no_redirect
In order to think like an engineer and to wrap our minds around some of the phenomenal civil engineering that happens every day, we are going to use Google Earth along with some digital maps from the U.S. States Geological Survey to think about steepness and size of features on earth such as mountains. Think about our aerial tram example, and then imagine yourself driving over a mountain or a mountain pass. What kinds of engineering was required to design that road? How would people know where to build or where the easiest path lies? When you plan a trip and use a map to navigate, how do you know the distance between two points on the map? Have you ever seen two maps of the same area and compared the detail that goes into each map?
Part 2: In this image, the lines crossing the landscape are called “contour lines” and show surfaces of the earth that all lie at the same elevation, or distance above sea level. Lines above a given contour represent higher elevations and lines below represent lower elevations. Based on this concept, would you expect steeper parts of the mountain to have lines spaced closer together or further apart? Why?
(Show Google Earth image with a topographic map overlay, either from the top of this document or an electronic device.)
(Have students discuss the question in groups and share with the class. Expect students to figure out that steeper parts of the mountain have contour lines that are spaced closer together. Next, review what students will be doing in the activity by going over the Student Activity Sheet (PDF).)
In this activity, you will be taking on the role of engineers who need to build a tram up Denali, the highest peak in North America at 6,190 m (20,310 ft) above sea level. What would your main engineering challenges look like? How would you start problem solving for solutions? What kind of information would you need to know about the region in order to build a tramway there?
As the engineers, you will analyze the steepness of Denali using satellite imagery and contour maps. You need to use ratio and proportional reasoning skills to calculate slope (steepness) and analyze elevation. As you work through the activity, be thinking about everything you do from the lens of an engineer. Use your calculations throughout the activity to suggest a location for the tram based on the mountain topography. To summarize the engineering challenge:
- First, familiarize yourself with Google Earth and set up the maps. Real-world engineers have more sophisticated software, but we can do a lot with free programs!
- Next, calculate and analyze how scale affects what we see on the map. As you work through the activity, consider how scale is important to engineers.
- Next, calculate gradients (slope) and determine the unit rate of each contour line interval.
- Then use your newfound knowledge to analyze the ascent of two climbing groups, taking into account their locations and the topography they need to traverse to get to the top. Think about how this relates to your challenge to design the tramway route.
- Next, use unit rates to think about how the mountain grows over time. This is the work that a geologist might undertake, but is also important information for engineers.
- Finally, draw the path that you recommend the tram take up the mountain, and explain why you chose that route. Make sure to print the screen with the map showing your tram’s route. Either draw the route by hand or use the path tool in Google Earth.
Background
Review the following concepts with students. Depending on your students' base understanding of these terms, you may want to spend more or less time here. Provide students with their handouts and display Google Earth to the class for reference.
Ratio: A comparison of two of more numbers. Can be shown as a:b, a to b, or a/b. The value of a ratio is the number we get when we divide a by b.
Proportion/proportional relationship: A relationship or equation showing that two or more ratios are equivalent, or have the same value. All of the following ratios are equivalent (equal to 0.5 as a decimal), so the relationship between them is proportional. Example: 1/2 = 2/4 = 5/10.
Scale: A scale is simply a ratio (typically shown as 1:x) describing a proportional relationship between the dimensions of an actual object and some model representation of the object. Typically, we write the ratio as model:actual. On a map of the United States, you may see a scale such as 1 in: 300 mi. This means that each inch on the map represents 300 miles on the surface of the earth.
Refer to Part 2 of Student Activity Sheet (PDF) called “Determining Scale,” for information about scale as it pertains to Google Earth. Google Earth, like all maps, uses scale to represent distances in real life as distances on the map. Different maps have different scales. Google Earth gives its scale in the form of a bar on the lower left of the screen. (You can display this bar in Google Earth settings.) The scale changes when you move the screen around, or when you zoom. Write scale as a ratio comparing the map distance to the real-world distance.
Note that scale does not have units because the units cancel out when written as a fraction. This scale works because it uses the same units on the map as in real life. If the scale is 1:4, then 1 inch on the map equals 4 inches in real life and 1 centimeter on the map equals 4 centimeters in real life. For this activity, do not include units in your scale.
Rate: A rate is a ratio comparing quantities with different units. We often use the word “per” instead of “to” when describing rates. For example, “1 inch per 300 miles on this map” or “300 miles per inch.”
Contour Lines: Refer to Part 3 of Student Activity Sheet (PDF), “Contour Lines and Gradient (Slope).” Topography maps enable users to determine elevation, which means the vertical distance a point is above sea level, and is represented by the small numbers on the lines in the map called contour lines. Using unit rates enables users to learn the elevation change between each line. Unit rates are determined by division, with the small numbers representing elevation in feet above sea level.
Slope: A slope is the value of the ratio of the vertical change to the horizontal change of two quantities. Slope coincides with the steepness of the mountain between any two points on the map, and can be shown as a fraction or decimal equivalent. A slope of 4/5 means that for every 4 meters of elevation you go up the mountain, you are moving horizontally 5 meters.
Grade (or Gradient): This is the equivalent percentage of a given slope. If the slope between two points on the mountain is 4/5, the decimal equivalent is 0.8. To convert between a decimal and a percentage, multiply by 100, so the gradient is 80%. The steepest mountain passes for vehicles are typically around 10%.
Before the Activity
Familiarize yourself with the Google Earth GIS platform and experience the USGS topographic map enhancement feature with the KMZ file. Display data in Google Earth in metric units from the view panel in the top of the screen. Click “Google Earth” (labeled as “Google Earth Pro” in the Figure 1), click preferences, and choose meters, kilometers under “Units of Measurement.” Secure electronic devices with internet connections and make copies of the Student Activity Sheet, one per student.
Determine whether students need to download Google Earth onto the devices they will be using. Determine whether the devices already have the software or if students will be able to download the software they need (many downloads are password protected).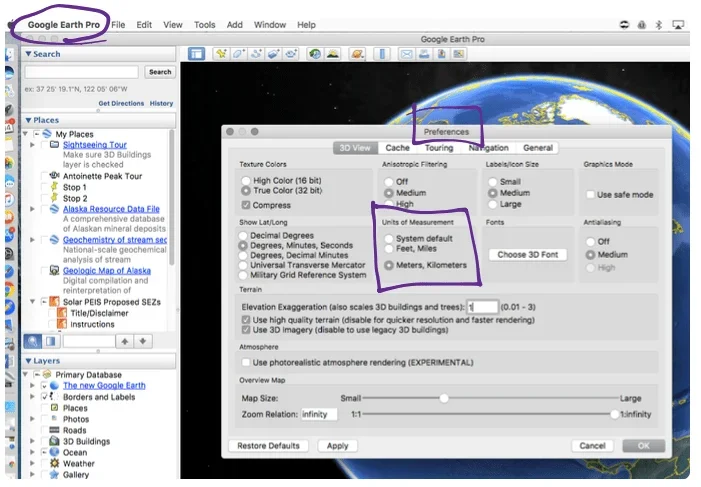 Figure 1. How to change the units of measurement to metric in Google Earth.Copyright 2017 Jake Schell, University of Wyoming
With the Students
- Divide the class into groups of two or three students each; paris are preferable but the number of devices available may dictate the group size.
- Hand out the Student Activity Sheet (PDF) to each student and a ruler to each group.
- Have students download the KMZ file NGS Topo 2d from https://www.arcgis.com/home/item.html?id=d591ee08318e4d4389ed7beaa9cd7e87.
- Have students open the site and click Google Earth under the heading “View In” at the very top of the page. Then a KMZ file begins to download.
- Once the KMZ file is downloaded, expect it to load in Google Earth. If not, look for a pane on the left-hand side of the program called “Places.” This enables you to toggle the new file on and off with a checkmark. When the file downloads, it may be located under the tab “Temporary Places.” See Figure 2.
- Have students set Google Earth to display information in metric units (kilometers) and show the scale bar. To set this preference, click on the Google Earth heading (shown as Google Earth Pro in Figure 1) and then click on Preferences. From within the preferences dialogue box, set the units to kilometers. To show the scale bar, click on “View” the top pane and make sure a checkmark is placed at “Scale Legend.”
- Familiarize students with maneuvering through Google Earth by discussing the first section of the Student Activity Sheet (PDF) as a class and work through the rest of the activity as a class.
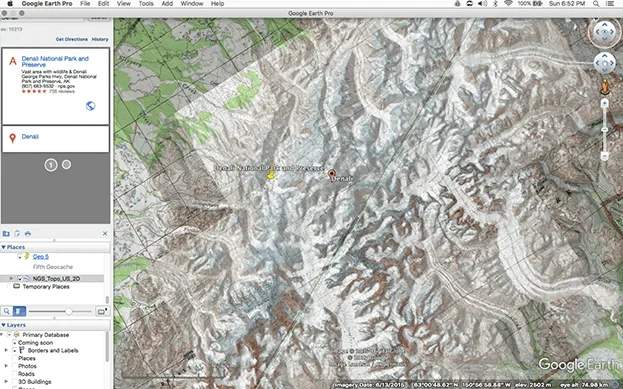 Figure 2. Make sure the checkmark next to the file NGS_Topo_US_2D is marked for the file to load. It may be located under Temporary Places on your device.Copyright 2017 Jake Schell, University of Wyoming
- contour lines
- Lines on a topography map that designate areas that have the same elevation, or vertical distance above sea level. Different maps have different unit rates per contour line, such as 200 m between each contour line.
- geographic information system
- A way to store, edit, and manipulate data or information, usually using maps; commonly referred to as GIS.
- grade
- The equivalent percent of a given slope.
- rate
- Ratio that compares numbers with different units, such as miles per hour.
- ratio
- Comparison of two or more numbers, commonly written as a fraction. Ratios can be written in three ways: a to b, a/b, or a:b.
- scale
- Ratio (typically shown as 1:x) describing a proportional relationship between the dimensions of an actual object and some model representation of the object.
- slope
- Value of the ratio when comparing the vertical change to the horizontal change of two quantities. Slope coincides with the steepness of the mountain between any two points on the map, and can be shown as a fraction or decimal equivalent.
- topography map
- Sometimes referred to as a “topo” map; shows different elevations, or relief, by way of contour lines or other means. These maps may also show significant geographic points such as roads, peaks, and rivers.
Pre-Activity Assessment
Discussion Questions: Take note of responses to the discussion questions in the introduction, which could suggest complementary student grouping.
Activity Embedded Assessment
Activity Sheet: Have students complete the Student Activity Sheet (PDF). Grade the work either by group or individually.
Post-Activity Assessment
Reflection Questions: Ask students the following questions:
- What did you learn in the activity about engineering as it relates to using topographic maps and contour lines?
- In what situations would engineers building a tram want to use a large-scale map (more detail) and in what situations would they want to use a smaller scale (see less detail)?
- What, if anything, is different about the engineers’ route up the mountain from those of the climbers? How does this relate to slope?
- Besides slop, what other factors might engineers consider that would influence tram placement?
- If the USGS topographic map overlay file is not displaying in Google Earth, try double clicking on it in the “Places” pane on the left-hand side of the screen. This causes it to zoom out and load the file. From here, you may need to locate Alaska and slowly zoom in on it and locate Denali manually instead of zooming in on it from the search tool. As you slowly zoom in, stop frequently to let the topo map overlay load before zooming in further.
- If the map overlay is not displaying the “Places” pane, manually click and drag the file from the save location into Google Earth. Release the mouse over the map portion of the program.
Emphasize the connections of this activity to engineering, a variety of extensions are possible. Consider the following ideas: Different groups could be assigned to take on the role of different types of engineers to put forth more effort into the tram (or road) design in a rocky, mountainous area. Instead of just using this idea as an opening or short write-up as seen in Part 5 of the activity sheet, consider spending a few days doing more research on real-world engineering feats and have students problem solve. They could create a model of a mountain pass for a railway or tramway with different groups researching the different engineering aspects of the project.
- For lower grades, modify the ratios to involve fewer unit conversions.
- For higher grades, focus more on slope. You could potentially have students graph a cross-section of various portions of the mountain to get an idea of the different slopes of the peak, perhaps following popular climbing routes.
- GIS, Mathematics and Engineering Integration
- Geometry and Geocaching Using GIS & GPS
- Topographic Maps and Ratios: A Study of Denali
Contributors
Jake Schell; Andrea Burrows
Supporting Program
University of Wyoming
Acknowledgements
This digital library curriculum was developed under the guidance of Andrea Burrows, Linda Hutchinson, and Michele Chamberlin at the University of Wyoming.
Copyright
2018 by Regents of the University of Colorado; original © 2017 University of Wyoming