
Shielding from Cosmic Radiation: Part 3 - Post-Launch Analysis
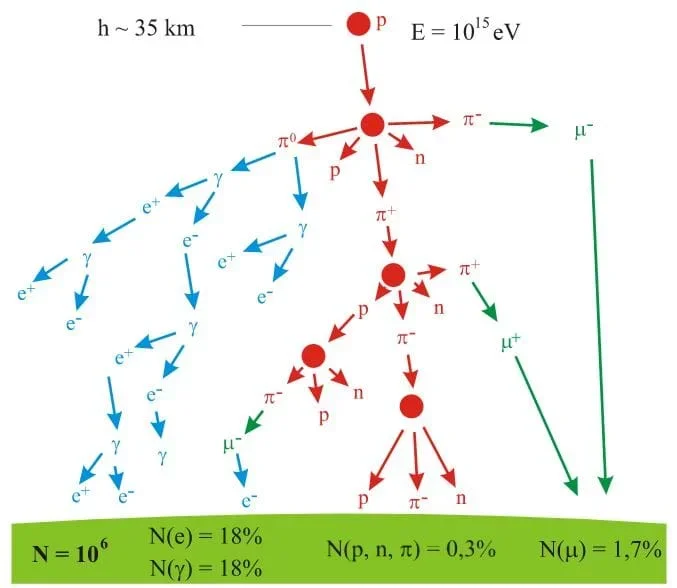 Cosmic rays interact with atoms in the atmosphere to formCopyright 2008 Mpfiz (CC BY 3.0), Wikimedia Commons, https://en.wikipedia.org/wiki/Air_shower_%28physics%29#/media/File:AirShower.svg
In this wrap-up activity, students analyze their findings from their launch! (Alternatively, they can independently analyze data sets without launching a balloon.) Students examine the radiation data collected from a balloon launched into near space to see if cosmic radiation shielding designs worked. Students explain their findings, which might require some research to show if this observation is correct and why. Finally, students make a comparison of the shielded and unshielded, control Geiger counters and analyze the results.
Engineers need to analyze data and formulate a plan for optimizing equipment. Likewise, students in this project analyze the data collected by the high-altitude balloon. Students discuss how to interpret data. Students communicate to their teams about the effectiveness of their radiation shield design. Finally, to complete the engineering design process, students discuss ways to improve their shielding device in the future.
After this activity, students should be able to:
- Explain the concept of radiation shielding.
- Interpret radiation data.
- Suggest ways to optimize or improve their design for future launches.
- CCSS.Math.Content.HSS-ID.B Summarize, represent, and interpret data on two categorical and quantitative variables
Grades 9-12
Do you agree with this alignment? - CCSS.Math.Content.HSS-ID.B.6 Represent data on two quantitative variables on a scatter plot, and describe how the variables are related.
Grades 9-12
Do you agree with this alignment? - CCSS.Math.Practice.MP2 Reason abstractly and quantitatively.
Grades K-12
Do you agree with this alignment? - CCSS.Math.Practice.MP4 Model with mathematics.
Grades K-12
Do you agree with this alignment? - CCSS.Math.Practice.MP5 Use appropriate tools strategically.
Grades K-12
Do you agree with this alignment?
- Use computers and calculators to access, retrieve, organize, process, maintain, interpret, and evaluate data and information in order to communicate.
Grades 9-12
Do you agree with this alignment? - STEL-2T Demonstrate the use of conceptual, graphical, virtual, mathematical, and physical modeling to identify conflicting considerations before the entire system is developed and to aid in design decision making.
Grades 9-12
Do you agree with this alignment? - STEL-8N Use various approaches to communicate processes and procedures for using, maintaining, and assessing technological products and systems.
Grades 9-12
Do you agree with this alignment? - STEL-8Q Synthesize data and analyze trends to make decisions about technological products, systems, or processes.
Grades 9-12
Do you agree with this alignment?
- HS-ETS1-3 Evaluate a solution to a complex real-world problem based on prioritized criteria and trade-offs that account for a range of constraints, including cost, safety, reliability, and aesthetics, as well as possible social, cultural, and environmental impacts.
Grades 9-12
This resource focuses on the following Three Dimensional Learning aspects of NGSS:
Science & Engineering Practices- Evaluate a solution to a complex real-world problem, based on scientific knowledge, student-generated sources of evidence, prioritized criteria, and tradeoff considerations.Do you agree with this alignment?
- Analyze data using tools, technologies, and/or models (e.g., computational, mathematical) in order to make valid and reliable scientific claims or determine an optimal design solution.Do you agree with this alignment?
- Use mathematical and/or computational representations of phenomena or design solutions to support explanations.Do you agree with this alignment?
Disciplinary Core Ideas- When evaluating solutions it is important to take into account a range of constraints including cost, safety, reliability and aesthetics and to consider social, cultural and environmental impacts.Do you agree with this alignment?
Crosscutting Concepts- New technologies can have deep impacts on society and the environment, including some that were not anticipated. Analysis of costs and benefits is a critical aspect of decisions about technology.Do you agree with this alignment?
Do you agree with this alignment? - Evaluate a solution to a complex real-world problem, based on scientific knowledge, student-generated sources of evidence, prioritized criteria, and tradeoff considerations.
- CCSS.Math.Content.HSS-ID.B Summarize, represent, and interpret data on two categorical and quantitative variables
Grades 9-12
Do you agree with this alignment? - CCSS.Math.Content.HSS-ID.B.6 Represent data on two quantitative variables on a scatter plot, and describe how the variables are related.
Grades 9-12
Do you agree with this alignment? - CCSS.Math.Practice.MP2 Reason abstractly and quantitatively.
Grades K-12
Do you agree with this alignment? - CCSS.Math.Practice.MP4 Model with mathematics.
Grades K-12
Do you agree with this alignment? - CCSS.Math.Practice.MP5 Use appropriate tools strategically.
Grades K-12
Do you agree with this alignment?
- HS-ETS1-3 Evaluate a solution to a complex real-world problem based on prioritized criteria and trade-offs that account for a range of constraints, including cost, safety, reliability, and aesthetics as well as possible social, cultural, and environmental impacts.
Grades 9-12
Do you agree with this alignment?
Each group needs:
- computer with access to the internet and equipped with Microsoft Excel
- printed copies of the following: Relative Humidity Graph (PDF), Air Pressure Graph (PDF), Wind Speed Graph (PDF), Temperature Graph (PDF), Radiation Graph (PDF), Shielded Payload Example Data (CSV), Control Payload Example Data (CSV), Post Launch Additional Resources (PDF)
For the entire class to share
- main computer with screen and projector to watch onboard video footage, if video cameras were included in the payload
- Knowledge of radiation and types of radiation (learned in the associated lesson, Shielding from Cosmic Radiation: Space Agency Scenario).
- Understand how radiation is measured.
- Identify and describe the types of materials can be used to block cosmic rays.
- Understand high-altitude ballooning and the conditions that the balloon will be exposed to (temperature, pressure, humidity changes, etc.).
- Understand how to build a payload/prototype of a device that attempts to shield radiation at high altitudes.
- Be able to graph data in an Excel spreadsheet.
It is time we looked at the data from the balloon flight! We will look at all of the data first, and then we will decide if the radiation shielding worked. Remember, the question we would like to answer by the end of our analysis is, “How well did the shields function?” We also want to look ahead by asking, “How could we improve upon the design for future flights?”
The Temperature Graph (PDF) (see Figure 1) shows a surface temperature at the time of launch, which decreases to a minimum value and then increases again to the top altitude of our flight. This data clearly shows the division of the atmosphere into a troposphere, a tropopause, and a stratosphere. Can anyone tell me how to see these layers in the data? (Answer: The low temperature is the tropopause which separates troposphere from stratosphere.)
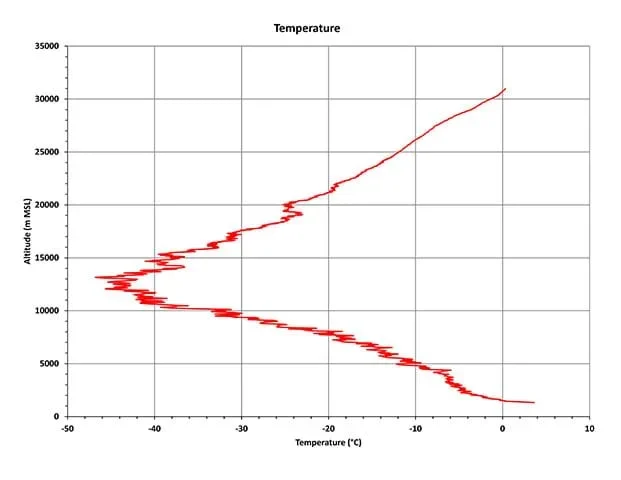 Figure 1. Surface temperature at the time of launch, which decreases to a minimum value and then increases again to the top altitude of our flight. This data clearly shows the division of the atmosphere into a troposphere, a tropopause, and a stratosphere.Copyright 2020 Wyoming NASA Space Grant Consortium, University of Wyoming, Trina KeltyThe Wind Speed Graph (PDF) (see Figure 2) simply shows a highly variable wind that increases with altitude.
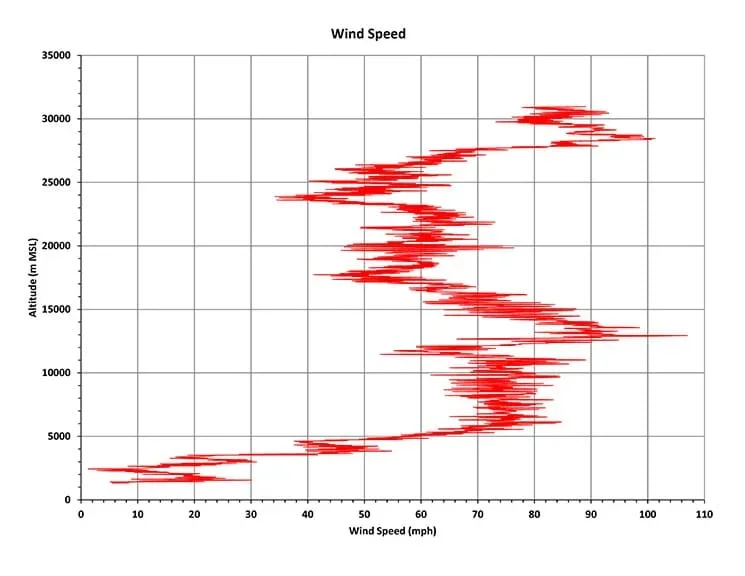 Figure 2. A highly variable wind increases with altitude.Copyright 2020 Wyoming NASA Space Grant Consortium, University of Wyoming, Trina Kelty
The Relative Humidity Graph (PDF) (see Figure 3) shows that most moisture in the atmosphere is in the tropopause. Considering this, does it make sense when scientists say that the troposphere is where weather takes place? (Answer: Yes, because weather requires water vapor.)
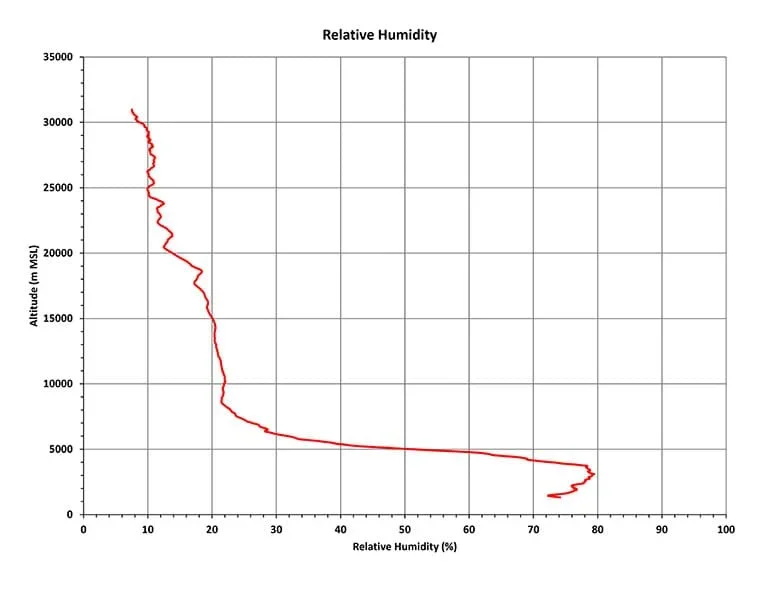 Figure 3. Most moisture in the atmosphere is in the tropopause.Copyright 2020 Wyoming NASA Space Grant Consortium, University of Wyoming, Trina KeltyThe Air Pressure Graph (PDF) (see Figure 4) shows that pressure declines with higher altitude because the density of air decreases.
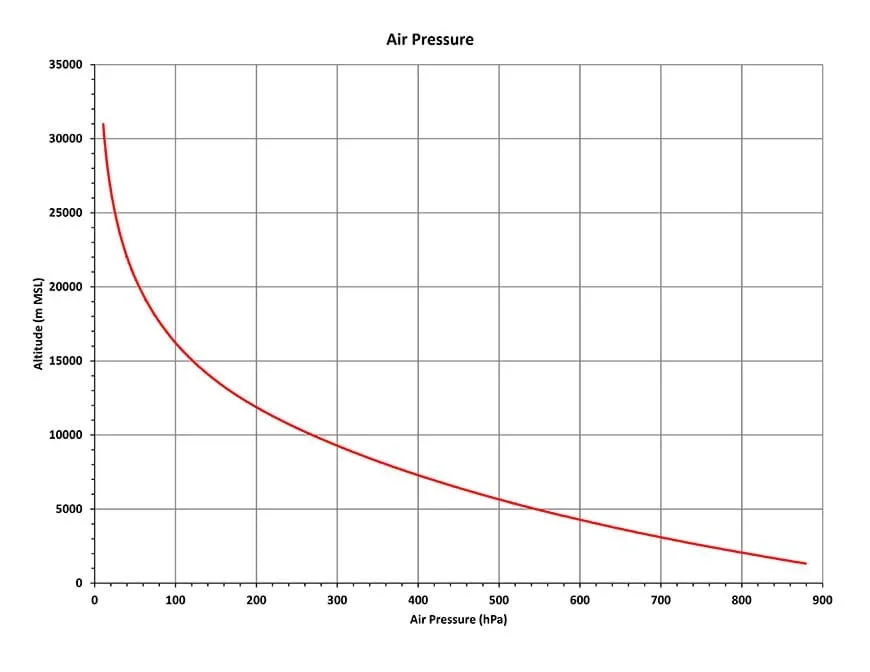 Figure 4. Pressure declines with higher altitude because the density of air decreases.Copyright 2020 Wyoming NASA Space Grant Consortium, University of Wyoming, Trina Kelty
The Radiation Graph (PDF) (see Figure 5) shows a low value near surface, which increases with height to a peak value. There is a reason why the data look like this. Can someone explain what is going on? (Answer: The “Regener-Pfotzer Maximum” at 20-25 km above sea level is a real phenomenon. It results from secondary radiation from the atmosphere.)
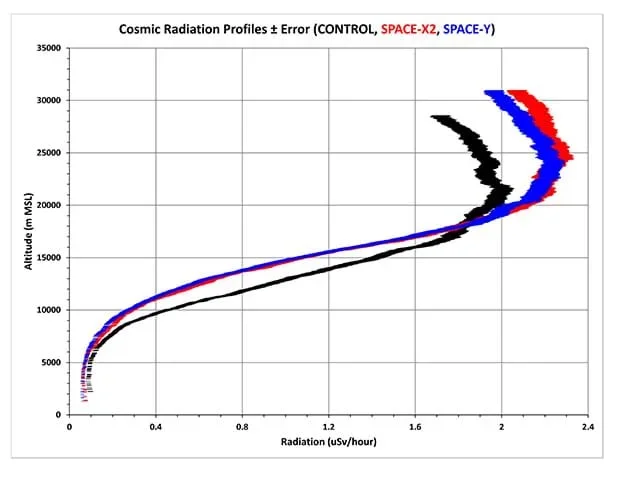 Figure 5. Radiation levels are of a low value near the surface of the Earth, but they increase with height to a peak value.Copyright 2020 Wyoming NASA Space Grant Consortium, University of Wyoming, Trina KeltyNow let‘s see how well the shield designs functioned. We can gauge the function of each shield by how much it decreased radiation compared to the control at all altitudes, but especially at high altitude. Did the designs work? (The answer depends on design.) How might we improve the design?
The example temperature data from one particular launch displays a surface temperature near 4C, decreasing to –45C at 13,000m above sea level, and then rises back to 0C at bursting altitude showing the division of the atmosphere into a troposphere, a tropopause, and a stratosphere. The wind speed graph shows a variable wind that increases with altitude. The relative humidity graph shows most moisture in the atmosphere is in the tropopause. Pressure decreases with altitude because the density of air decreases along with the height of the air column. Radiation data show a low value near surface, which increases with altitude to a peak value.
Background
(The first four questions and the video are optional; if you are only doing the data analysis, skip down to the data collection analysis.)
Let’s talk about the payload launch. To start with, what happened? [Let students offer suggestions. Answers will depend on what happened during the launch.]
What went well with the launch? [Let students offer suggestions. Potential answers: weather, air traffic, inflating the balloon, attaching payload harness, etc. Answers will depend on what happened during the launch.]
What went poorly with the launch? [Let students offer suggestions. Potential answers: weather, air traffic, inflating the balloon, attaching payload harness, etc. Answers will depend on what happened during the launch.]
How could the experience be improved? [Let students offer suggestions. Potential answers: weight of payload, weather/wind, balloon launch, etc. Answers will depend on what happened during the launch.]
(Optional) Let’s watch video footage captured by the onboard video cameras. [Play any video captured by the payload.] Now that data has been collected, it is ready to be analyzed. Let’s get to work!
In this activity students look over data their payloads collected, review the unit’s concepts and practices and provide feedback to the instructors. Students first examine all of their data, then answer the question, “how well did our shield function?” Next students examine temperature data. The example temperature data from a particular launch displays a surface temperature near 4C, decreasing to –45C at 13,000m above sea level, and then rises back to 0C at bursting altitude showing the division of the atmosphere into a troposphere, a tropopause, and a stratosphere. The wind speed graph shows a variable wind that increases with altitude. The relative humidity graph shows most moisture in the atmosphere is in the tropopause. Pressure decreases with altitude because the density of air decreases along with the height of the air column. Radiation data show a low value near surface, which increases with altitude to a peak value. Students should explain this finding, which might require some research to show if this observation is correct and why. Finally, a comparison of the shielded and unshielded, control Geiger counters show the shielding has produced more counts than the Geiger counter without shielding. The design didn’t work as intended.
Now that data has been collected, it is ready to be analyzed. The radiation data was measured and recorded on the microSD card in units of microSieverts. If data were collected correctly, the radiation measurements should increase with altitude from about 0.1 microSiverts near the ground to over 2.0 microSieverts around 20–25 km above sea level. Above this, radiation measurements should slightly decrease. The peak in radiation measurements around 20–25 km above sea level is called the “Regener-Pfotzer Maximum” and is a real phenomenon that results from secondary radiation scattering that occurs when cosmic radiation particles interact with our atmosphere. For a further explanation of secondary radiation scattering (i.e., air showers), see: https://www.mpi-hd.mpg.de/hfm/CosmicRay/Showers.html. See the Post Launch Additional Resources (PDF) for more details.
Building a radiation shield that effectively blocks both Beta particles and Gamma rays, those that are measured by the Geiger counter used here, is very challenging. You may find that the shields seem to work at lower altitudes but not at higher altitudes. In fact, at higher altitudes their shielded Geiger counters may actually measure slighter higher radiation measurements than if shields were not used at all. This can be confirmed by sending up a third payload that is unshielded to act as a control.
One explanation for this increase in radiation with the shielded Geiger counters is related to the shields themselves. If composed primarily of thin sheets of steel and/or aluminum, this may cause additional secondary scattering to take place when they are hit by cosmic rays. Since secondary scattering of cosmic ray particles results in the production of high-energy Gamma rays, which can penetrate steel and aluminum, these additional Gamma rays produced when cosmic rays interact with the shielding would be measured by the Geiger counter and account for the increased radiation measurements. Additional research needs to be done to determine if this in fact occurs, however. To effectively shield against Gamma rays, wrapping the Geiger counter in a thick sheet of lead could help block some of the Gamma rays, but this is not feasible with weight considerations in regard to space travel, high-altitude ballooning, and budgets. Other more lightweight materials do exist, such as aluminum, that have shown the ability to shield against Gamma rays and could be considered for shields. Be prepared to discuss ways that the shielding could be improved (1) without making the payload too heavy and (2) going over budget.
Before the Activity
- (Optional) Prepare any onboard video footage and have it ready to be played.
- Gather all the onboard radiation data into a comma separated value (CSV) file, which can be opened in Microsoft Excel.
- (Optional) If you collected altitude data as well, you will likely have to interpolate that data to the radiation data in order to plot the radiation data as a function of altitude. The easiest way to do that is to use the linear interpolation method described here: https://www.datadigitization.com/dagra-in-action/linear-interpolation-with-excel/.
- Prepare to split the students into smaller groups of 2-3 to work on the data analysis together.
With the Students
- Divide the students into groups of 2-3 students.
- Have the students plot these contextual plots first:
- Temperature vs. altitude
- Wind speed vs. altitude
- Pressure vs. altitude
- Relative humidity vs. altitude
- Next have the students plot the radiation data vs. altitude (radiation on x-axis, altitude on y-axis) in Microsoft Excel. They should be plotting the radiation dosage, which is in microSieverts per hour. Start with the measurements from one shielded payload, then the measurements from the other shielded payload. Finally, add in the measurements from the unshielded control payload. See Shielded Payload Example Data (CSV) and Control Payload Example Data (CSV).
Cosmic rays interact with atoms in the atmosphere to form secondary air showersCopyright 2008 Mpfiz (CC BY 3.0), Wikimedia Commons, https://en.wikipedia.org/wiki/Air_shower_%28physics%29#/media/File:AirShower.svg
- Ask the students to record their observations and note any interesting features of the plots. If using the example plots
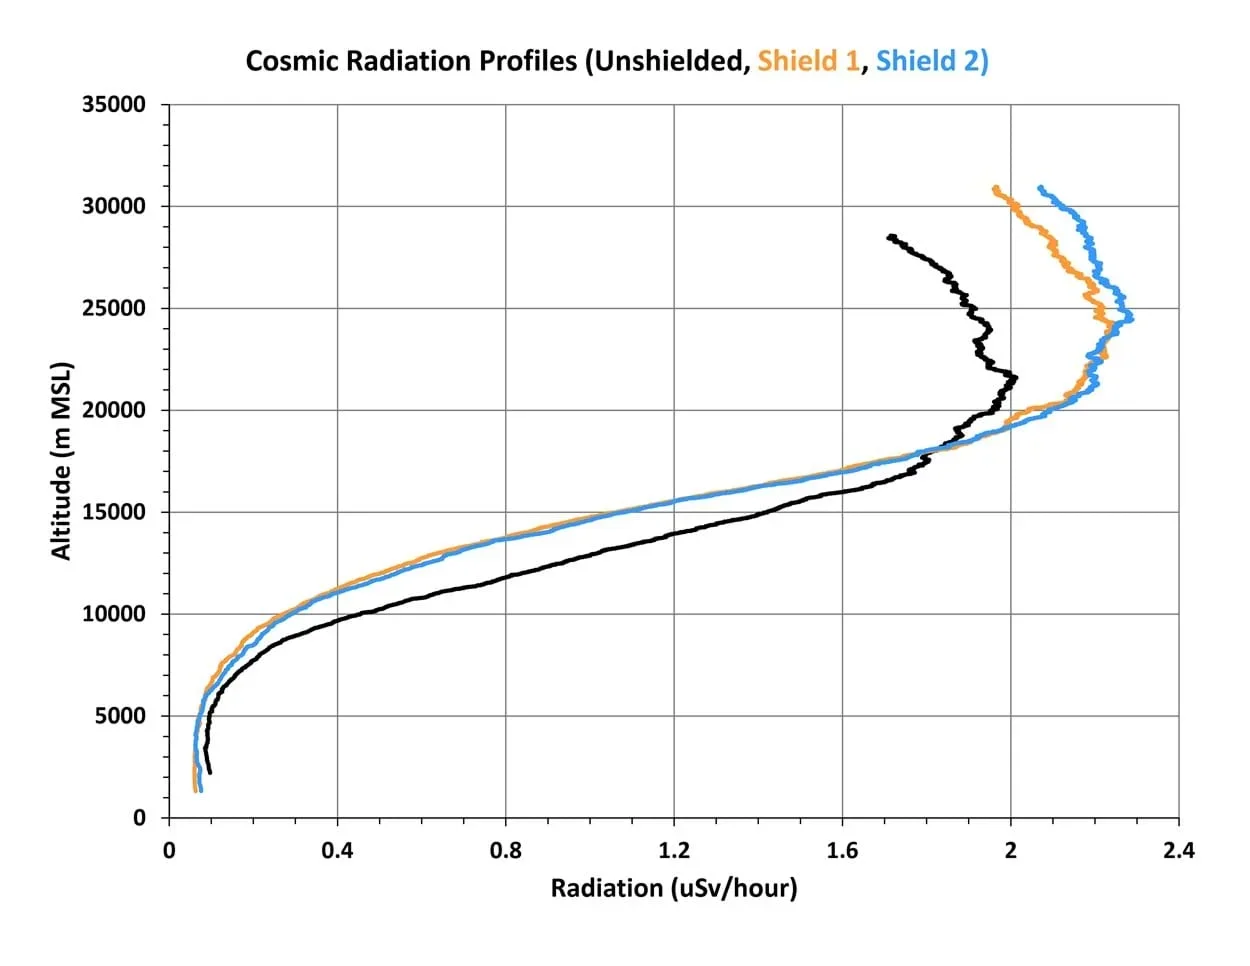 Comparison of shielded and unshielded cosmic radiation measurements as a function of altitudeCopyright 2020 Wyoming NASA Space Grant Consortium, University of Wyoming, Trina Kelty
- Temperature data. The example temperature data is from a November 2019 launch and displays a surface temperature near 4C, decreasing to –45C at 13,000 m above sea level, and then rises back to 0C at bursting altitude showing the division of the atmosphere into a troposphere, a tropopause, and a stratosphere.
- The wind speed graph shows a variable wind that increases with altitude.
- The relative humidity graph shows most moisture in the atmosphere is in the tropopause.
- The pressure graph shows that pressure decreases with altitude because the density of air decreases along with the height of the air column.
- The radiation data show a low value near surface, which increases with altitude to a peak value. [Students should explain this finding, which might require some research to show if this observation is correct and why. Finally, a comparison of the shielded and unshielded, control Geiger counters show the shielding has produced more counts than the Geiger counter without shielding. The design didn’t work as intended.]
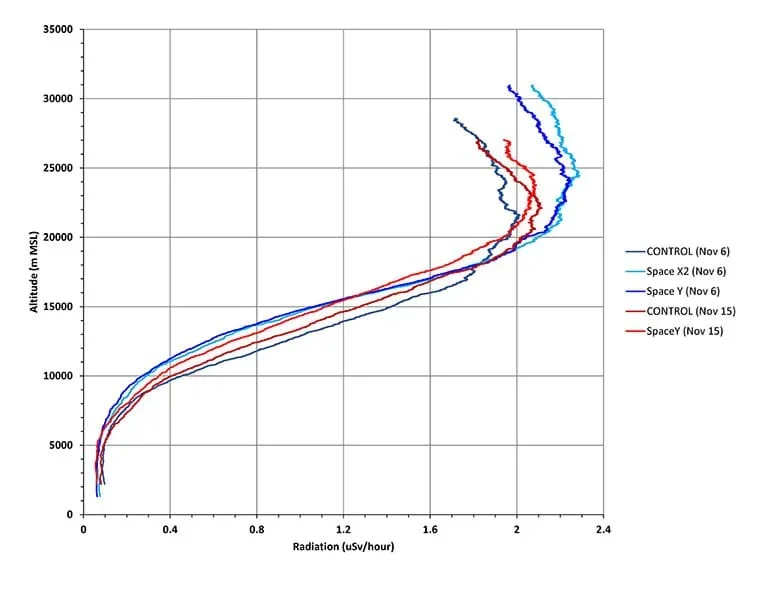 A comparison of five different balloon flights, with two controls and three variable designs.Copyright 2020 Wyoming NASA Space Grant Consortium, University of Wyoming, Trina Kelty
- As a group, discuss the student observations and questions:
- What do you see in your radiation vs. altitude data? [Answer: The radiation data was measured and recorded on the microSD card in units of microSieverts. If data were collected correctly, the radiation measurements should increase with altitude from about 0.1 microSiverts near the ground to over 2.0 microSieverts around 20–25 km above sea level. Above this, radiation measurements should slightly decrease. The peak in radiation measurements around 20–25 km above sea level is called the “Regener-Pfotzer Maximum” and is a real phenomenon that results from secondary radiation scattering that occurs when cosmic radiation particles interact with our atmosphere. For a further explanation of secondary radiation scattering (i.e., air showers), see: https://www.mpi-hd.mpg.de/hfm/CosmicRay/Showers.html.]
- How well did the radiation shield work? [Answer: The shields seem to work at lower altitudes but not at higher altitudes. In fact, at higher altitudes their shielded Geiger counters may actually measure slighter higher radiation measurements than if shields were not used at all. This can be confirmed by sending up a third payload that is unshielded to act as a control. One explanation for this increase in radiation with the shielded Geiger counters is related to the shields themselves. If composed primarily of thin sheets of steel and/or aluminum, this may cause additional secondary scattering to take place when they are hit by cosmic rays. Since secondary scattering of cosmic ray particles results in the production of high-energy Gamma rays, which can penetrate steel and aluminum, these additional Gamma rays produced when cosmic rays interact with the shielding would be measured by the Geiger counter and account for the increased radiation measurements. Additional research needs to be done to determine if this in fact occurs, however.]
- What material could effectively shield against Gamma rays? [Answer: To effectively shield against Gamma rays, wrapping the Geiger counter in a thick sheet of lead could help block some of the Gamma rays, but this is not feasible with weight considerations in regard to space travel, high-altitude ballooning, and budgets. Other more lightweight materials do exist, such as aluminum, that have shown the ability to shield against Gamma rays and could be considered for shields.]
- How could the shielding could be improved…
- …without making the payload too heavy?
- …without going over budget?
- altitude
- The height of an object in relation to the ground or sea level.
- electromagnetic radiation
- ER composes the waves of the electromagnetic field, which includes visible light, x-rays, infrared, and gamma rays. Cosmic radiation includes gamma rays.
- high-altitude
- There are different definitions, but this generally includes 8,000 feet above sea level+. High-altitude balloons can reach altitudes over 100,000 feet.
- particle radiation
- Particle radiation is made up of alpha and beta particles. An alpha particle is basically a highly ionized helium atom. A beta particle is just a free electron. Alpha is deadly but is stopped much more easily than beta. We are working with cosmic radiation, which is composed primarily of beta.
- secondary radiation
- Radiation that intensifies after striking an object.
- sievert
- The unit of measurement for ionizing radiation and its effects on the human body.
Pre-Activity Assessment
Review: Review terms and concepts from the previous lesson; may be informal verbal assessment.
Activity Embedded (Formative) Assessment
Formative Assessment: Use the Post Launch Additional Resources (PDF) to assess student knowledge on radiation and the designs they created, or to make connections in the data analysis.
Calculating and plotting the data graphs and plots.
Post-Activity (Summative) Assessment
Selecting a winning space agency: Students may be tested on their knowledge of concepts relating to radiation and cosmic rays. Additionally, participation in the group according to roles may be assessed. Delivery of products in a timely manner may be assessed. The team with the most effective radiation shield may be awarded a prize.
Students may calculate incorrectly or interpret graphs incorrectly. Students will need to discern between signal and noise.
Students can begin to optimize their payload for “next time” by analyzing and troubleshooting materials and design. See an example.
Rask, J., Vercoutere, W., Krause, A., & Navarro, BJ. (2008). Space faring: The radiation challenge (module three: radiation countermeasures). National Aeronautic and Space Administration Educational Product EP-2008-08-118-MSFC
- Shielding from Cosmic Radiation: Space Agency Scenario
- Shielding from Cosmic Radiation: Part 1 - Building the Payload
- Shielding from Cosmic Radiation: Part 2 - High-Altitude Balloon Launch Test
- Shielding from Cosmic Radiation: Part 3 - Post-Launch Analysis
Contributors
Jeff Bell; Mary Block; Garrett Burrows; Phil Bergmaier; Trina Kilty; Andrea Burrows; Kevin Kilty; Kate Muir-Welsh; Shawna McBride; Jim Stith
Supporting Program
Wyoming NASA Space Grant Consortium, University of Wyoming
Acknowledgements
Much of the equipment and training to develop the Wyoming NASA Space Grant balloon program were provided by StratoStar.
This material was developed based upon work supported by the National Science Foundation under grant no. 1821566—the LIFT (Learning to Integrate Fundamentals through Teaching) Project, Wyoming NASA Space Grant Consortium, University of Wyoming. Any opinions, findings and conclusions or recommendations expressed in this material are those of the authors and do not necessarily reflect the views of the National Science Foundation.
Copyright
2021 by Regents of the University of Colorado; original © 2019 University of Wyoming