
You Be the Radiologist! Strain Graphs That Reveal Tumors
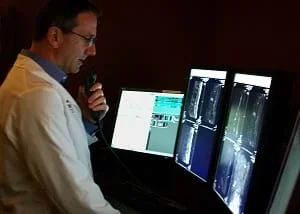 Students act as radiologistsCopyright Wikimedia Commons http://upload.wikimedia.org/wikipedia/commons/thumb/9/91/Radiologist_in_San_Diego_CA_2010.jpg/1280px-Radiologist_in_San_Diego_CA_2010.jpg
In addition to the associated lesson, this activity functions as a summative assessment for the Using Stress and Strain to Detect Cancer unit. In this activity, students create 1-D strain plots in Microsoft Excel® depicting the location of a breast tumor amidst healthy tissue. The results of this activity function as proof of the accuracy and reliability of students' breast cancer detection designs.
Biomedical engineers conducting cancer research have shifted their attention toward tumor classification since finding characteristics common to all types of malignant breast cancer increases the validity in cancer diagnosis. One characteristic that distinguishes breast cysts from cancerous tumors is a dense fibrous area surrounding the lesion. This occurs as the body attempts to ward off the malignant tumor. Benign tumors are found to be much softer. On a very basic level, in this activity, students apply this concept to Young's modulus of elasticity. In generating the strain graph, the malignant region is depicted with a much higher modulus of elasticity indicting a stiffer region with less deformation. This understanding is applied in the generation of the strain graph as well as the brochures generated as part of the associated lesson's assessment.
After this activity, students should be able to:
- Model a tumor in normal tissue using a stress strain relationship.
- Depict a tumor using a graph in excel.
- Describe the advantages and disadvantages of this imaging technique.
- Explain how breaking down the problem can lead to an achievable solution.
- CCSS.Math.Content.HSA-APR.A.1 Understand that polynomials form a system analogous to the integers, namely, they are closed under the operations of addition, subtraction, and multiplication; add, subtract, and multiply polynomials.
Grades 9-12
Do you agree with this alignment? - CCSS.Math.Content.HSA-REI.A.2 Solve simple rational and radical equations in one variable, and give examples showing how extraneous solutions may arise.
Grades 9-12
Do you agree with this alignment? - CCSS.Math.Content.HSA-REI.C.5 Prove that, given a system of two equations in two variables, replacing one equation by the sum of that equation and a multiple of the other produces a system with the same solutions.
Grades 9-12
Do you agree with this alignment? - CCSS.Math.Content.HSF-IF.B.6 Calculate and interpret the average rate of change of a function (presented symbolically or as a table) over a specified interval. Estimate the rate of change from a graph.
Grades 9-12
Do you agree with this alignment? - CCSS.Math.Content.HSN-Q.A.1 Use units as a way to understand problems and to guide the solution of multi-step problems; choose and interpret units consistently in formulas; choose and interpret the scale and the origin in graphs and data displays.
Grades 9-12
Do you agree with this alignment? - CCSS.Math.Content.HSS-ID.A Summarize, represent, and interpret data on a single count or measurement variable
Grades 9-12
Do you agree with this alignment? - CCSS.Math.Content.HSS-ID.B Summarize, represent, and interpret data on two categorical and quantitative variables
Grades 9-12
Do you agree with this alignment? - CCSS.Math.Content.HSS-ID.B.6 Represent data on two quantitative variables on a scatter plot, and describe how the variables are related.
Grades 9-12
Do you agree with this alignment?
- Use computers and calculators to access, retrieve, organize, process, maintain, interpret, and evaluate data and information in order to communicate.
Grades 9-12
Do you agree with this alignment? - Telemedicine reflects the convergence of technological advances in a number of fields, including medicine, telecommunications, virtual presence, computer engineering, informatics, artificial intelligence, robotics, materials science, and perceptual psychology.
Grades 9-12
Do you agree with this alignment? - STEL-8N Use various approaches to communicate processes and procedures for using, maintaining, and assessing technological products and systems.
Grades 9-12
Do you agree with this alignment?
- HS-ETS1-2 Design a solution to a complex real-world problem by breaking it down into smaller, more manageable problems that can be solved through engineering.
Grades 9-12
Do you agree with this alignment? - HS-PS2 Motion and Stability: Forces and Interactions
Grades 9-12
Do you agree with this alignment?
- HS-ETS1-2 Design a solution to a complex real-world problem by breaking it down into smaller, more manageable problems that can be solved through engineering.
Grades 9-12
This resource focuses on the following Three Dimensional Learning aspects of NGSS:
Science & Engineering Practices- Design a solution to a complex real-world problem, based on scientific knowledge, student-generated sources of evidence, prioritized criteria, and tradeoff considerations.Do you agree with this alignment?
Disciplinary Core Ideas- Criteria may need to be broken down into simpler ones that can be approached systematically, and decisions about the priority of certain criteria over others (trade-offs) may be needed.Do you agree with this alignment?
Do you agree with this alignment? - Design a solution to a complex real-world problem, based on scientific knowledge, student-generated sources of evidence, prioritized criteria, and tradeoff considerations.
- CCSS.Math.Content.HSA-APR.A.1 Understand that polynomials form a system analogous to the integers, namely, they are closed under the operations of addition, subtraction, and multiplication; add, subtract, and multiply polynomials.
Grades 9-12
Do you agree with this alignment? - CCSS.Math.Content.HSA-REI.A.2 Solve simple rational and radical equations in one variable, and give examples showing how extraneous solutions may arise.
Grades 9-12
Do you agree with this alignment? - CCSS.Math.Content.HSA-REI.C.5 Prove that, given a system of two equations in two variables, replacing one equation by the sum of that equation and a multiple of the other produces a system with the same solutions.
Grades 9-12
Do you agree with this alignment? - CCSS.Math.Content.HSF-IF.B.6 Calculate and interpret the average rate of change of a function (presented symbolically or as a table) over a specified interval. Estimate the rate of change from a graph.
Grades 9-12
Do you agree with this alignment? - CCSS.Math.Content.HSN-Q.A.1 Use units as a way to understand problems and to guide the solution of multi-step problems; choose and interpret units consistently in formulas; choose and interpret the scale and the origin in graphs and data displays.
Grades 9-12
Do you agree with this alignment? - CCSS.Math.Content.HSS-ID.A Summarize, represent, and interpret data on a single count or measurement variable
Grades 9-12
Do you agree with this alignment? - CCSS.Math.Content.HSS-ID.B Summarize, represent, and interpret data on two categorical and quantitative variables
Grades 9-12
Do you agree with this alignment? - CCSS.Math.Content.HSS-ID.B.6 Represent data on two quantitative variables on a scatter plot, and describe how the variables are related.
Grades 9-12
Do you agree with this alignment?
- 3202.3.7 Solve problems related to velocity, acceleration, force, work, and power.
Grades 9-12
Do you agree with this alignment?
Each student needs a copy of the attached handout (doc) (DOC).
A complete understanding of Hooke's law, stress, strain and the associated relationships.
Today we will finally complete our unit and it will be your task to create an image depicting a tumor amidst healthy breast tissue. You will each receive a handout with an image which, after making the appropriate calculations, should be depicted in a graph generated in Microsoft Excel®. Please read the instructions on your assignment and ask any me any questions you may have. Today's assignment is worth 50 points, like your brochure. Together the two assignments are worth 100 points, equal to a test grade. Not to worry though! You all are more than prepared to create your challenge solution. Please clear everything from your desks and remember this is an individual assessment so please only look at your computer screen.
Background
This activity provides students with the first portion of the Go Public phase of the legacy cycle. Students create strain plots without any aids. They are graded on their solutions. This activity tests students on their comprehension of the material presented thus far, which includes the concepts of Hooke's law, stress, strain and biomedical imaging techniques.
With the Students
Hand out tp students the Show Me the Tumor! Handout (PDF). Explain that they may not use their notes or any other aids. This is an individual assessment, which along with the take-home portion, will count as a test grade.
- cancer
- A malignant and invasive growth or tumor tending to recur after removal and to metastasize to other sites.
- stress
- The physical pressure, pull, or other force exerted on a system by another, producing a strain. Measured by the ratio of force to area.
- strain
- Deformation of a body or structure as a result of an applied force beyond limit.
- force
- An influence on a body or system, producing a change in movement or in shape or other effects.
- spring
- An elastic body such as a wire of steel coiled spirally that recovers its shape after being compressed, bent, or stretched.
Activity Embedded Assessment: Grade on the accuracy of their graphs as well as their supporting calculations.
Dictionary.com. Lexico Publishing Group,LLC. Accessed December 28, 2008. (Source of vocabulary definitions, with some adaptation)
- Using Stress and Strain to Detect Cancer!
- Your Biomedical Challenge: Painlessly Detecting Disease
- Stress, Strain and Hooke's Law
- Making Brochures: Presenting Painless Cancer Detection!
- You Be the Radiologist! Strain Graphs That Reveal Tumors
Contributors
Luke Diamond; Meghan Murphy
Supporting Program
VU Bioengineering RET Program, School of Engineering, Vanderbilt University
Acknowledgements
The contents of this digital library curriculum were developed under National Science Foundation RET grant nos. 0338092 and 0742871. However, these contents do not necessarily represent the policies of the NSF, and you should not assume endorsement by the federal government.
Copyright
2013 by Regents of the University of Colorado; original © 2007 Vanderbilt University