
Program Analysis Using App Inventor
 What do computer science and the game of battleship have in common?Copyright 2012 Rich Powers, University of Nebraska-Omaha
In computer science, program analysis is used to determine the behavior of computer programs. Flow charts are an important tool for understanding how programs work by tracing control flow. Control flow is a graphical representation of the logic present in the program. In this lesson, students learn about, design and create flow charts for different scenarios, including a game based on the Battleship® created by Hasbro©. In the associated activity, Flow Charting App Inventor, students apply their knowledge from this lesson and gain experience with a software application called App Inventor. This lesson and its associated activity can be stand-alone or used as a launching point for the Android Acceleration Application unit or any lesson involving App Inventor.
Program analysis is a key part of what software engineers do every day. Program analysis has many valuable applications, which include determining program correctness and program optimization. This lesson, with its focus on flow charting, relates to the program correctness aspect of program analysis. Creating flow charts to determine how and why a program behaves the way it does is one way to implement the software/system design cycle, comparable to the engineering design process. The process of creating flow charts relies on the analysis, design and testing steps in these processes.
After this lesson, students should be able to:
- Design an accurate flow chart.
- Test a flow chart to determine its accuracy and correctness.
- Explain how flow charts are used as a tool to design and analyze computer programs.
- STEL-7Q Apply the technology and engineering design process.
Grades 6-8
Do you agree with this alignment? - STEL-7R Refine design solutions to address criteria and constraints.
Grades 6-8
Do you agree with this alignment?
- Communicate the problem, process, and solution. Students should present their results to students, teachers, and others in a variety of ways, such as orally, in writing, and in other forms — including models, diagrams, and demonstrations.
Grades 9-12
Do you agree with this alignment?
- 12.1.3.a Propose designs and choose between alternative solutions of a problem
Grades 9-12
Do you agree with this alignment? - 12.1.3.e Communicate the problem, process, and solution
Grades 9-12
Do you agree with this alignment? - 8.1.3.b Design a solution or product
Grades 6-8
Do you agree with this alignment?
This lesson is based on using flow charts to perform program analysis related to the design process. It is recommended for use by computer science teachers or teachers with extensive computer science knowledge. Teachers should have experience with creating and following flow charts, as well as the design process, particularly the analysis, design and testing steps. Students should have experience with projects that require them to think logically and sequentially.
During the course of the lesson, students gain experience with the engineering design process, specifically the concept of program analysis used in computer science to develop solutions to problems. Program analysis is used in the testing phase of the design process to test if a program is written correctly. It is also used in the design phase to help develop solutions to a recognized problem. Students are exposed to tools that may help them in the future to better apply the engineering design process for problem solving.
First, flow charts can be instrumental in problem analysis, design and testing of a software application. A flow chart is a graphical or visual representation of a process. For a given process, every step, decision, and possible pathway is represented in its flow chart. The symbols for flow charts are not entirely universal, but once a flow chart is written, a reader should be able to follow how a process moves from start to finish. This lesson uses the set of flow chart symbols (Figure 2). However, if you choose to use a different set of symbols, that is acceptable as long as a detailed flow for a process is explained in the resulting products. Provide students with multiple examples of flow charts to examine. Students should recognize the different elements of a flow chart in each example, including the start and end, the steps and actions, the decisions, and the flow lines. See Figure 3 for examples of simple flow charts.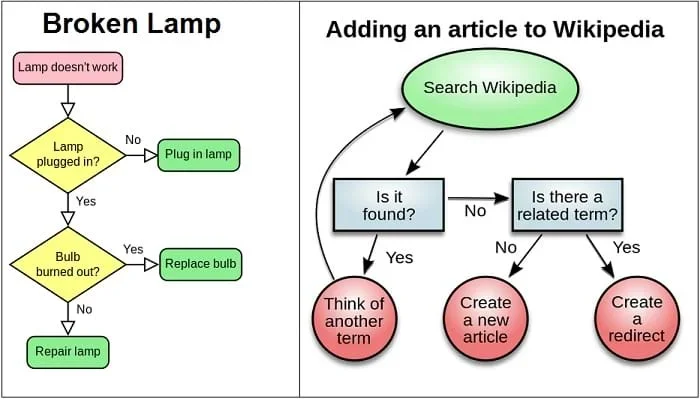 Figure 3. Simple flow chart examples.Copyright Wikimedia Commons. http://commons.wikimedia.org/wiki/File:LampFlowchart.svg (left), http://commons.wikimedia.org/wiki/File:Wikipedia_article-creation-2.svg (right)
Second, App Inventor is a great tool to give students hands-on experience writing flow charts for computer applications. The lesson has the added benefit of students learning about this powerful Android app writing tool.
This lesson is recommended to be used as a part of a programming class or other technology class focused on students programming. It can be used as an experience with the App Inventor software so students can develop apps. If desired, conduct the Storing Android Accelerometer Data: App Design follow-up lesson that actually does this. The MIT App Inventor website, http://appinventor.mit.edu/explore/, provides tutorials and curriculum to direct students to work through to gain knowledge of how to use the App Inventor. Tutorials for getting started, installing App Inventor, and on practice projects are available at http://appinventor.mit.edu/explore/learn.html. The teacher curriculum for App Inventor is provided at https://appinventor.mit.edu/explore/teach. If this has not been done previously, teachers and students should work through the tutorials and curriculum as part of this lesson.
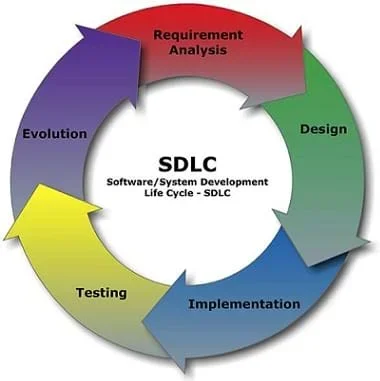 The steps of the software development cycle.Copyright 2012 Cliffydcw, Wikimedia Commons
http://commons.wikimedia.org/wiki/File:SDLC_-_Software_Development_Life_Cycle.jpg
The steps of the software development cycle.Copyright 2012 Cliffydcw, Wikimedia Commons
http://commons.wikimedia.org/wiki/File:SDLC_-_Software_Development_Life_Cycle.jpg
The software/system design process, a computer science version of the engineering design process, is cyclical in nature with a number of steps to develop a quality solution to a problem. In your computer science classes, you are taught to analyze the problem you are trying to design a program to solve. After the analysis stage, you design what the code will look like by making choices about algorithms, control structure and more. In the implementation phase, you put your design into practice by using the correct syntax for the computer language. One critical component of the design process that is often overlooked and difficult to do well is the testing step. In this lesson, you will gain experience with creating flow charts. Computer engineers and software developers use flow charts every day to analyze problems, design solutions, and test programs to see if they work. This lesson provides opportunities for you to practice writing flow charts that can be used to analyze problems and design and test solutions.
To begin, let's discuss computer programming and your past experience.
- What is computer programming? (Answer: Writing a detailed set of instructions that tells a computer how to perform a task, which is later translated into machine language through a process called compiling.)
- Where do you encounter programming on a daily basis? (Answer: Cell phones, computer applications, traffic lights, and many other examples. Anything with a computer as a part of its function.)
- How do you think that computer programs are structured? (Answers will vary but generally programs include a start-up code, major tasks grouped in functions, event handlers, and a loop to control the program.)
- How do you think computer programs are created from start to finish? (Answers will vary. Guide students into the idea that it is not a random process. Rather it is very structured and cyclical. It has steps of analyze, design, implement, test, refine and repeat-start again. It is cyclical in nature.)
- Can you think of any organizational structures that would help write a computer program? (Answers include flow charts and pseudo code.)
In this lesson, we are going to look at a process called program analysis that is used in computer science to develop solutions to problems. Program analysis is a tool that is critical in the software design process. It is used to test for program correctness in the testing phase of the design process. In addition, it can be used to help with the design phase when you are trying to create a solution for a particular problem. Following the lesson, students can conduct the associated activity Flow Charting App Inventor Tutorials to analyze MIT's App Inventor tutorials and design and create flow charts explaining how the tutorials function.
Today, we are going to look at one tool used to analyze problems and design and test solutions called a flow chart. (Figure 1 is an example flow chart that provides the possible answers for a child that asks the question, "Can I go to the movies?" Share Figure 1 with students by projecting the image or making handout copies.) Look at the flow chart and see how it addresses all the possible scenarios that can arise with this question.
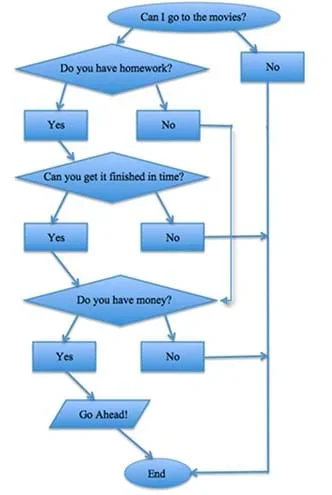 Figure 1. "Can I go to the movies?" flow chart.Copyright 2013 Brian Sandall, University of Nebraska-Omaha
A flow chart has symbols, which are universally accepted to represent certain things. Although their use is not required, flow charts created with these symbols are more easily understood by others. Figure 2 shows common symbols used to diagram the process represented by the flow chart.
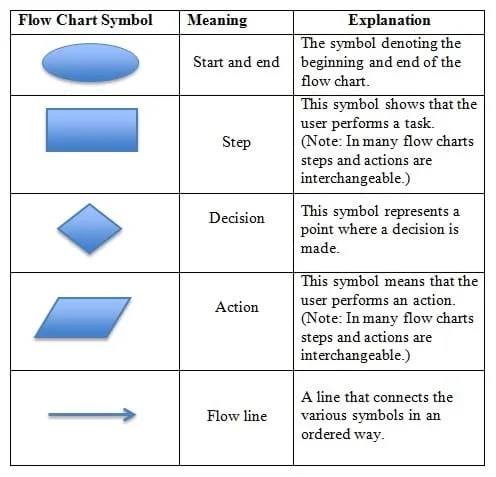 Figure 2. Flow chart symbols.Copyright 2013 Brian Sandall, University of Nebraska-Omaha
- program analysis
- The process of analyzing the behavior of computer programs.
- flow chart
- A diagram that shows a process or represents an algorithm showing the steps as various different boxes and connecting them with arrows.
- program optimization
- The process of modifying a software system to make it work more efficiently or use fewer resources.
- program correctness
- When an algorithm or program is performs its desired function correctly according to stated guidelines.
Battleships
Have students work in groups of two and play a Battleship-like game using the Battleship Worksheet (PDF). After playing one game, students discuss game strategies with their partners and develop flow charts that demonstrate how to play the game. Students then play another game to test if the flow chart works and make improvements as needed. Students create a final design of the flow chart and present it to the class for discussion.
As students play the game, walk around and suggest that students follow their flow charts exactly to see if it needs to be modified or improved. Ask questions such as:
- Why did you pick B6?
- Your flow chart would not allow you to pick E5 where you wanted to go, how can you make changes to the flow chart to allow you to make that choice?
Alternative Approach: Have students work individually to develop flow charts for playing Battleship from their experience playing with partners. To gauge the success of their flow charting, have them exchange their flow charts and then follow them EXACTLY to see if they provide enough information to play the game correctly.
Sample Battleship Flow Chart (PDF) provides an example of a completed flow chart that works correctly.
Writing Prompts
Have students answer the following questions provided on the Program Analysis Assessment (PDF):
- Explain the purpose of a flow chart and how it relates to computer programming. (Example answer: A flow chart provides a way to visually see what a program does in the analysis or testing phase of the design process. It shows the major steps and how the program moves from step to step. In addition, a flow chart can be very useful in designing a solution by helping programmers figure out what they need to accomplish and how to accomplish it before writing the code.)
- Explain how program analysis can be used as part of the software/systems design process. (Example answer: Program analysis is a critical tool in the design process. Program analysis is used to analyze problems. It is used to test for program correctness in the testing phase. In addition, program analysis tools [such as flow charts] can help with the design phase stage of the process.)
Performance Assessment
Included in the Program Analysis Assessment (PDF), students create flow charts for the steps a person would go through to purchase a soda pop from a vending machine. One possible flow chart solution is provided in Program Analysis Assessment Answer Key (PDF).
- Program Analysis Using App Inventor
Contributors
Rich Powers; Brian Sandall
Supporting Program
IMPART RET Program, College of Information Science & Technology, University of Nebraska-Omaha
Acknowledgements
The contents of this digital library curriculum were developed as a part of the RET in Engineering and Computer Science Site on Infusing Mobile Platform Applied Research into Teaching (IMPART) Program at the University of Nebraska-Omaha under National Science Foundation RET grant number CNS 1201136. However, these contents do not necessarily represent the policies of the NSF and you should not assume endorsement by the federal government.
Copyright
2013 by Regents of the University of Colorado; original © 2012 Board of Regents, University of Nebraska