
Flood Analysis
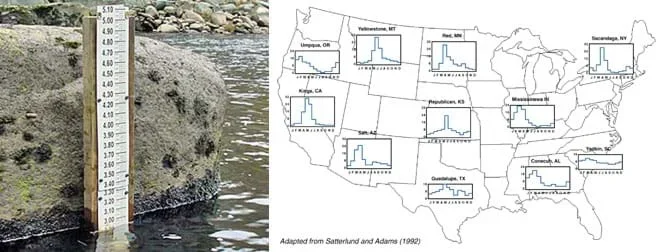 More than 7,000 stream gages nationwide provide streamflow data used to create hydrographs for water resource management and flood prediction. The map shows annual stream hydrographs from different U.S. cities.Copyright (left) U.S. Geological Survey; (right) NOAA, adapted from Satterlund and Adams (1992) http://ga.water.usgs.gov/edu/measureflow.html http://www.ncdc.noaa.gov/paleo/ctl/hydrograph2.html
Students learn how to use and graph real-world stream gage data to create event and annual hydrographs and calculate flood frequency statistics. Using an Excel spreadsheet of real-world event, annual and peak streamflow data, they manipulate the data (converting units, sorting, ranking, plotting), solve problems using equations, and calculate return periods and probabilities. Prompted by worksheet questions, they analyze the runoff data as engineers would. Students learn how hydrographs help engineers make decisions and recommendations to community stakeholders concerning water resources and flooding.
Water resource management and hydrology are specialized fields in civil engineering. Engineers analyze streamflow data for many purposes including flood prediction, water management and allocation, design and operation of locks and dams, and recreational safety and enjoyment. Hydrographs and flood frequency analyses are ways that engineers determine the probability that a certain area will flood during rainstorms of certain intensities, the expected response of a specific watershed region to a rainstorm, and annual/seasonal streamflow information.
After this activity, students should be able to:
- Plot an event hydrograph and make calculations using streamflow data.
- Use peak streamflow data to perform a flood frequency analysis for a particular region.
- Justify engineering decisions based on a region's annual streamflow.
- HS.3.1 Visual displays and summary statistics condense the information in data sets into usable knowledge.
Grades 9-12
Do you agree with this alignment?
- Develop, communicate, and justify an evidence-based scientific explanation showing how ecosystems follow the laws of conservation of matter and energy
Grades 9-12
Do you agree with this alignment? - Describe how carbon, nitrogen, phosphorus, and water cycles work
Grades 9-12
Do you agree with this alignment? - Develop, communicate, and justify an evidence-based scientific explanation addressing questions regarding the interaction of Earth's surface with water, air, gravity, and biological activity
Grades 9-12
Do you agree with this alignment?
- CCSS.Math.Content.HSA-REI.A.2 Solve simple rational and radical equations in one variable, and give examples showing how extraneous solutions may arise.
Grades 9-12
Do you agree with this alignment? - CCSS.Math.Content.HSF-IF.B.4 For a function that models a relationship between two quantities, interpret key features of graphs and tables in terms of the quantities, and sketch graphs showing key features given a verbal description of the relationship.
Grades 9-12
Do you agree with this alignment? - CCSS.Math.Content.HSN-Q.A.1 Use units as a way to understand problems and to guide the solution of multi-step problems; choose and interpret units consistently in formulas; choose and interpret the scale and the origin in graphs and data displays.
Grades 9-12
Do you agree with this alignment? - CCSS.Math.Content.HSS-ID.B.6 Represent data on two quantitative variables on a scatter plot, and describe how the variables are related.
Grades 9-12
Do you agree with this alignment? - CCSS.Math.Content.HSS-MD.B.7 (+) Analyze decisions and strategies using probability concepts (e.g., product testing, medical testing, pulling a hockey goalie at the end of a game).
Grades 9-12
Do you agree with this alignment?
- STEL-4R Assess a technology that minimizes resource use and resulting waste to achieve a goal.
Grades 9-12
Do you agree with this alignment?
- HS-ESS2-5 Plan and conduct an investigation of the properties of water and its effects on Earth materials and surface processes.
Grades 9-12
This resource focuses on the following Three Dimensional Learning aspects of NGSS:
Science & Engineering Practices- Plan and conduct an investigation individually and collaboratively to produce data to serve as the basis for evidence, and in the design: decide on types, how much, and accuracy of data needed to produce reliable measurements and consider limitations on the precision of the data (e.g., number of trials, cost, risk, time), and refine the design accordingly.Do you agree with this alignment?
Disciplinary Core Ideas- The abundance of liquid water on Earth's surface and its unique combination of physical and chemical properties are central to the planet's dynamics. These properties include water's exceptional capacity to absorb, store, and release large amounts of energy, transmit sunlight, expand upon freezing, dissolve and transport materials, and lower the viscosities and melting points of rocks.Do you agree with this alignment?
Crosscutting Concepts- The functions and properties of natural and designed objects and systems can be inferred from their overall structure, the way their components are shaped and used, and the molecular substructures of its various materials.Do you agree with this alignment?
Do you agree with this alignment? - Plan and conduct an investigation individually and collaboratively to produce data to serve as the basis for evidence, and in the design: decide on types, how much, and accuracy of data needed to produce reliable measurements and consider limitations on the precision of the data (e.g., number of trials, cost, risk, time), and refine the design accordingly.
- HS-ETS1-1 Analyze a major global challenge to specify qualitative and quantitative criteria and constraints for solutions that account for societal needs and wants.
Grades 9-12
This resource focuses on the following Three Dimensional Learning aspects of NGSS:
Science & Engineering Practices- Analyze complex real-world problems by specifying criteria and constraints for successful solutions.Do you agree with this alignment?
Disciplinary Core Ideas- Criteria and constraints also include satisfying any requirements set by society, such as taking issues of risk mitigation into account, and they should be quantified to the extent possible and stated in such a way that one can tell if a given design meets them.Do you agree with this alignment?
- Humanity faces major global challenges today, such as the need for supplies of clean water and food or for energy sources that minimize pollution, which can be addressed through engineering. These global challenges also may have manifestations in local communities.Do you agree with this alignment?
Crosscutting Concepts- New technologies can have deep impacts on society and the environment, including some that were not anticipated. Analysis of costs and benefits is a critical aspect of decisions about technology.Do you agree with this alignment?
Do you agree with this alignment? - Analyze complex real-world problems by specifying criteria and constraints for successful solutions.
Each group needs:
- computer with Microsoft Excel software
- Runoff Data (XLSX) Excel file (on each computer)
- calculator
- Hydrographs and Flood Analysis Worksheet (PDF), one per student
A general knowledge of the various components of the water cycle (as introduced in the associated lesson).
What is the water cycle? (Answer: The movement of water around the Earth.) Why is it important for us and for engineering? (Possible answers: To calculate a community's expected water needs [drinking water, sewage treatment, recreation, irrigation of crops, parks and yards], to recommend whether water restrictions should be put in place during droughts, to inform land owners of areas that are at risk of flooding, to design and manage dams and human-made reservoirs, to determine probabilities and statistics about potential flood scenarios, etc.)
Engineers need a way to visualize and analyze the movement of water. To do this, they use graphs, specifically hydrographs. Hydrographs plot streamflow over a specific period of time at a specific location. Sometimes it is useful to look at how streamflow varies over the course of a year using an annual hydrograph. Other times, engineers use event hydrographs to look at the streamflow that results from a specific storm over a shorter period of time.
During this activity, you will make your own event and annual hydrographs using real-world data, and analyze the data as engineers do.
Background
Engineers who are involved in designing dams, estimating water flow and managing flood control must have an understanding of the hydrology of rivers. Streamflow information is gathered through networks of stream gages (monitoring instruments) located along rivers. This flow information is visualized through the use of hydrographs, which are graphs plotting the flow versus time at a particular point in a river. Flow-rate is measured in units of volume per time. Typical units are cms (cubic meters per second) or cfs (cubic feet per second).
An event hydrograph plots the response of a river system to a particular rainfall event. Rainfall events differ in both duration (minutes to hours to days) and intensities (drizzle versus downpour). Rainfall intensities are measured in length per time (that is, inches, centimeters or feet per minute). In a river or stream that flows all year long, the total flow is composed of base flow and direct runoff. Base flow is the flow that is unrelated to the rainfall event; it is the amount of water that was flowing in the river or stream before the storm happened. Direct runoff is the portion of flow that is directly a result of the rainfall. It is important to remove the base flow amount from the total runoff amount in order to determine the exact response to that particular intensity and duration of rainfall.
An annual hydrograph plots the monthly averaged streamflow throughout the year at a particular location. In hydrology, a water year starts on October 1 and ends on September 30. Historically, this time period was used because in most parts of the Northern Hemisphere, streamflow is at its lowest in October. As temperatures increase and snowmelt accelerates, streamflow reaches a maximum during the summer months.
The U.S. Geological Survey, a scientific agency of the U.S. government, monitors stream gages throughout rivers located all over the country. Because of this, we have a lot of historical streamflow data, some dating back to the early 1900s! Using this data, hydrological engineers can perform "flood frequency analyses." A flood frequency analysis involves using math and statistics to determine the likelihood of different levels of floods. This information is important, not only for engineers and scientists, but for business and home owners considering the flooding risk in certain areas.
Before the Activity
- Make sure enough computers with Microsoft Excel software are available, one per group, and each computer is able to open the Runoff Data (XLSX) Excel file.
- Make copies of the Hydrographs and Flood Analysis Worksheet (PDF), one per student.
With the Students
- Divide the class into student pairs and hand out the worksheets
- Tell students that the worksheets have the necessary instructions and steps to guide them to create event and annual hydrographs, and perform flood frequency analyses just as engineers do. For the teacher, an overview of the steps is provided below.
- Part 1: Creating an Event Hydrograph
- Students open the Runoff Data Excel file, which contains three data tabs: event data, annual data and peak streamflow.
- Working in the event data window, students convert the Runoff at gage B from cubic feet per minute to cubic feet per second to enable easier comparison with the runoff data at gage A.
- Following the worksheet instructions, students make event hydrographs on the same graph that plot precipitation, and the streamflow data from gages A and B.
- Then they answer worksheet questions #3-5 based on the event hydrographs they created.
- Part 2: Creating an Annual Hydrograph
- Working in the annual data, students use the skills they learned in Part 1 to make annual hydrographs.
- Then they answer worksheet questions #6-7 based on the annual hydrographs they created.
- Part 3: Performing a Flood Frequency Analysis
- Students work with the peak streamflow data. Peak streamflow is the largest recorded streamflow in a year. Students have n streamflow values for a record that is n years long.
- First, they answer worksheet question #8.
- Then they sort the peak streamflow values from highest to lowest.
- Then they rank (m) the values, giving a rank of 1 to the largest streamflow value, 2 to the second highest, etc.
- Students calculate the return period using TR = (n+1)/m, and answer worksheet question #9.
- The calculate the probability of reaching or exceeding each streamflow value as P=1/TR. They answer worksheet question #10.
- Then, using the calculated values, students answer worksheet questions #11-13.
- Conclude the activity by assigning students to make calculations and write recommendations to a community based on what they learned from Part 1 of the worksheet, as described in the Assessment section.
- annual hydrograph
- A type of hydrograph that plots the annual or monthly streamflow.
- event hydrograph
- A type of hydrograph that plots the response to a specific rainfall event, spanning a length of time from minutes to days.
- flood frequency analysis
- A calculation of the statistical probability that a flood of a certain magnitude for a certain river will occur.
- frequency
- The frequency of a certain magnitude flood is the reciprocal of the return period. For instance, the probability of a 100-year flood = 1/100 = 0.01 = 1% likelihood. In any given year, there is a 1% chance of a 100-year flood happening.
- hydrograph
- A graph showing the flow rate (volume/time) versus time from data collected at a specific point in a river or stream.
- return period
- The most likely time interval between floods of a given magnitude. For example, a 100-year flood has a return period of t=100 years, meaning that on average, a flood of that magnitude will occur once every 100 years.
Pre-Activity Assessment
Prior Knowledge Check: Get students thinking about and ready for the upcoming activity by reviewing the following concepts:
- What are the various steps and components in the water cycle? (Answer: Have student volunteers draw on the classroom board diagrams of the water cycle, including precipitation, transpiration and evaporation.)
- What is a watershed? (Answer: A watershed is an area or region that is drained by a common river system.)
- What is runoff? (Answer: Runoff is the amount of precipitation [rainfall] on land that reaches a river or stream.)
- Why might estimating the amount of runoff be important for engineers? (Possible answers: Engineers do this for many purposes, such as flood management, hydropower applications, water resource/supply planning and management, and dam design.)
Activity Embedded Assessment
Worksheet: Have students use the Hydrographs and Flood Analysis Worksheet (PDF) to guide them through the activity, answering its 13 questions and mathematical problems as they go. Review their answers to assess their mastery of the subject.
Post-Activity Assessment
Communicate Like an Engineer! Have students write recommendations to a community based on what they learned from Part 1 of the worksheet. Tell students that a community lives adjacent to the gage that recorded the peak streamflow. Knowing that a peak streamflow of above 1,300 cfs could potentially flood the town, provide a recommendation to the town that includes:
- The return period of this level flood
- The probability, in any given year, that a flood of this magnitude could happen
- A recommendation to the community members as to whether the town is likely to flood
Example Answer: A flood frequency analysis was recently performed on the peak streamflow record at St. Vrain Creek in Longmont, CO, using data from USGS site #06725450. The significant results from this analysis that are important to the nearby St. Vrain community are as follows:
- Community records indicate that a streamflow amount of 1300 cfs is too much water for the riverbed at this gage point and floods the nearby St. Vrain, Longmont, CO, community.
- This level flood has a return period of 3.1 years. This means that, on average, the nearby community could be flooded once every 3.1 years.
- The probability of flooding in any given year is 32.4%. This means that in any year, there is a 32% chance of flooding and a 68% chance of not flooding.
Based on these findings, we recommend that community members take precaution in building in this floodplain. A 32% chance of flooding in any given year is relatively high. Community members would benefit from purchasing insurance that covers flooding damage and/or considering structural changes to their houses or businesses to prevent damage from flooding.
Direct students to the U.S. Geological Survey Streamflow website at http://waterdata.usgs.gov/usa/nwis/rt to obtain streamflow data from a nearby area. Have them plot hydrographs and perform a flood frequency analysis using the data they obtain.
The USGS National Water Information System web interface is a quick and interactive way to generate hydrographs from real-world streamflow data. Have students explore the data: Alter the graph by choosing different time periods. Plot longer time periods to look for streamflow peaks. If students know of specific flood events, have them enter dates and locations to see USGS data presented in a hydrograph plot. For example, to see the dramatic jump in Boulder Creek stream gage water height measurements during the 2013 Colorado floods, look at the USGS 06730200 Boulder Creek at North 75th Street gage data at https://nwis.waterdata.usgs.gov/usa/nwis/uv/?cb_00065=on&cb_00060=on&format=gif_default&period=&begin_date=2013-09-07&end_date=2013-09-14&site_no=06730200.
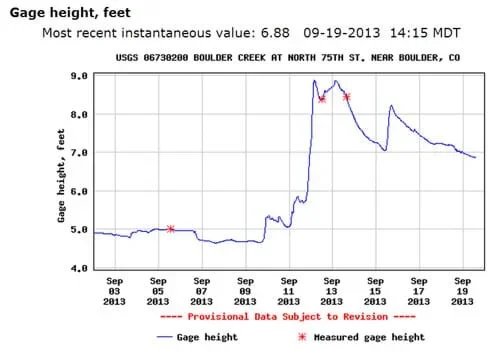 This hydrograph shows the dramatic surge in Boulder Creek water levels at one measurement location during the 2013 Colorado floods.Copyright 2013 U.S Geological Survey http://waterdata.usgs.gov/nwis/uv?cb_00065=on&cb_00060=on&format=gif_default&period=&begin_date=2013-09-02&end_date=2013-09-19&site_no=06730200
Perlman, Howard. How Streamflow is Measured. Last modified May 23, 2013. USGS Water Science School, Georgia Water Science Center, U.S. Geological Survey, U.S. Department of the Interior. Accessed August 22, 2013. http://ga.water.usgs.gov/edu/measureflow.html
USGS Current Water Data for the Nation. U.S. Geological Survey, US Department of the Interior. Accessed January 12, 2013. (Source of annual and peak streamflow data) http://waterdata.usgs.gov/usa/nwis/rt
Contributors
Emily Gill; Malinda Schaefer Zarske
Supporting Program
Integrated Teaching and Learning Program, College of Engineering, University of Colorado Boulder
Acknowledgements
The contents of these digital library curricula were developed by the Integrated Teaching and Learning Program under National Science Foundation GK-12 grant no. 0338326. However, these contents do not necessarily represent the policies of the National Science Foundation, and you should not assume endorsement by the federal government.
Copyright
2013 by Regents of the University of Colorado