
Linear Models and Latex Explosion!
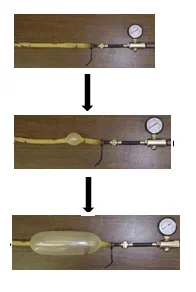 Students work as engineers to test the strength of latex tubing through testing, data collection and data analysis.Copyright Center for Compact and Efficient Fluid Power (CCEFP). Used with permission.
Students use latex tubes and bicycle pumps to conduct experiments to gather data about the relationship between latex strength and air pressure. Then they use this data to extrapolate latex strength to the size of latex tubing that would be needed in modern passenger sedans to serve as hybrid vehicle accelerators, thus answering the engineering design challenge question posed in the first lesson of this unit. Students input data into Excel spreadsheets and generate best fit lines by the selection of two data points from their experimental research data. They discuss the y-intercept and slope as it pertains to the mathematical model they generated. Students use the slope of the line to interpret the data collected. Then they extrapolate with this information to predict the latex dimensions that would be required for a full-size hydraulic accumulator installed in a passenger vehicle.
To create functional and effective designs, engineers collect and analyze data on various design elements. Often, engineers use prototypes or smaller-sized models of the design components in their experimentations and research. To understand how full-scale designs will function, they use statistical models to extrapolate information. In this activity, students implement a design strategy that allows them to model the relationship between latex strength and air pressure. This model allows them to generalize to large-scale latex tubing, similar to the work of real engineers.
After this activity, students should be able to:
- Carry out a simple design experiment by measuring the quantities of two variables.
- Generate a line of best fit using two data points for a linear relationship and determine the equation of the line.
- Use appropriate language to interpolate given data points in a linear relationship.
- Extrapolate and make predictions, given a collection of data points.
- In paragraph format, describe the steps of the engineering design process from start to finish.
- CCSS.Math.Content.HSA-CED.A.2 Create equations in two or more variables to represent relationships between quantities; graph equations on coordinate axes with labels and scales.
Grades 9-12
Do you agree with this alignment? - CCSS.Math.Content.HSF-LE.B Interpret expressions for functions in terms of the situation they model
Grades 9-12
Do you agree with this alignment? - CCSS.Math.Content.HSF-LE.B.5 Interpret the parameters in a linear or exponential function in terms of a context.
Grades 9-12
Do you agree with this alignment? - CCSS.Math.Content.HSS-ID.B Summarize, represent, and interpret data on two categorical and quantitative variables
Grades 9-12
Do you agree with this alignment? - CCSS.Math.Content.HSS-ID.B.6 Represent data on two quantitative variables on a scatter plot, and describe how the variables are related.
Grades 9-12
Do you agree with this alignment? - CCSS.Math.Content.HSS-ID.B.6c Fit a linear function for a scatter plot that suggests a linear association.
Grades 9-12
Do you agree with this alignment? - CCSS.Math.Content.HSS-ID.C.7 Interpret the slope (rate of change) and the intercept (constant term) of a linear model in the context of the data.
Grades 9-12
Do you agree with this alignment? - CCSS.Math.Practice.MP4 Model with mathematics.
Grades K-12
Do you agree with this alignment?
- STEL-8Q Synthesize data and analyze trends to make decisions about technological products, systems, or processes.
Grades 9-12
Do you agree with this alignment?
- HS-ETS1-2 Design a solution to a complex real-world problem by breaking it down into smaller, more manageable problems that can be solved through engineering.
Grades 9-12
This resource focuses on the following Three Dimensional Learning aspects of NGSS:
Science & Engineering Practices- Design a solution to a complex real-world problem, based on scientific knowledge, student-generated sources of evidence, prioritized criteria, and tradeoff considerations.Do you agree with this alignment?
Disciplinary Core Ideas- Criteria may need to be broken down into simpler ones that can be approached systematically, and decisions about the priority of certain criteria over others (trade-offs) may be needed.Do you agree with this alignment?
Do you agree with this alignment? - Design a solution to a complex real-world problem, based on scientific knowledge, student-generated sources of evidence, prioritized criteria, and tradeoff considerations.
- CCSS.Math.Content.HSA-CED.A.2 Create equations in two or more variables to represent relationships between quantities; graph equations on coordinate axes with labels and scales.
Grades 9-12
Do you agree with this alignment? - CCSS.Math.Content.HSF-LE.B Interpret expressions for functions in terms of the situation they model
Grades 9-12
Do you agree with this alignment? - CCSS.Math.Content.HSF-LE.B.5 Interpret the parameters in a linear or exponential function in terms of a context.
Grades 9-12
Do you agree with this alignment? - CCSS.Math.Content.HSS-ID.B Summarize, represent, and interpret data on two categorical and quantitative variables
Grades 9-12
Do you agree with this alignment? - CCSS.Math.Content.HSS-ID.B.6 Represent data on two quantitative variables on a scatter plot, and describe how the variables are related.
Grades 9-12
Do you agree with this alignment? - CCSS.Math.Content.HSS-ID.B.6c Fit a linear function for a scatter plot that suggests a linear association.
Grades 9-12
Do you agree with this alignment? - CCSS.Math.Content.HSS-ID.C.7 Interpret the slope (rate of change) and the intercept (constant term) of a linear model in the context of the data.
Grades 9-12
Do you agree with this alignment? - CCSS.Math.Practice.MP4 Model with mathematics.
Grades K-12
Do you agree with this alignment?
Each group needs:
- bicycle pump
- needle tip extension for bicycle pump (available at bicycle and hardware stores where bicycle pumps are sold; often used for inflating basketballs, very important for attaching the latex tubing to the bicycle pump)
- 3 sets of 3 latex tubes (total of 9 tubes) with the following wall thicknesses: 1/32 in (0.08 cm), 1/16 in (0.16 cm) and 3/32 in (0.24 cm), with each tube 1 foot (30.5 cm) in length; available at mcmaster.com, search for latex tubing: http://www.mcmaster.com/#latex-tubing/=ojr7ts (Tip: The inner and outer diameters will vary, but it is best to order tubes with proportional dimensions among all 3 sizes.)
- precision ruler, for accurately measuring millimeters and centimeters; even better, provide digital rulers with calipers (alternatively, provide students with the tube dimensions, as supplied from the manufacturer)
- access to a computer with Microsoft® Excel®
- 2 rubber bands (to seal the ends of the tubes; small rubber bands are preferable)
- 2 zip ties (also for sealing the tubes)
- marker
- journal (or paper), for each person, for documenting results, conclusions and reflections
- safety glasses, one per person
- ear protection, such as ear muffs, available at hardware stores or online at https://www.harborfreight.com/industrial-ear-muffs-43768.html, one per person
- Interpreting Graphs Homework (PDF), one per person, as completed from previous/associated lesson
- Linear Models from Experimental Data Worksheet (PDF), one per group
To share with the entire class:
- overhead projector
- computer with projector to show video
- Interpreting Graphs Homework (docx)
- Interpreting Graphs Homework (pdf)
- Interpreting Graphs Homework Answer Key (docx)
- Interpreting Graphs Homework Answer Key (pdf)
- Linear Models from Experimental Data Worksheet (docx)
- Linear Models from Experimental Data Worksheet (pdf)
- Linear Models from Experimental Data Worksheet Answer Key (docx)
- Linear Models from Experimental Data Worksheet Answer Key (pdf)
Students must be able to:
- Input two columns of data in an Excel spreadsheet and generate a simple linear graph.
- From two data points, generate the equation of a line.
- Input data into a linear equation in order to retrieve an output.
Students must also understand that the independent variable is the input and the dependent variable is the output for prediction purposes.
Recall our engineering challenge question and interview from a few days ago: We need to collect data from the testing of small-scale latex tubing in order to provide useful data that engineers can use to make generalizations to large-scale latex tubing suitable for use in modern sedans.
(Show the Interview with an Engineer video to students again. Prompt them to think about the original concept of how engineers might be able to use the data they are about to collect to measure the strength of a latex tube based on the dimensions of the small-scale latex tubing. Present them with a piece of the latex tubing and ask them to consider all of the aspects that are measurable. Remember, it will be critical to collect all of the data they can about each latex test sample.)
How can we think about this piece of latex in terms of measurements? (Give students a chance to share their ideas and suggestions.) The key dimensions of the latex are the following:
- wall thickness
- inner diameter (diameter of the hole; does not include wall thickness)
- outer diameter (diameter of the tube; includes wall thickness)
- tubing length (keeping in mind where they close off the tube)
Working in groups of three, your engineering team will be given three sets of three varying sizes of latex tubing. For the testing, each tube will be attached to a bicycle pump nozzle and closed off tightly with rubber bands and/or zip ties. The pump measures the air pressure distributed to the latex tube. How can we measure the strength of the tube using this device? (Expect students to explain that the strength of the tube can be characterized by the point at which it explodes, which can be measured by the amount of air pressure it contains at the time of explosion.)
You will have three of each size tube so that you can do three tests of each tube size. Record the strength data for each test, calculate the average for each tube size and enter the average strength for each tube size into the Excel document you create. At the end of your experiment, create a linear graph that shows the relationship between latex tube dimension—inner diameter, outer diameter or wall thickness (independent variable)—and strength, which is the measured air pressure at the time of the explosion (dependent variable). Along with your graph, include a brief description of how what you've done is part of the engineering design process and contributes to the implementation of design. When you are finished, make sure that your graph is clearly labeled and presentable to the rest of the class.
Background
Procedures can be adjusted depending on time constraints and any supplemental resources that might enhance the activity. While three independent variables (inner diameter, outer diameter and wall thickness) are available for students to choose from in order to characterize their latex tubes, keep in mind that they all produce the same outcome for the dependent variable (the point of explosion due to air pressure). This activity has been designed to use wall thickness as the independent variable for modeling latex strength.
Before the Activity
- Gather materials and make copies of the Linear Models from Experimental Data Worksheet (PDF), one per group.
- It is recommended that teachers complete the experiment in advance in order to obtain accurate experimental data for the exact latex tubes the students will be using.
- Due to the extremely loud noise that results from the explosion of the latex tubes, it is strongly recommended that you find an outdoor location to conduct the testing.
- The instructions for using Excel are based on using Microsoft Excel 2010 on a PC. If students will use Macs or different Excel versions, verify that the procedures are still accurate or modify as needed.
- Make sure students have their completed Interpreting Graphs Homework (PDF) from the associated lesson.
- With the students, model how to use the equipment correctly. It may be difficult to obtain accurate measurements for the dimensions of the latex tubing, and paying careful attention to "reading" the ruler is important. It is optimal to use digital rulers with calipers, although this option may be costly. If you do not have precise enough equipment, provide students with the tube dimensions as supplied from the manufacturer through the vendor where the tubes were purchased.
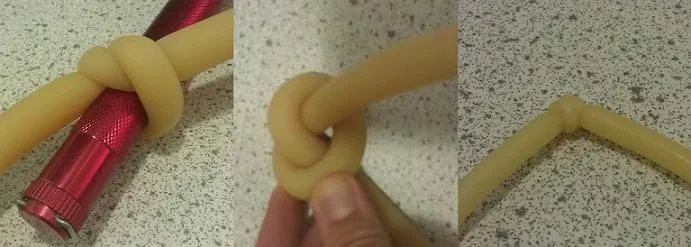 Figure 1: Tie the end of the latex tubing tightly to prevent air from escaping. To make the knot, it helps to first tie the tube around a marker.Copyright 2013 Ryan McMullen, ITL Program, University of Colorado Boulder
- For testing, each latex tube is tied on one end to close off the tube. To make the knot, it helps to first wrap the tube around a marker, as shown in Figure 1. In addition, a rubber band can be wrapped around one side of the knot to help prevent air from escaping. Practice this before the activity. The other end is attached to the needle tip extension for the bicycle pump using rubber bands and zip ties. See Figure 2 for an example of how both a zip tie and a rubber band can be used to attach the latex tubing to the needle tip extension for the bicycle pump.
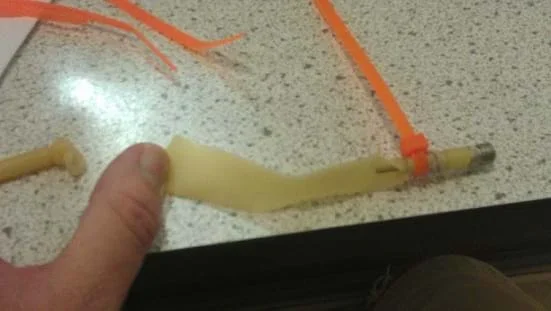 Figure 2: This latex tube (ripped from an explosion) is attached to the needle tip extension of a bicycle pump using a zip tie and a rubber band.Copyright 2013 Ryan McMullen, ITL Program, University of Colorado Boulder
With the Students: Day 1
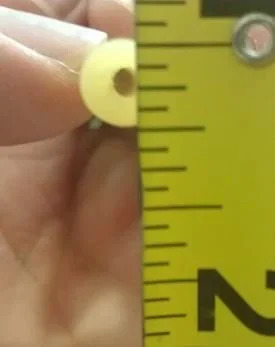 Figure 3: You can use a ruler to approximate the dimensions of the latex tubes, but using a precision ruler with calipers results in more accurate measurements.Copyright 2013 Ryan McMullen, ITL Program, University of Colorado Boulder
- Present the Introduction/Motivation content to students, which reminds them of the engineering challenge, shows them the video again and outlines the activity to come.
- Discuss measurement dimensions and how they will test the strength of their tubes. Using an overhead projector, quickly teach them (or review) how to create graphs in Excel and how to label axes and titles (detailed directions provided below).
- Divide the class into groups of three students each. Hand out the pumps, tubes and other materials.
- Have each group measure the dimensions of its five tubes and select which dimension to use for the independent variable. (If desired, have all groups use wall thickness as the independent variable.) Figure 3 shows how to make an approximate measuring; it is recommended that students use precision rulers with calipers to obtain a more precise measurement.
- Demonstrate for students how to set up the strength test. Show them how to attach one end of a tube to the bike pump and how to tie the other end tight enough that no air escapes.
- Have students begin the first test, modeling the demonstration by pumping air into the tube. Tell students to pay close attention to the air pressure. Suggest that one student do the pumping while the other two pay close attention to the air pressure gauge on the pump. Figure 4 shows the pressure gauge that should be carefully monitored during the tests.
- After the tube explodes, have team members compare their observations of the gauge air pressure reading at the point of explosion and agree upon a reasonable number to record in their journals as the data point. Write the data point next to the size of the dimension being used for the independent variable.
- Have groups repeat this test for the remaining two tubes of the same size, and then for the remaining six tubes, recording all results in the same fashion.
- Once finished testing, have students calculate average strength values for each tube size.
- Direct students to open a Microsoft Excel spreadsheet and enter their data (average values). Enter all the independent variable values in the first column and the dependent variable values in the second column, in the same order so that each tube dimension value (independent variable) and its corresponding strength measured in air pressure (dependent variable) are in the same row.
- Have students highlight the two columns, select the Insert tab at the top of the window, and select the first Scatter plot option. To the resulting scatter plots, have students add appropriate chart titles and axis labels with units using the Layout tab at the top of the window.
- Along with the graph, have students each write a paragraph description of how what they've done in this activity is part of the engineering design process and contributes to the implementation of design.
- Then, have groups print copies of the graphs so each student has one to use for homework.
- To create a best fit line, have students right click on a data point on their scatter plots. Select "Add Trendline" > on the window that pops up, click on the check box for "Display Equation on chart." Have students save their graphs and print a copy with the best fit line and equation to turn in to the teacher.
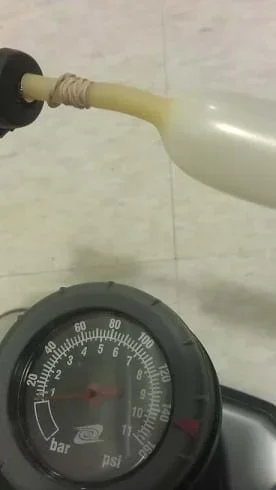 Figure 4: The experimental set-up for testing latex tube strength.Copyright 2013 Ryan McMullen, ITL Program, University of Colorado Boulder
 - Direct students to write descriptions about what information their graphs display and how to interpret the meaning of the equation of the best fit lines.
- Assign students the homework described in the Assessment section.
With the Students: Day 2
- Begin by asking students to take out their journals with their recorded experiment data and their printed Day 1 graphs with best fit lines (completed as homework the night before.) Ask a few students to volunteer to share with the class the equations they found for their lines of best fit. Explain that the slope indicates the change in strength of the latex based on the change in wall thickness. Ask students if they think the slopes in the sample equations seem reasonable, based on their Day 1 experiment results.
- Have students form into their Day 1 groups, and hand out a worksheet to each group. Give teams 15 minutes to complete the worksheet, which reviews the Day 1 experiment and asks them to create a line of best fit based on two representative data points.
- Once groups are finished, say: "Now that you have your data in Excel format, let's take a look at the worksheet and the equation you came up with at the end. Our goal is to determine the necessary latex dimensions for application in a modern sedan. Our tested latex tubing is far from the size needed to produce the amount of energy needed to bring a modern passenger car to a full stop, and then propel it forward. Does anyone have ideas on how we might use this data to make predictions?" (Listen to student ideas. Expect some students to suggest using the line of best fit to make predictions.)
- Explain to students: "We have data for the tested latex dimensions, but we need to think about extrapolating to large-scale latex. Extrapolating means that we use the relationship between our variables (in this case, wall thickness and latex strength) to make predictions for values of our variables outside of our data range. To start, who can tell me the approximate strength of a latex tube with wall thickness of 1/16 inch? (Call on one student to answer, based on the experimental results.) "Now, suppose we need to know the strength of a latex tube with 1-inch wall thickness? Do we have data that we gather directly from our table in order to answer this question?" (Expect students to respond "no," because none of the tested latex tubes had 1-inch wall thicknesses.) "It is estimated that a modern sedan can house nearly 300 psi at any given time. So we need to find the maximum wall thickness of the latex that can hold that amount of pressure."
- As a class, discuss the worksheet and student results, touching on the following points:
- What is the slope? (Answer: Slope is the change in the dependent variable based on change in the independent variable.)
- Use words to describe what the slope is and what it tells us. (Answer: The slope is the rate of change of the latex strength, based on the wall thickness. It describes how the latex strength changes based on the change in wall thickness.)
- How did you find the equation for your best fit line? (Example answer: We selected the first data point on our graph [for the smallest wall thickness] and the last data point on our graph [for the largest wall thickness.] We used those two points to solve for slope using the slope equation. Then we plugged the slope and the x- and y-coordinates of one of the points into the equation for a line [y=mx+b] and solved for b [y-intercept]. Once we had both the slope and the y-intercept, we had the equation for our best fit line.)
- Do other possibilities exist? (This depends on whether or not students chose different lines.) (Example answer: Yes! Other points could have been used, or the best fit line could have been drawn in such a way that it does not include any data points. Also, as we did on Day 1, we could use Excel to calculate a best fit line for us that may be different from the ones we found by hand.)
- What is the y-intercept? What is the significance of the y-intercept? (Example answer: The y-intercept is the y-coordinate at the point where the line intersects the y-axis. At this point, x=0. This means that it provides a value for the dependent variable when the independent variable is zero. In our scenario, it would predict the latex strength when the wall thickness is zero, which is not physically possible.)
- Ask students: How are you going to make predictions about the air pressure and latex size for use in modern sedans? Then draw on the board the table shown in Figure 5.
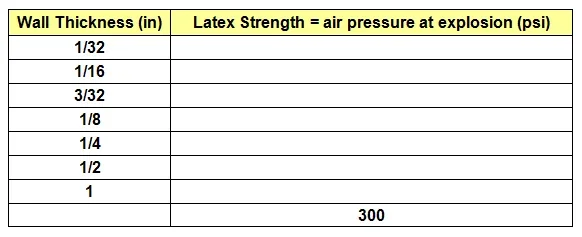 Figure 5. Data table for the strength of latex of differing wall thicknesses. The first three rows can be completed with students' experimental results. Students complete next five rows via extrapolation.
 - Direct students to copy the table and fill in the first three rows with their experimental data. Then have them use their best fit line to predict the latex strength in next four rows, as well as the wall thickness in the last row. Have students work in their groups to predict the missing latex strengths and wall thickness. Ask students:
- Which variable in the best fit line equation would you replace with the wall thickness of 1/2 to predict the corresponding latex strength? (Answer: x, the independent variable)
- Which variable in the equation would you replace with the latex strength of 300 to predict the corresponding wall thickness? (Answer: y, the dependent variable)
- Reintroduce the challenge question: Engineers face many design challenges when considering how to design large-scale systems. Before making a hydraulic accumulator that fits in a sedan, engineers design and test small-scale models. These smaller models can produce results in a lab that lead to the development of working, full-size accumulators that function as intended in modern passenger vehicles. Your task is to think how you would create a model that could be generalized to large-scale latex tubing for a hydraulic accumulator. Then recap the curricular unit by reminding students where they began and where they are now.
- Ask students to think about a general strategy for finding latex strength given any wall thickness. Choose one student to describe his or her answer to the class.
- Conclude the activity (and unit) with an emphasis on the point that equations are models and extremely useful in helping us to make predications.
- Assign students to wrap up their findings in their journals and each write a paragraph that describes the entire engineering analysis process they completed in this unit and answers the challenge question. Refer to the Assessment section for details.
- best fit line
- A line drawn on a scatter plot that reflects how two sets of data behave in relation to one another. Not "connecting the dots." Usually done for predictive purposes or to determine the general trend of the data. Hand-drawn best fit lines of the same data may vary slightly per person but should all show the same trend.
- engineering design process
- A series of steps used by engineering teams to guide them as they develop new solutions, products or systems. Typically, the steps include: defining a problem, brainstorming, researching and generating ideas, identifying criteria and specifying constraints, exploring possibilities, selecting an approach, developing a design proposal, making a model or prototype, testing and evaluating the design using specifications, refining the design, creating or making it, and communicating processes and results.
- extrapolate
- To extend (a graph, curve or range of values) by inferring unknown values from relationships and trends in the known data. (mathematics)
- generalization
- An extension of initial ideas and designs, usually the result of testing models in order to create final designs.
- interpolate
- To insert (an intermediate value) into a series by estimating or calculating it from nearby known values. (mathematics)
- model
- (verb) To simulate, make or construct something to help visualize or learn about something else (as a product, process or system) that is difficult to directly observe or experiment upon. (noun) In this activity, small-scale physical models are created for experimentation and mathematical models are created for extrapolation to full-size applications.
Pre-Activity Assessment
Lesson Review: Review the vocabulary and definitions from the Variables and Graphs: What's Our Story? associated lesson: independent variable, dependent variable, rate of change, slope, y-intercept, linear data/relationship. Also review the lesson homework: Interpreting Graphs Homework (PDF), using the Interpreting Graphs Homework Answer Key (PDF) as a guide. Assess students' depth of understanding of interpreting linear graphs by replacing the graph in this homework with a different linear graph and asking students the same questions.
Activity Embedded Assessment
Day 1 Graph Hand-In: After students work in groups to plot their data, have them each print a copy of the graph and its paragraph description of their design procedure to turn in, and enough other sets for each student to take for the homework assignment. Use the following questions as an assessment guide:
- Is the graph easy to understand?
- main title
- axes titles (independent and dependent variable)
- units (labeled and sensible)
- Are all aspects of the graph clearly described?
- Does the paragraph accurately describe the design process? (Look for a full list of all the materials used, as well as detailed descriptions of the entire procedure that students conducted.)
- Is the description one that can be easily replicated? (Look for specific details and the steps in chronological order.)
Day 2 Group Work and Class Discussion: After students work in groups to complete the linear models, assess their understanding through the discussion questions and worksheet review (in the Procedure section), which in dictates students' ability to use best fit lines to make predictions by extrapolating.
Post-Activity Assessment
Day 1 Homework: At Day 1 end, have students each take a printed graph home and determine a best fit line that best captures the data collected. Require them to use rulers to draw this line on their graphs. Then have students apply their knowledge from the Variables and Graphs: What's Our Story? associated lesson to find the equation of this best fit line by using two points on the line.
Day 2 Conclusions: Have students each write a paragraph about the entire engineering analysis process they completed in this unit in order to answer the challenge question. Ask students to explain their conclusions and how they could be applied to the design of hydraulic hybrid vehicles. Have them also reflect on how they felt about the importance and reliability of their experimentation. For example, ask students to answer the following questions in their responses:
- Was the experiment necessary to determine the wall thickness of a latex tube that could be used in hydraulic hybrid vehicles? (Example answer: Yes. Given the available materials, we could not directly test latex tubes that could withstand 300 psi. So it was necessary to test smaller tubes to determine how latex strength varies with wall thickness, and then extrapolate that relationship to determine an appropriate wall thickness for latex that can withstand 300 psi and thus would be suitable for use in a hydraulic hybrid vehicle.)
- Is the data you collected reliable? How could you improve its reliability? (Example answer: The data is reliable for latex tubes with small wall thicknesses that are close to the sizes of those that we tested. The fact that we tested each tube size three times increases our certainty that the data is reliable. Still, more tests for each tube size would increase reliability, as would testing more tubes sizes. On the other hand, it is hard to tell if our extrapolated data is accurate, because we have not tested larger-sized latex tubes. To increase this reliability, we could test larger-sized tubes instead of extrapolating results.)
- How accurate do you think your predicted latex strength and wall thickness values are? How could you improve your predictions? (Example answer: The values become less accurate when we extrapolate them to larger-sized tubes that are further and further from the sizes we tested. We are basing our predictions on the fact that the relationship between latex strength and wall thickness is linear and that we have determined a best fit linear regression, based on data for only three latex tube sizes. As we extrapolate to larger-sized tubes, we do not know if the linear relationship will continue to hold true. Thus, our predictions are limited in accuracy, but could be improved by testing larger-sized latex tubes.)
- Of the different methods you used for finding the best fit line, which appears to be the best? Why? (Example answer: Using Microsoft Excel to determine the best fit line appears to be the best method. This software reduces errors by using more complex mathematics to determine the line. The least accurate method is to estimate a best fit line by looking at the graph and using our eyes to draw a line that looks good.)
- Could your data be used to help design hybrid hydraulic vehicles (HHV)? Why or why not? (Example answer: Our data could be used as a starting point in designing HHVs, but it should not be the only data used! Engineers who design HHVs use more advanced materials and tools to test many different-sized latex tubes, including very large and thick tubes.)
- Would any more experimentation need to be done before designing a hydraulic system for a HHV? (Example answer: Yes, more experimentation is needed. Engineers working on designing HHVs should test many different sized latex tubes, including very large and thick tubes.)
- Was this experiment with data collection and analysis more interesting than other experiments you have done? Why or why not? (This is an opinion, so answers will vary. Expect students to say yes, because they were working towards solving a piece of a real-world problem.)
- Students should wear ear muffs and safety glasses for ear and eye protection.
- Since the sound of the tubes exploding is extremely loud, it is strongly recommended that this activity be conducted outdoors.
- The thicker the tubing, the more difficult it becomes to tie a knot in it using only human strength. Encourage students to use a marker to help tie knots in the tubes, as shown in Figure 1.
- The shorter the tubing length, the easier it is to get the initial rubber band wrapped around the tubing and needle. Make sure to wrap the tubing below the air exits for the needle so air can still flow.
- It may be difficult for students to focus on the gauge in order to monitor the pressure if they are scared or worried about imminent explosions; consider videotaping the process using a cell phone or video camera, making sure the gauge is in focus.
- Latex Tubing and Hybrid Vehicles
- Latex and Hybrids: What's the Connection?
- Variables and Graphs: What's Our Story?
- Linear Models and Latex Explosion!
Contributors
Erik Bowen; Carleigh Samson
Supporting Program
VU Bioengineering RET Program, School of Engineering, Vanderbilt University
Acknowledgements
The contents of this digital library curriculum were developed under National Science Foundation RET grant nos. 0338092 and 0742871. However, these contents do not necessarily represent the policies of the National Science Foundation, and you should not assume endorsement by the federal government.
Copyright
2013 by Regents of the University of Colorado; original © 2010 Vanderbilt University