
Variables and Graphs: What's Our Story?
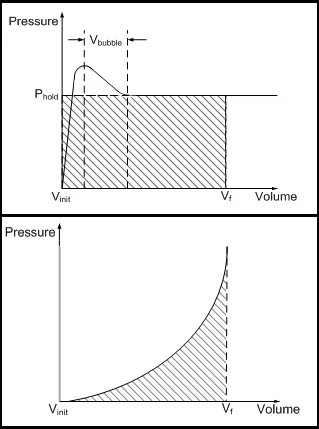 During the design process, engineers use graphs for data analysis.Copyright Center for Compact and Efficient Fluid Power (CCEFP). Used with permission.
Students learn how to quickly and efficiently interpret graphs, which are used for everyday purposes as well as engineering analysis. Through a practice handout completed as a class and a worksheet completed in small groups, students gain familiarity in talking about and interpreting graphs. They use common graph terminology such as independent variable, dependent variable, linear data, linear relationship and rate of change. The equation for calculating slope is explained. The focus is on students becoming able to clearly describe linear relationships by using the language of slope and the rate of change between variables. At lesson end, students discuss the relationship between variables as presented by the visual representation of a graph. Then they independently complete a homework handout.
Engineers use models to make generalizations about the relationship between variables. In some cases, linear data is used to analyze trends over long periods of time. A best fit line can be used to approximate an exact relationship between variables that are related in a linear fashion. This vital information is extrapolated to large-scale models to help engineers refine and deepen their understanding of real-world phenomena, which is pivotal in many engineering designs.
After this lesson, students should be able to:
- Interpret the relationship between variables given graphs.
- Interpret rate of change of linear data with appropriate mathematical language.
- CCSS.Math.Content.HSF-LE.B.5 Interpret the parameters in a linear or exponential function in terms of a context.
Grades 9-12
Do you agree with this alignment?
- STEL-8Q Synthesize data and analyze trends to make decisions about technological products, systems, or processes.
Grades 9-12
Do you agree with this alignment?
- CCSS.Math.Content.HSF-LE.B.5 Interpret the parameters in a linear or exponential function in terms of a context.
Grades 9-12
Do you agree with this alignment? - CCSS.Math.Content.HSS-ID.B Summarize, represent, and interpret data on two categorical and quantitative variables
Grades 9-12
Do you agree with this alignment? - CCSS.Math.Content.HSS-ID.B.6 Represent data on two quantitative variables on a scatter plot, and describe how the variables are related.
Grades 9-12
Do you agree with this alignment? - CCSS.Math.Content.HSS-ID.B.6c Fit a linear function for a scatter plot that suggests a linear association.
Grades 9-12
Do you agree with this alignment?
- Introduction to Variables and Graphs Handout (docx)
- Introduction to Variables and Graphs Handout (pdf)
- Introduction to Variables and Graphs Handout Answer Key (doc)
- Introduction to Variables and Graphs Handout Answer Key (pdf)
- Interpreting Graphs Worksheet (docx)
- Interpreting Graphs Worksheet (pdf)
- Interpreting Graphs Worksheet Answer Key (docx)
- Interpreting Graphs Worksheet Answer Key (pdf)
- Interpreting Graphs Homework (docx)
- Interpreting Graphs Homework (pdf)
- Interpreting Graphs Homework Answer Key (docx)
- Interpreting Graphs Homework Answer Key (pdf)
Students must know the difference between independent and dependent variables and have a basic understanding of how to calculate slope.
Graph Basics
The basic format of a linear graph is shown in Figure 1. Review this basic graph format with students.
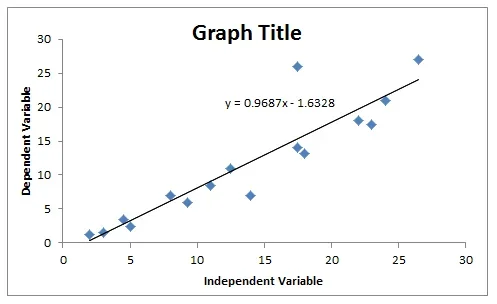 Figure 1. An example graph with its primary components labeled.Copyright 2013 Carleigh Samson, College of Engineering, University of Colorado Boulder
The x-axis generally displays the independent variable, while the y-axis shows the dependent variable. If a graph involves time, time is always an independent variable, since changes in time are not dependent on any other variables changing. The dependent variable is a variable that changes based on the change in the independent variable. The graph displays the relationship between these two variables; it shows how the dependent variable changes based on the change in the independent variable.
Figure 1 shows data points for each observed dependent variable value and its corresponding independent variable value. Each point can be displayed as (independent variable value, dependent variable value), for example (8, 7) is a data point on the Figure 1 graph. The graph also displays a best fit line for the data set. While students are not expected to calculate a best fit line, expect them to be able to identify it as the best possible line to capture the trend of the data. Make sure they understand that the line travels through the center of the linear trend of the data points.
The equation for the best fit line in Figure 1 is also displayed on the graph. The equation for a line is written in the form: y = mx +b, where m = slope and b = y-intercept. Since the equation of the best fit line in Figure 1 is y = 0.9687 – 1.6328, this means that the slope m = 0.9687 and the y-intercept b = -1.6328. If the line is extended to intersect with the y-axis, the y-intercept is the y-coordinate of that intersection point. The slope of the line is equal to the rate of change in the dependent variable divided by the rate of change of the independent variable. Other ways of stating this are that slope is equal to the change in y over the change in x, or that slope is equal to the rise over the run.
Given two points on a line, the slope of that line can be calculated. If the points are (x1, y1) and (x2, y2), slope is equal to:

For example, if you want to find the slope of the line on which the points (4.5, 6) and (8, 7.2) lie, the calculations would be:

Lesson Tips
Bring to the lesson discussion any number and/or types of example graphs to show and explain to students during the entire-class portion of the lesson. Incorporate any everyday graphs that you have recently seen or come across.
Discuss the concept of graphs via the Introduction/Motivation section content. Encourage students to discuss and offer their own ideas. Keep track of students' thinking by writing ideas on the board and organizing them in appropriate categories.
Show the class the Introduction to Variables and Graphs Handout (PDF)via projector and walk through each example noting the important elements that go into describing the relationship between variables. For each graph, write out a two- to three-sentence description utilizing the following words: dependent variable, independent variable, relationship, and rate of change. After the Introduction/Motivation content is presented, review all the vocabulary terms and their definitions with students.
Use the three graphs on the Interpreting Graphs Worksheet (PDF) to discuss with students how to appropriately describe the relationship between variables. In advance, go over these worksheet graphs and think through how you would describe them using language that is similar to the normal language you use in the classroom.
(In advance, make copies of the Introduction to Variables and Graphs Handout (PDF), one per student, and be ready, if possible, to project the same handout on the classroom board so all students can see it. In addition, make student copies of the Interpreting Graphs Worksheet (PDF)and Interpreting Graphs Homework (PDF).)
How often do you see graphs throughout your day or week? How much time do you spend reading or looking over a graph each week? What are some different graphs, or graphical representations of data? (Possible answers: Bar graphs, line graphs, scatter plots, pie charts, even Venn diagrams.)
Take a minute to think about the prevalence of graphs and charts in your daily lives. Write down on a piece of paper locations you might see graphs and charts, and what those graphs and charts might represent. (After a minute has passed, asked a few students to share their thoughts. Expected location answers: Newspapers, magazines, TV news, math class. Expect a wide range of answers for what the graphs and charts represent, for example weather data, economic data and many other topics.)
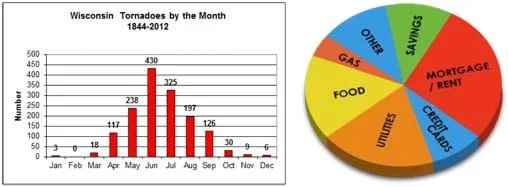 Example bar and pie graphs.Copyright (left) NOAA; (right) Maricopa County, AZ http://www.crh.noaa.gov/images/mkx/severe/WiTorMonthBar.gif http://www.maricopa.gov/youth/life/budget.aspx
When you see a graph or a chart in documents such as newspapers and magazines, the authors are trying to condense a massive amount of data into a clear and easy-to-understand visual representation. However, what is more important is that the author has made conscious decisions about how to create and display the graph. Our goal today is to think critically about graphs in order to understand everything their creators are trying to communicate, and clearly articulate the relationship between the variables presented.
Let's focus primarily on data that has somewhat linear trends. We are going to think about some of the details embedded in linear data so that we can use appropriate language to discuss the data with our peers.
(Pass out the Introduction to Variables and Graphs Handout (PDF). With the same handout projected on the classroom board for all students to see, go through each problem with students and fill in answers as they do the same on their handouts. Refer to the Introduction to Variables and Graphs Handout Answer Key (PDF)for answers. Continue on by presenting to students the content information in the Lesson Background section.) Following the lesson, students can apply their new knowledge in the associated activity Linear Models and Latex Explosion! and apply it towards invesigating and graphing the relationship between the wall thickness of latex and its strength.
- dependent variable
- The observed and recorded change in a value or variable based on the change in the independent variable.
- graph
- A diagram exhibiting the relationship between values and variables.
- independent variable
- A variable or value that is manipulated or changed.
- linear data
- Quantitative data that exhibits a line-like relationship between the dependent and independent variables when graphed.
- rate of change
- The change in the dependent variable relative to the change in the independent variable.
Pre-Lesson Assessment
Guided Practice: Make copies of the Introduction to Variables and Graphs Handout (PDF), one per student, and project it in the classroom so everyone can see it. Ask students to describe the relationship between variables in the first graph as best they can. Ask them to include the vocabulary terms in their descriptions: independent variable, dependent variable, linear data/linear relationship, and rate of change. Give students 1-2 minutes. Choose a few students to share their ideas and write these on the classroom board. Work off of their descriptions in order to revise and finalize the description using appropriate words. Do this same process for the rest of the handout graphs.
Post-Introduction Assessment
Group Work: Divide the class into groups and hand out the .Interpreting Graphs Worksheet (PDF) Ask students to fill in the blanks. With only five minutes left, ask them to write their answers on a poster board provided for the rest of the class to evaluate.
Lesson Summary Assessment
Class Review: As a class, discuss all worksheet answers. Ask student representatives from each group to share their answers. As a class, discuss any answer disputes; use the Interpreting Graphs Worksheet Answer Key (PDF)as a guide to settle any confusion. As student representatives present their answers, assess students by considering the following questions:
- Is the language students are using appropriate? Are students using the language you modeled at the beginning of class?
- Did they clearly describe all aspects of each graph?
- Did they answer possible questions in a relevant manner?
Homework
Individual Work: Assign students to complete the Interpreting Graphs Homework (PDF). Collect the homework the following day and grade it based on the Interpreting Graphs Homework Answer Key (PDF). While returning the graded homework, review as a class any questions that students answered incorrectly.
Look at a USA Today newspaper for examples of graphs and charts that present everyday topics students can relate to, or search for "USA Today graphs and charts" for some examples, such as a pie chart showing the breakdown of "Who cooks on Mother's Day?"
Have students express their creativity in illustrating data by creating interactive infographics at infogr.am, a free application enabling the creation of more than 30 chart types, anything from bubble charts and treemaps to simple pie charts.
- Latex Tubing and Hybrid Vehicles
- Latex and Hybrids: What's the Connection?
- Variables and Graphs: What's Our Story?
Contributors
Erik Bowen; Carleigh Samson
Supporting Program
VU Bioengineering RET Program, School of Engineering, Vanderbilt University
Acknowledgements
The contents of this digital library curriculum were developed under National Science Foundation RET grant nos. 0338092 and 0742871. However, these contents do not necessarily represent the policies of the NSF, and you should not assume endorsement by the federal government.
Copyright
2013 by Regents of the University of Colorado; original © 2006 Vanderbilt University