
Solar Power: When & Where Is Best?
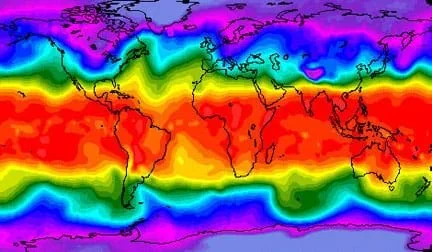 A NASA image of the Earth's surface temperatures ranging from blue (really cold) to orange/red (warm). The temperatures are related to how much solar energy is received.Copyright 1998 NASA
Students learn about solar energy and how to calculate the amount of solar energy available at a given location and time of day on Earth. The importance of determining incoming solar energy for solar devices is discussed.
As the market for solar power technologies grows, determining the amount solar energy available at a given location is important for maximizing energy efficiency of solar technologies and determining if solar power is even a possibility for a specific region. Engineers must understand the basics of solar energy and the Earth in order to incorporate solar energy into their designs.
After this lesson, students should be able to:
- Describe solar energy and why it changes with time and location.
- Calculate the amount of solar energy on Earth at a given time and location.
- Explain how solar energy is used in sustainable engineering applications.
- Explain why solar energy is becoming more prevalent.
- HS.1.2.a Reason quantitatively and use units to solve problems.
Grades 9-12
Do you agree with this alignment?
- There are costs, benefits, and consequences of exploration, development, and consumption of renewable and nonrenewable resources
Grades 9-12
Do you agree with this alignment?
- CCSS.Math.Content.HSN-Q.A Reason quantitatively and use units to solve problems.
Grades 9-12
Do you agree with this alignment?
- Energy resources can be renewable or nonrenewable.
Grades 9-12
Do you agree with this alignment?
- DCI.ESS2.D.9-12.6 The foundation for Earth's global climate systems is the electromagnetic radiation from the sun, as well as its reflection, absorption, storage, and redistribution among the atmosphere, ocean, and land systems, and this energy's re-radiation into space.
Grades 9-12
Do you agree with this alignment? - DCI.PS3.A.9-12.2 Energy is a quantitative property of a system that depends on the motion and interactions of matter and radiation within that system. That there is a single quantity called energy is due to the fact that a system's total energy is conserved, even as, within the system, energy is continually transferred from one object to another and between its various possible forms.
Grades 9-12
Do you agree with this alignment?
- Solar Power Presentation (ppt)
- Solar Power Presetation (pdf)
- Solar Power Energy Estimation Worksheet (doc)
- Solar Power Energy Estimation Worksheet (pdf)
- Solar Power Energy Estimation Worksheet Answers (doc)
- Solar Power Energy Estimation Worksheet Answers (pdf)
- Solar Energy Maps (doc)
- Solar Energy Maps (pdf)
Familiarity with basic Algebra skills.
Use the following script as you show the class the Solar Power Presentation (PPT). Then have students complete the Solar Power Energy Estimation Worksheet (PDF).
This lesson is a modified version of the more complicated method of determining solar radiation at a given location and time to introduce students to the concept of solar energy experienced on Earth. For a more detailed explanation of solar angles, refer to the Solar Angles and Tracking Systems lesson for photovoltaic modules.
Slide 1 [Solar Power] – Title slide.
Slide 2 [Why do we need solar power?] – In many locations of the world, like the Pacific Islands, natural resources such as fossil fuels are not available. Often, fossil fuels, such as coal and oil, are shipped to these areas to provide heat and electricity. Rather than transporting these fuels, we can generate both heat (for cooking and water heating) and electricity (with photovoltaic panels) with energy from the sun.
Slide 3 [Problems with fossil fuels] – Unfortunately, when we burn fossil fuels to provide heat and electricity, greenhouse gases such as carbon dioxide are released into the atmosphere. This intensifies the greenhouse effect, whereby more of the sun's heat is trapped in our atmosphere. The abundance of greenhouse gases in our atmosphere is responsible for many of the current changes we are seeing in our weather.
Slide 4 [Climate change consequences] – Climate change can cause many undesirable weather events such as more frequent severe storms (such as Superstorm Sandy), more frequent flooding (also caused by deforestation), and rising sea levels (due to more melting of the polar ice caps).
Slide 5 [Lack of natural resources] – When people use wood for cooking and heating water and homes, many trees must be harvested. If more trees are cut down than are planted and allowed to grow, this energy source is unsustainable. For example, the government of Haiti did not regulate the number of trees that its citizens were permitted to cut down. As a result, the forests in the country have been destroyed. Conversely, the government of the Dominican Republic monitored its country's forests. The border between the two countries shows this difference in forest management.
Slide 6 [Potential dangers of deforestation] – We need our forests to protect our soils; otherwise, erosion can occur. Erosion harms our natural habitats and deteriorates the soil to the point that it is no longer suitable for farming. The roots of trees also prevent rain from pouring down the surfaces of hills and mountains in vast quantities. When too many trees have been removed from hillsides, flash floods can occur, causing mudslides.
Slide 7 [Solar energy around the world] – Communities around the world use solar energy to heat homes and cook food when electricity is not available. In Peru, solar water heaters heat water for taking showers, and Trombe walls work like greenhouses to heat homes by absorbing the Sun's energy. In Mexico, this solar dish kitchen was designed to heat water and cook food by concentrating the Sun's energy using mirrors. This same concept is used with solar ovens for cooking food.
Slide 8 [Solar energy close to home] – We can get our electricity from solar energy using photovoltaic panels. The National Renewable Energy Lab (NREL) in Colorado researches methods for efficient electricity production from solar energy. Many U.S. homes use solar water heaters. The top, middle image shows how a solar water heater might be set up on someone's roof. The solar water heater faces south and is connected to a water storage tank. Cold water is pumped to the solar module while the water heated by the Sun is used in the home. Batch water heaters and flat-plate collectors are two popular types of solar water heaters.
Slide 9 [About half...] – Only about one-half of all incoming solar energy reaches the Earth's surface. The other half of the Sun's energy is reflected back into space by the planet's atmosphere or clouds, or it is absorbed by atmospheric gases, clouds and the Earth's surface. Solar energy is measured as solar power per unit area. Common units are Watts per meter squared. This is called irradiance. When we think about solar energy used in solar modules such as solar water heaters or photovoltaic (PV) panels, we use energy units of Watt-hours per square meter (called insolation) or just Watt hours (heat energy).
Slide 10 [The amount of...] – The amount of solar energy found on Earth changes with location. One indication of the amount of solar energy present is the temperature at the Earth's surface. So, the hotter it is, the more radiation we expect to find. This image shows different temperatures around the world, where the blue and purple colors indicate cold temperatures (and low solar radiation) and the red and orange colors indicate hotter temperatures (and more solar radiation). Notice that most of the Sun's energy is focused around the equator and it decreases as we approach the North and South Poles. Where are we on this map? What is the color? How does the amount of solar energy we get here compare with what is found on the equator or either pole?
Slide 11 [...and time] – The amount of solar energy we have access to not only depends on location, but it also depends on the time of day and the time of year. The angle of the sun relative to us relates to the amount of solar energy we experience. During the day, the Sun moves in the east-west direction. Throughout the year, the Sun also moves in the north-south direction. So, the amount of solar energy present in the middle of the day in the summer is quite different than the amount of solar energy we get in the afternoon during winter.
Slide 12 [How much...] – In the Northern Hemisphere, regardless of location, all solar modules needs to be set up to face south because that is the direction that captures the most sunshine at any time of the year. If you were located in the Southern Hemisphere, you would set up your solar module to face north. A tilt angle is the angle the solar module (in this case a solar water heater) needs to be set up from the ground (the horizon) in order to capture the most amount of solar energy. The tilt angle is the same angle as the latitude of the solar module's location.
For example, if we were located in Boulder, Colorado, the latitude is 40.1o so the solar water heater (or PV panel) would need to be tilted 40.1o from the ground facing south.
Slide 13 [How much...] – NOAA, the National Oceanic and Atmospheric Administration, has a website where we can find the exact coordinates of our location. When you open the website, place the red balloon on our location on the map and the output will give you the location in terms of latitude and longitude.
Slide 14 [How much...] – We also need to take note of the time of year and the time of day for which we want to find the solar energy potential.
Slide 15 [How much...] – This map illustrates the U.S. solar resource. In other words, it tells us how much solar energy we have access to at any location in the U.S. As previously mentioned, the amount of solar energy available changes throughout the year. This map presents the average amount of solar energy available over the course of an entire year. We will use maps that show the solar energy available during different months to find out how much is available where we live. The solar energy units are in kilowatt hours per meter squared per day (kWh/m2/day). We will see how to work with these units in a few minutes. The Sun.Copyright http://energyquest.ca.gov
Slide 16 [How much...] – We can access these solar maps from the National Renewable Energy Laboratory (NREL) website and find our month. (Note: If you do not have internet access to show the online maps, print out the attached Solar Energy Maps (PDF) in color and hand them out to students.)
Slide 17 [How much...] – When we find our corresponding month, say for example "May," we find our location on the map and use the color to determine how much solar energy we have in terms of kilowatt hours per meter squared per day (kWh/m2/day).
Slide 18 [How much...] – Now let's work with our worksheets to to determine how much solar energy potential we have where we live.
For worksheet answer explanations, refer to the Solar Power Energy Estimation Worksheet Answers (PDF).To find the latitude of your location (which is needed in order to determine the tilt angle of a solar module), visit the NOAA Solar Calculator web page or use any internet browser to search for the latitude of your location (latitude is measured in degrees). Access the solar energy maps at the NREL website (https://www.nrel.gov/gis/solar.html) or print out the Solar Energy Maps (PDF) in color as a student handout.
Did you know that the sun can help us heat and light our homes, cook our food, and heat our water? In fact, many communities do not have access to fossil fuels or wood, which are typically used to supply our energy needs, and so people rely on the Sun to do all of these things!
Many other communities that do have access to coal, natural gas, oil and wood have decided to use renewable energies such as solar power instead. Why? This is because the reliance on fossil fuels and wood is believed to lead to climate change, which has intensified severe weather events such as floods and storms. Sea levels could rise dramatically in the 21st century if a different course of action is not taken to supply our energy needs.
But just how much energy can we capture from the sun? What do you think it depends on? Today's lesson will give us an idea of how we can use the Sun's energy and how to determine how much solar energy is available to us. Following the lesson, consider conducting the associated activity Solar Water: Heat it Up! where students learn about the engineering design process as they design, build and test flat-plate solar water heaters!
As the demand for solar energy increases, engineers strive to make more efficient solar devices by capturing the most energy possible using the least amount of resources. Determining the available solar energy in a given location is essential for determining the efficiency of a solar device or establishing if solar power devices are even possible options. Today, you determined how much solar energy is available at our location, and this information can help you determine the efficiency and output of solar devices.
- angle of inclination
- The angle the solar water heater (or other solar module) is positioned above the horizontal. In this lesson, the angle is the same as your latitude.
- erosion
- The deterioration of rocks and soils due to wind and/or moving water. Erosion can be intensified by deforestation.
- fossil fuels
- Natural resources created by the decomposition of organic matter over millions of years.
- greenhouse gases
- Gases such as carbon dioxide that inhibit thermal energy from escaping the Earth's atmosphere. These gases are necessary to moderate the Earth's temperature, but an overabundance of them can increase global warming. These gases are released by the burning of fossil fuels.
- heat energy
- The energy entering the solar module in units of Watt-hours, also referred to as Qin.
- insolation
- The amount of solar radiation hitting a surface per unit of area over a given period of time. This is also referred to as solar irradiation, and is displayed in units of Wh/m^2 (watt-hours per meter squared).
- irradiance
- The amount of solar radiation hitting a surface per unit of area and displayed in units of W/m^2 (watts per meter squared).
- solar constant
- The maximum solar energy available on Earth per unit area. Measured at high noon (when the Sun is directly overhead) on the equator and found to be 1376 W/m^2.
- solar module
- A device that collects solar energy for heating or electrical applications. Examples include solar water heaters and photovoltaic (PV) panels.
- solar radiation
- The electromagnetic radiation (ultraviolet and near-infrared wavelengths) that is emitted by the Sun. This energy is captured and employed by useful applications such as heating and electricity.
- tilt angle
- The angle from the horizon that the solar module should be tilted. The angle should be equal to the latitude of the location. For example, if you are located at latitude of 40 degrees, the solar module should be tilted 40 degrees from the horizon.
- trombe wall
- A Sun-facing wall of a house separated from the outdoors by glass and an air space, which absorbs solar energy and releases it towards the interior at night.
Worksheet: Assign students to complete the Solar Power Energy Estimation Worksheet (PDF) as an in-class worksheet or homework. Review their answers to gauge their depth of understanding of the lesson content.
- Solar Power: When & Where Is Best?
Contributors
Odessa Gomez; Marissa H. Forbes
Supporting Program
Integrated Teaching and Learning Program, College of Engineering, University of Colorado Boulder
Acknowledgements
The contents of these digital library curricula were developed by the Integrated Teaching and Learning Program under National Science Foundation GK-12 grant no. 0338326. However, these contents do not necessarily represent the policies of the National Science Foundation, and you should not assume endorsement by the federal government.
Copyright
2012 by Regents of the University of Colorado