
A Closer Look at Oil and Energy Consumption
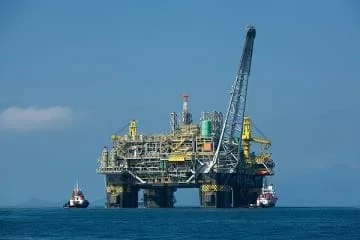 Students explore oil productionCopyright Agência Brasil. Wikipedia http://en.wikipedia.org/wiki/File:Oil_platform_P-51_%28Brazil%29.jpg
Students analyze international oil consumption and production data. They make several graphs to organize the data and draw conclusions about the overall use of oil in the world.
Engineers of all disciplines use data as a tool. Organizing data into tables and graphs helps them better understand problems and formulate solutions. For example, engineers often analyze data to understand energy consumption around the world; they put this data into graphs to analyze it visually. From examining data, engineers may: learn which problems impact the most people, notice patterns and trends, clearly communicate with others, forecast future demands, etc.
After this activity, students should be able to:
- Describe the consumption and production of oil and energy in the U.S.
- Create and interpret pie and bar graphs, including practice in plotting and ranking data.
- Understand the role of engineering to create new technologies for the production and consumption of oil and alternative energy sources
- 3.3.1 Visual displays are used to describe data.
Grade 3
Do you agree with this alignment? - 3.3.1.a.i Draw a scaled picture graph and a scaled bar graph to represent a data set with several categories.
Grade 3
Do you agree with this alignment?
- Identify and describe the variety of energy sources
Grade 4
Do you agree with this alignment?
- CCSS.Math.Content.3.MD.B.3 Draw a scaled picture graph and a scaled bar graph to represent a data set with several categories. Solve one- and two-step "how many more" and "how many less" problems using information presented in scaled bar graphs.
Grade 3
Do you agree with this alignment? - CCSS.Math.Content.5.G.A.2 Represent real world and mathematical problems by graphing points in the first quadrant of the coordinate plane, and interpret coordinate values of points in the context of the situation.
Grade 5
Do you agree with this alignment?
- The use of technology affects the environment in good and bad ways.
Grades 3-5
Do you agree with this alignment? - Energy comes in different forms.
Grades 3-5
Do you agree with this alignment?
- 4-ESS3-1 Obtain and combine information to describe that energy and fuels are derived from natural resources and their uses affect the environment.
Grade 4
This resource focuses on the following Three Dimensional Learning aspects of NGSS:
Science & Engineering Practices- Obtain and combine information from books and other reliable media to explain phenomena.Do you agree with this alignment?
Disciplinary Core Ideas- Energy and fuels that humans use are derived from natural sources, and their use affects the environment in multiple ways. Some resources are renewable over time, and others are not.Do you agree with this alignment?
Crosscutting Concepts- Cause and effect relationships are routinely identified and used to explain change.Do you agree with this alignment?
- Knowledge of relevant scientific concepts and research findings is important in engineering.Do you agree with this alignment?
- Over time, people's needs and wants change, as do their demands for new and improved technologies.Do you agree with this alignment?
Do you agree with this alignment? - Obtain and combine information from books and other reliable media to explain phenomena.
Each group should have:
- 1 12" ruler
- 1 copy of the United States Energy Consumption Graph Paper (Part 1) (PDF)
- 1 copy of the World Energy Consumption Graph Paper (Part 2) (PDF)
- pencil
- variety of markers, crayons, or colored pencils
- United States Energy Consumption Datasheet (docx)
- United States Energy Consumption Datasheet (pdf)
- World Energy Consumption and Production Datasheet (docx)
- World Energy Consumption and Production Datasheet (pdf)
- World Energy Consumption and Production Datasheet (Advanced) (docx)
- World Energy Consumption and Production Datasheet (Advanced) (pdf)
- World Oil Consumption Over Time Datasheet (Advanced) (docx)
- World Oil Consumption Over Time Datasheet (Advanced) (pdf)
- United States Energy Consumption Graph Paper (Part 1) (docx)
- United States Energy Consumption Graph Paper (Part 1) (pdf)
- World Energy Consumption Graph Paper (Part 2) (docx)
- World Energy Consumption Graph Paper (Part 2) (pdf)
The United States of America is mainly dependant on oil and coal for energy to run our cars, heat our homes, and give us electricity to make our appliances and televisions work. Unfortunately, the use of oil and coal also causes pollution, and it is predicted that we will run out of both of these resources in 40-60 years. Although, engineers are working to develop new and cleaner ways to produce energy, people still need oil for everyday life.
In 2019, the U.S. alone used 20 million barrels of oil a day, even though the U.S. only produced 12.5 million barrels a day. So, where does the rest of the oil come from that we use every day? Do we import (buy) it from another country? Will we run out? What will happen when we run out? Because oil is not a renewable energy source like wind or water, it is predicted that we will run out of oil as early as 2045. How can we make sure that we never run out of energy to heat our homes and cook our foods? Engineers need to understand these questions and more so that they can develop the technology to ensure we have energy resources for years to come.
The production of oil and the politics surrounding it are very complicated. There is high demand from different countries to buy and sell oil. This lesson focuses on plotting, graphing, and comparing oil production, exportation and importation around the world. You will also learn about U.S. oil needs by studying the difference between the amount produced and the amount consumed in a single year.
Before the Activity
Print all necessary attachments so that each group has one each of the following:
- United States Energy Consumption Datasheet (PDF),
- World Energy Consumption and Production Datasheet (PDF),
- World Oil Consumption Over Time Datasheet (PDF),
- Energy consumption of the United States graph paper (PDF), and
- World energy consumption graph paper (PDF).
With the Students
- Discuss oil production, consumption and uses with students. Tell students that engineers often analyze data to understand how much oil we need and how much oil we actually use. Explain to students that they are going to be engineers for a day and study numbers about world oil production and consumption.
- Have students make some predictions to the following questions before you begin the activity. Record their answers on the board.
- Which country uses the most oil?
- Which country produces the most oil?
Part One
- Divide the class into groups of two students each.
- Give each student the United States Energy Consumption Datasheet (PDF)or show it on an overhead projector.
- Have students convert this data to a bar graph. (Use the Energy Consumption of the United States graph paper (PDF) attachment)
- Discuss the results of their graphs.
- Which type of fuel is used most in the U.S.? (Answer: Oil. In 2003, the U.S. used 40.7% of the world's oil consumption, or 20 of the 49.1 million barrels used per day.)
- Which is used the least? (Answer: Solar energy supplies only 2% of the nation's energy need.)
- Are any of the energy sources renewable? Which ones? (Answer: Hydropower [energy from water] is the only renewable energy source on our graph.)
Part Two
- Pass out the World Energy Consumption and Production Datasheets (PDF) or show it on an overhead projector.
- Have students create a bar graph listing the top world oil consumers and the top world oil producers. (Use the World Energy Consumption graph paper (PDF) attachment.)
- Discuss the results of the graphs.
- Which country consumes the most oil? (Answer: The U.S.)
- Which country consumes the least? (Answer: In 2003, Brazil, France and Mexico all used 2.1 million gallons per day; however, other countries may have used less but were not included in the data.)
- Compare how much oil the U.S. consumes vs. how much it produces. (Answer: The U.S. consumes 20 million barrels a day and produces only 7.9). How much oil does the U.S. need? (Answer: The U.S. needs 12 million barrels of oil a day). From where does this oil come? (Answer: We import it.)
- Finally, discuss the implications of U.S. oil usage. What happens to the oil after we burn it? (Answers will vary, but may include: it can cause air pollution, it creates energy.) Is oil a renewable energy source? (Answer: No) Do students think we will run out of oil?
Part Three
- Assign students to write persuasive letters to their community about U.S. oil use. They should give three facts in their letter and describe whether they think people should use less oil or not.
Pre-Activity Assessment
Prediction: Tell students that they are going to look at some numbers about world oil production and consumption. Tell them that you would like them to make some predictions before the activity begins. Record their predictions on the board. Ask the following:
- What country uses the most oil?
- What country produces the most oil?
Activity Embedded Assessment
Graphing/Discussion: After students complete the graphing exercises, discuss the production and consumption of oil around the world using the following questions:
- Which type of fuel is used most in the U.S.? (Answer: Oil. In 2003, the U.S. used 40.7% of the world's oil consumption, or 20 of the 49.1 million barrels used per day.)
- Which is used the least? (Answer: Solar energy supplies only 2% of the nation's energy need.)
- Are any of the energy sources renewable? Which ones? (Answer: Hydropower [energy from water] is the only renewable energy source on our graph.)
- Which country consumes the most oil? (Answer: The U.S.)
- Which country consumes the least? (Answer: In 2003, Brazil, France and Mexico all used 2.1 million gallons per day; however, other countries may have used less but were not included in the data.)
- Compare how much oil the U.S. consumes to how much it produces. (Answer: We consume 20 million barrels a day and produce only about 9).
- How much oil does the U.S. need? (Answer: The U.S. needs 12 million barrels of oil a day.)
- Where does this oil come from? (Answer: We import it.)
Post-Activity Assessment
Predictions Revisited: Go back to student predictions on the board and compare them with the answers students have found.
- Prediction: What country uses the most oil? (Answer: The U.S. uses 20.5 million barrels per day.)
- Prediction: What country produces the most oil? (Answer: Saudi Arabia produces almost 10 million barrels per day.)
Persuasive Letter: Have students write persuasive letters to their community about oil use in our country. Students should give three facts in their letter and describe whether they think people should use less oil or not.
If students are having trouble creating graphs, conduct the activity as a class or in groups; or provide overhead transparencies showing example bar graphs.
If the activity takes too long, have students make just one graph.
As a counterpoint to this lesson and activity about one type of fossil fuel (oil), have students explore the U.S. usage and production of renewable energy sources: What does renewable energy mean? (Answer: Energy drawn or created from an endless source.) Find statistics and historical trends. Describe the advantages and disadvantages of the various renewable energy sources. (Include: Wind, water [dams, ocean], solar, geothermal, biomass.) From where will our future energy come?
World Geography: As a class, or in groups, locate the countries listed in the data set.
Have students convert tabular data to pie charts either by hand or using a computer.
For advanced students: instruct them create a line graph of world oil consumption over time using the World Oil Consumption Over Time Datasheet (Advanced) (PDF) attachment; or create graphs of top world imports and exports with data found in the World Energy Consumption and Production Data (Advanced) (PDF) attachment.
http://www.eia.doe.gov/emeu/cabs/nonopec.html
http://www.eia.doe.gov/emeu/cabs/usa.html
http://www.eia.doe.gov/cneaf/solar.renewables/page/rea_data/figh1.html
http://www.eia.doe.gov/emeu/cabs/topworldtables3_4.html
http://www.eia.doe.gov/mer/pdf/pages/sec11_3.pdf
http://www4.uwsp.edu/cnr/wcee/keep/Mod1/Flow/graphs.htm
- Non-renewable Energy: Fossil Fuels
- Harvesting Oil from the Earth
- Model Earth Core Samples: What’s Down There?
- A Closer Look at Oil and Energy Consumption
- Powering the U.S.
- Harvesting Oil from the Earth
Contributors
Jessica Todd; Melissa Straten; Malinda Schaefer Zarske; Janet Yowell
Supporting Program
Integrated Teaching and Learning Program, College of Engineering, University of Colorado Boulder
Acknowledgements
The contents of this digital library curriculum were developed under a grant from the Fund for the Improvement of Postsecondary Education (FIPSE), U.S. Department of Education and National Science Foundation GK-12 grant no. 0338326. However, these contents do not necessarily represent the policies of the Department of Education or National Science Foundation, and you should not assume endorsement by the federal government.
Copyright
2004 by Regents of the University of Colorado.