
Map That Habitat
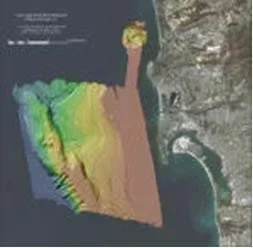 A color-coded, shaded-relief bathymetry map of offshore San Diego, CA.Copyright U.S. Geological Survey http://walrus.wr.usgs.gov/pacmaps/sd-bathy.html
Historically, seafloor mapping occurred with a simple data collection method: soundings. Soundings are taken by dropping a weight with a pre-measured rope off the side of a boat and noting the measurement on the rope when the weight hits the bottom. In this activity, student teams replicate the creation of seafloor bathymetry by taking a simplified form of soundings of an unseen seafloor model inside a shoebox and translating their collected data into a visualization of the topography, enabling them to better understand and appreciate modern remote sensing.
In this introduction to seafloor topography, students experience how the ocean floor used to be mapped prior to recent engineering advances in remote sensing and underwater vehicles. Students learn how to take sounding measurements as well as the difficulties that arise from this process. This activity leads into a discussion of the current technologies used in measuring depth and how these technologies have improved over time.
After this activity, students should be able to:
- Explain the purpose and reasons for taking blind depth measurements (soundings and remote sensing).
- Describe the concept of remote sensing.
- Analyze and interpret depth data into a description of 3D topography.
- Draw final conclusions regarding habitat mapping and the collection of spatial data.
- STEL-8L Interpret the accuracy of information collected.
Grades 6-8
Do you agree with this alignment? - STEL-8M Use instruments to gather data on the performance of everyday products.
Grades 6-8
Do you agree with this alignment?
- 8.E.1 Understand the hydrosphere and the impact of humans on local systems and the effects of the hydrosphere on humans.
Grade 8
Do you agree with this alignment? - 8.E.1.1 Explain the structure of the hydrosphere including:
- Water distribution on earth
- Local river basins and water availability
Grade 8
Do you agree with this alignment?
Each group needs:
- shoebox with lid; in the lid make a grid formation (10 rows x 10 columns; see the Bathymetry Measurement Worksheet (PDF)) of small holes that are the diameter of the sounding stick
- a "seafloor" to be fixed into the bottom of box; make this topographic relief from plastic, hardened clay, rocks, etc.
- sounding stick; use a thin rod that is longer than the box depth
- data collection sheets to create a bathymetry profile, ~10 per group
- scissors
- pencil
- ruler
- glue or tape
Many technologies are used to study seafloor geology and habitats. Information provided by these technologies helps scientists understand seafloor topography, the geological processes that shape the Earth, and habitats that support marine organisms.
Understanding the shape of the seafloor is crucial to advancing our knowledge of the ocean. The marine environment is unique and requires technologies that can use sound to gather information since there is little light underwater. The seafloor is characterized using underwater sound and acoustical systems. These advance systems are usually mounted or towed behind large survey vessels.
Historically, seafloor mapping occurred with a simpler data collection method: soundings. Soundings are taken by repeatedly dropping a weight with a pre-measured rope off the side of a boat and noting the measurement on the rope when the weight hits the bottom. In today's activity, you will replicate the creation of seafloor bathymetry (depth) by taking a simplified form of soundings in the classroom.
Before the Activity
- Gather materials and make the boxes, one per team. Create different bathymetry profiles for each box that include seafloor geological features such as seamounts, trenches, ridges, plains and volcanoes. Make sure the seafloors are securely fixed to the bottom of the boxes and that lids are on tight so students cannot open them (no peeking!).
- Make copies of the Bathymetry Profiles Worksheet (PDF), one per team.
- Make enough copies the profile data collection sheet, the Bathymetry Profiles Worksheet (PDF), so that each group has one sheet per box lid row of holes.
With the Students: Pre-Activity Questions
- What type of data do we want from ocean habitats? (Answers: Depth, sediment type, animals, salinity, temperature, O2, currents, nutrients, etc.)
- Why is knowing what the seafloor looks like important? (Answer: Structure for habitat/animal congregations, commercial uses [resource extracton], navigation safety, etc.)
- What are some seafloor mapping technologies? (Answers: Sonar, soundings, remote sensing, etc. See the Background section for more information.)
- What are some different types of seafloor features? (Answers: Trenches, volcanoes, ridges, abyssal plains.)
With the Students: Soundings Activity
- Provide instructions for the activity.
- In groups of two or more, have students begin by inserting their sounding sticks into row 1 column 1 of the box lid. Note how far the stick entered into the box, remove the rod, and measure that distance with a ruler. Plot that depth on row 1 of the profile sheet. Continue across the row. When row 2 is started, start a new profile sheet and repeat. Repeat for all rows.
- Connect the measurements on each profile sheet with a line, creating a profile of the bathymetry at each row. Then cut out the profiles, leaving the bottom of the page intact, to be used to attach the profile to the bathymetry sheet.
- Each profile (or row) corresponds with a line on the bathymetry sheet. Tape or glue the cut-out profiles onto the bathymetry sheet on the corresponding profile lines.
- Through examination of their data, have each group attempt to identify what seafloor feature(s) they have mapped and describe this on their bathymetry worksheet in the space provided.
- Conclude with a class discussion to share and compare results and conclusions.
- remote sensing
- The measurement or acquisition of information of some property of an object or phenomenon by a recording device that is not in physical or intimate contact with the object or phenomenon under study, for example the utilization at a distance (as from aircraft, spacecraft or ship) of any device and its display for gathering information pertinent to the environment, such as measurements of force fields, electromagnetic radiation or acoustic energy. The technique employs such devices as cameras, lasers, and radio frequency receivers, radar systems, sonar, seismographs, gravimeters, magnetometers and scintillation counters.
- habitat
- The area or environment where an organism or ecological community normally lives or occurs.
- spatial location
- Where an object or animal is located in space.
- soundings
- Water shallow enough for depth measurements.
Pre-Activity Assessment
Questions: Engage students in a discussion to assess their prior knowledge of remote sensing and seafloor bathymetry. Ask inquiry-based, open-ended questions such as the following:
- What technologies are available for mapping ocean geology?
- What is remote sensing?
- How does remote sensing work?
- What kind of data are collected from remote sensing?
- How is the data collected from remote sensing used in fields other than oceanography?
Activity Embedded Assessment
Observations: As student teams work together to take and record sounding measurements, observe their data gathering activities. Are they correctly following the outlined procedure? Do they understand the purpose of the measurements?
Post-Activity Assessment:
Writing: Assign students to write journal entries that describe remote sensing, its real-world applicatinos, and its importance. Review their writing to determine whether they gained an understanding of the importance of remote sensing, and whether they were able to draw final conclusions regarding habitat mapping and the collection of spacial data.
Contributors
Kimberly Goetz; Jonelle Stovall; Melissa Sanderson; Heather Kerkering
Supporting Program
Engineering K-PhD Program, Pratt School of Engineering, Duke University
Acknowledgements
This content was developed by the MUSIC (Math Understanding through Science Integrated with Curriculum) Program in the Pratt School of Engineering at Duke University under National Science Foundation GK-12 grant no. DGE 0338262. However, these contents do not necessarily represent the policies of the NSF, and you should not assume endorsement by the federal government.
Copyright
2013 by Regents of the University of Colorado; original © 2004 Duke University