
PhET Roller Coaster Simulation: Modeling Energy in a Coaster
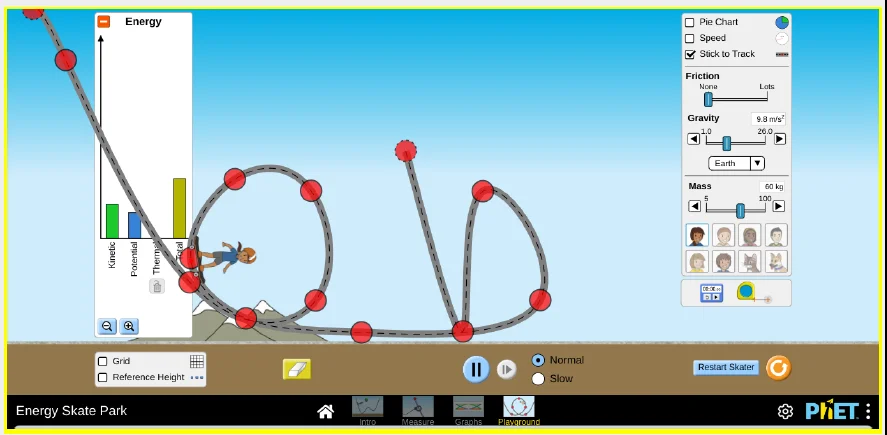 A roller coaster recreated in PhET Energy Skate Park, with the energy bar graph showing potential, kinetic, thermal, and total energy.Copyright Original screenshot created by the author using the free PhET Energy Skate Park simulation (PhET Interactive Simulations, University of Colorado Boulder), used under a Creative Commons CC-BY 4.0 license; https://phet.colorado.edu/en/simulations/energy-skate-park.
Building on their previous investigations of potential and kinetic energy, students use the PhET Energy Skate Park simulation to investigate energy transformations and the conservation of energy within a roller coaster system. Working in small groups, students create simulated versions of the paper roller coasters they designed and tested in the How Does a Roller Coaster Work activity and use real-time energy bar graphs to visualize changes in potential, kinetic, thermal, and total energy. Students conduct controlled investigations by systematically varying starting height, rider mass, and friction, collecting and analyzing graphical data to identify how each variable affects energy transformations within the system. Through these investigations, students observe how potential energy transforms into kinetic energy as the rider descends, how friction transforms mechanical energy into thermal energy, and how total energy remains conserved. Students use evidence from their simulations to explain what happens to energy as the rider moves, slows down, and stops. Their findings provide evidence for refining their roller coaster system models in the culminating activity.
Before committing time and resources to costly physical prototypes, engineers often use computational models and simulations to predict how a design will perform. These virtual test environments allow engineers to change design variables, run repeated trials, collect data, and identify potential problems before constructing and testing a physical system. For example, roller coaster engineers use simulations to predict how track geometry, starting height, and friction affect a coaster's motion and energy. Engineers use simulations to track how energy is transferred and transformed throughout a system and evaluate design performance and safety.
After this activity, students should be able to:
- Use the PhET Energy Skate Park simulation to create a simulated version of their roller coaster design and visualize changes in potential, kinetic, thermal, and total energy using real-time energy graphs.
- Conduct controlled investigations by systematically varying starting height, rider mass, and friction, collecting and interpreting graphical data to explain how each variable affects energy within the system.
- Use evidence from simulation data and graphs to explain how potential and kinetic energy transform into one another, how friction transforms mechanical energy into thermal energy, and how total energy is conserved.
- Apply evidence from the simulation to explain energy changes observed in their physical roller coasters and identify information that can strengthen their final system models.
- STEL-7Q Apply the technology and engineering design process.
Grades 6-8
Do you agree with this alignment? - STEL-7R Refine design solutions to address criteria and constraints.
Grades 6-8
Do you agree with this alignment?
- MS-ETS1-1 Define the criteria and constraints of a design problem with sufficient precision to ensure a successful solution, taking into account relevant scientific principles and potential impacts on people and the natural environment that may limit possible solutions.
Grades 6-8
This resource focuses on the following Three Dimensional Learning aspects of NGSS:
Science & Engineering Practices- Define a design problem that can be solved through the development of an object, tool, process or system and includes multiple criteria and constraints, including scientific knowledge that may limit possible solutions.Do you agree with this alignment?
Disciplinary Core Ideas- The more precisely a design task's criteria and constraints can be defined, the more likely it is that the designed solution will be successful. Specification of constraints includes consideration of scientific principles and other relevant knowledge that is likely to limit possible solutions.Do you agree with this alignment?
Crosscutting Concepts- The uses of technologies and any limitations on their use are driven by individual or societal needs, desires, and values; by the findings of scientific research; and by differences in such factors as climate, natural resources, and economic conditions.Do you agree with this alignment?
- All human activity draws on natural resources and has both short and long-term consequences, positive as well as negative, for the health of people and the natural environment.Do you agree with this alignment?
Do you agree with this alignment? - Define a design problem that can be solved through the development of an object, tool, process or system and includes multiple criteria and constraints, including scientific knowledge that may limit possible solutions.
- MS-ETS1-2 Evaluate competing design solutions using a systematic process to determine how well they meet the criteria and constraints of the problem.
Grades 6-8
This resource focuses on the following Three Dimensional Learning aspects of NGSS:
Science & Engineering Practices- Evaluate competing design solutions based on jointly developed and agreed-upon design criteria.Do you agree with this alignment?
Disciplinary Core Ideas- There are systematic processes for evaluating solutions with respect to how well they meet the criteria and constraints of a problem.Do you agree with this alignment?
Do you agree with this alignment? - Evaluate competing design solutions based on jointly developed and agreed-upon design criteria.
- MS-ETS1-4 Develop a model to generate data for iterative testing and modification of a proposed object, tool, or process such that an optimal design can be achieved.
Grades 6-8
This resource focuses on the following Three Dimensional Learning aspects of NGSS:
Science & Engineering Practices- Develop a model to generate data to test ideas about designed systems, including those representing inputs and outputs.Do you agree with this alignment?
Disciplinary Core Ideas- Models of all kinds are important for testing solutions.Do you agree with this alignment?
- The iterative process of testing the most promising solutions and modifying what is proposed on the basis of the test results leads to greater refinement and ultimately to an optimal solution.Do you agree with this alignment?
Do you agree with this alignment? - Develop a model to generate data to test ideas about designed systems, including those representing inputs and outputs.
- MS-PS3-1 Construct and interpret graphical displays of data to describe the relationships of kinetic energy to the mass of an object and to the speed of an object.
Grades 6-8
This resource focuses on the following Three Dimensional Learning aspects of NGSS:
Science & Engineering Practices- Construct and interpret graphical displays of data to identify linear and nonlinear relationships.Do you agree with this alignment?
Disciplinary Core Ideas- Motion energy is properly called kinetic energy; it is proportional to the mass of the moving object and grows with the square of its speed.Do you agree with this alignment?
Crosscutting Concepts- Proportional relationships (e.g. speed as the ratio of distance traveled to time taken) among different types of quantities provide information about the magnitude of properties and processes.Do you agree with this alignment?
Do you agree with this alignment? - Construct and interpret graphical displays of data to identify linear and nonlinear relationships.
- MS-PS3-5 Construct, use, and present arguments to support the claim that when the kinetic energy of an object changes, energy is transferred to or from the object.
Grades 6-8
This resource focuses on the following Three Dimensional Learning aspects of NGSS:
Science & Engineering Practices- Construct, use, and present oral and written arguments supported by empirical evidence and scientific reasoning to support or refute an explanation or a model for a phenomenon.Do you agree with this alignment?
- Science knowledge is based upon logical and conceptual connections between evidence and explanations.Do you agree with this alignment?
Disciplinary Core Ideas- When the motion energy of an object changes, there is inevitably some other change in energy at the same time.Do you agree with this alignment?
Crosscutting Concepts- Energy may take different forms (e.g. energy in fields, thermal energy, energy of motion).Do you agree with this alignment?
Do you agree with this alignment? - Construct, use, and present oral and written arguments supported by empirical evidence and scientific reasoning to support or refute an explanation or a model for a phenomenon.
- 8.2.1.a Use computational thinking to analyze data about the relationship between the mass and speed of objects and the relative amount of kinetic energy of the objects.
Grade 8
Do you agree with this alignment? - 8.2.3 Engage in argument to identify the strongest evidence that supports the claim that the kinetic energy of an object changes as energy is transferred to or from the object. Examples could include observing temperature changes as a result of friction, applying force to an object, or releasing potential energy from an object.
Grade 8
Do you agree with this alignment?
Each group needs:
- 1 laptop or Chromebook with internet access and an up-to-date browser
- access to the free PhET Energy Skate Park simulation (https://phet.colorado.edu/en/simulations/energy-skate-park; no login or download required)
- a photograph, sketch and/or initial system model of the paper roller coaster designed and constructed in the How Does a Roller Coaster Work activity
- PhET Roller Coaster Simulation Worksheet (PDF) (1 per student)
- (optional) student headphones
For the entire class to share:
- 1 internet-enabled laptop or computer with projector or digital screen to demonstrate the simulation controls
Students should:
- Have completed the Can Crusher Challenge, Car on a Ramp Challenge, and How Does a Roller Coaster Work activities.
- Understand that potential energy depends on an object's mass and height and that kinetic energy depends on its mass and speed.
- Recognize that potential and kinetic energy transform into one another as objects move through a system.
- Have experience constructing system models that identify physical components, illustrate motion, and represent energy transformations.
- Be familiar with conducting controlled investigations, collecting data, and using experimental evidence to explain cause-and-effect relationships.
- Have basic experience navigating a web browser on a laptop or Chromebook.
(Before speaking, open the PhET Energy Skate Park simulation, select the Playground screen and project it on the classroom board. Have students' photos or sketches of the paper roller coasters they built earlier in the How Does a Roller Coaster Work activity, along with their initial system models, available.)
Let's think back to the roller coaster you engineered in our last activity. You built a track out of paper, sent a marble through it, and made a model predicting where the marble sped up and where it slowed down. But you may have noticed that the marble slowed down or stopped as it moved through the track. So, here's a question we couldn't fully answer then: When the marble slowed down or stopped, what happened to its energy? Did the energy just disappear? (Pause and allow students to share their ideas. Possible answers: It ran out of energy; the energy went into the track; friction made it slow down.)
Think back to the system model you developed. You identified where the marble had potential and kinetic energy and explained how its motion changed throughout the track. What additional evidence would help you explain what happened to its energy when it slowed down or stopped? (Allow students to share their ideas.)
The problem before was that we couldn't directly observe the energy; we could only observe what the marble did and use that evidence to make predictions about its energy. Today, you get X-ray vision. We're going to create a simulated version of your roller coaster in a simulation called Energy Skate Park and turn on graphs that let us visualize how the rider's potential, kinetic, thermal, and total energy change as the rider moves. (Release the skater on a simple hill, then click the energy bar-graph icon so the bars appear. Let students watch the potential-energy bar shrink and the kinetic-energy bar grow.)
Watch what happens to these bars as the rider drops. What do you notice? Now watch what happens when I add friction to the track. (Turn on friction and let the skater gradually slow and stop.)
The rider stopped, but keep your eye on that total-energy bar. What do you notice? Your job today, working with your group, is to create a simulated version of your paper roller coaster, turn on these graphs, and run a series of tests by systematically changing starting height, rider mass, and friction to collect data that can help us finally answer our question: What happens to the energy as the rider moves and eventually slows down?
As you investigate, pay attention to what the graphs reveal about energy transformations and conservation that you couldn't directly observe in your physical roller coaster. You'll use this evidence to strengthen your roller coaster system model in our final activity.
You are the engineers running the simulation. Let's build!
Background
Energy Transformations and Conservation of Energy
Building on the Can Crusher Challenge, Car on a Ramp Challenge, and How Does a Roller Coaster Work activities, this investigation extends students' understanding of potential and kinetic energy through computational modeling. In previous activities, students investigated how mass and height affect energy and motion, explored energy transformations within physical systems, and developed models to explain their observations. Using the PhET Energy Skate Park simulation, students can now visualize changes in potential, kinetic, thermal, and total energy through real-time graphical displays. These visualizations provide evidence for explaining energy transformations, investigating the effects of friction, and developing an understanding of the conservation of energy.
When a rider is raised to a starting height, an external force does work on the rider-Earth system, increasing its gravitational potential energy. Gravitational potential energy is a type of potential energy associated with an object's position in a gravitational field. For teacher reference, potential energy (PE) can be represented as:
PE = mgh
where m is mass, g is gravitational acceleration (approximately 9.8 m/s² on Earth), and h is height above a reference point. Increasing either the rider's mass or starting height increases the potential energy available in the system. Students do not need to use this equation during the activity; instead, they investigate these relationships qualitatively through the simulation.
When the rider is released, gravity accelerates the rider down the track. As height decreases, potential energy transforms into kinetic energy (KE), the energy of motion. Kinetic energy depends on the rider's mass and speed and can be represented as:
KE = ½mv²
where m is mass and v is speed. Students are not expected to calculate kinetic energy. Instead, they use the rider's motion and the simulation's energy displays to observe that kinetic energy generally increases as the rider speeds up and decreases as the rider slows down.
Conservation of Energy and Friction
On a frictionless track, potential energy and kinetic energy continually transform into one another. As the rider travels downhill, potential energy decreases while kinetic energy increases. As the rider travels uphill, kinetic energy decreases while potential energy increases. Although the amounts of potential and kinetic energy change, their combined total remains constant in an ideal system without friction or other energy losses. At lower points along the track, the rider generally moves faster and has more kinetic energy, while at higher points, the rider generally moves slower and has more potential energy.
Introducing friction allows students to investigate what happens in a system that more closely resembles their physical paper roller coasters. As the rider moves along a track with friction, some mechanical energy transforms into thermal energy. Consequently, the rider generally reaches progressively lower heights and may eventually come to a stop. Although the mechanical energy available for motion decreases, the energy has not disappeared. When thermal energy is included, the total energy of the modeled system remains constant.
This demonstrates the law of conservation of energy: Energy cannot be created or destroyed, but it can be transferred between objects or transformed from one form into another. In a closed system, the total amount of energy remains constant.
Investigating Variables Through Computational Modeling
The simulation allows students to investigate how changing individual variables affects energy within a system. Increasing starting height increases the rider's initial potential energy. Increasing rider mass increases the amounts of potential and kinetic energy at corresponding positions under otherwise identical conditions, although changing mass alone does not cause the rider to travel faster at a given location. Increasing friction causes mechanical energy to transform into thermal energy more rapidly.
By changing one variable at a time, students can identify cause-and-effect relationships and use graphical evidence to explain how energy changes throughout the system.
On the PhET Energy Skate Park Playground screen, students can construct a custom track that approximates the roller coaster they designed in the previous activity. The simulation models a skater moving along a track rather than a marble rolling through a paper roller coaster, but both systems illustrate relationships among height, motion, and energy. The energy bar graph and pie chart display changes in potential, kinetic, thermal, and total energy as the rider moves. Controls for mass, friction, and gravity allow students to manipulate variables, while tools such as the grid, speedometer, and slow-motion feature support closer observation and comparison.
Using Simulation Evidence to Refine System Models
This activity emphasizes evidence gathering, graphical data analysis, and scientific explanation rather than constructing a new physical model. Students use repeated trials and graphical evidence to identify patterns and explain what happens to energy as a rider moves, slows down, and eventually stops.
Students then compare their simulation results with observations and predictions from their original paper roller coaster investigations. By identifying where potential and kinetic energy transform into one another, how friction contributes to thermal energy, and why total energy remains conserved, students develop a more complete understanding of energy within a mechanical system.
This evidence prepares students for the culminating Roller Coaster Final Model activity, in which they refine their original system models and construct scientific explanations describing how energy is transferred, transformed, and conserved throughout their roller coaster systems.
Before the Activity
- Test student devices and confirm that the PhET Energy Skate Park simulation loads properly. Bookmark the simulation and verify that the school network permits access to phet.colorado.edu.
- Preview the simulation to become familiar with the Playground screen, track-building tools, mass and friction controls, energy bar graph, pie chart, grid, and reset options.
- Set up a laptop or computer with internet access and a projector or digital display to demonstrate the simulation controls.
- Make copies of the PhET Roller Coaster Simulation Worksheet (PDF) (1 per student).
- Have each group retrieve photographs, sketches, and initial system models of the paper roller coasters they designed and built in the How Does a Roller Coaster Work activity to use as references when creating simulated versions of their designs and comparing their original predictions and explanations with evidence collected during the simulation.
- Establish a method for students to save screenshots of their simulated roller coasters and energy graphs, along with their completed worksheets, for use in the culminating Roller Coaster Final Model activity.
During the Activity
Part 1: Revisit the Phenomenon (10 minutes)
- Introduce the objective: To recreate a roller coaster in the skate park simulator and use data to explain how the energy changes over time.
- Revisit the paper coaster phenomenon: Ask groups where their marble was fastest and slowest, and pose the driving questions:
- When the marble slowed down or stopped, what happened to its energy?
- Did the energy disappear or transform into another form?
- Optional: Have students review their initial roller coaster system models from the previous activity. Ask them to identify one question about energy transformations that their models could not fully explain.
- Have groups open the PhET Energy Skate Park simulation and spend a few minutes on the Playground screen exploring how to construct a track, release the skater, and display the energy bar graph, grid, and speedometer.
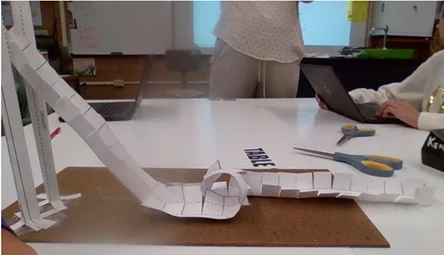 A student pair collects trial data during the PhET Energy Skate Park challenge.Copyright Original photograph taken by the author, with student photo permissions on file; all rights retained by the author.
Part 2: The Data-Collection Challenge (25 minutes)
- Have each group use photographs, sketches, or initial system models from the How Does a Roller Coaster Work activity to construct a simulated version of their paper roller coaster in the PhET Energy Skate Park simulation Playground screen.
- Encourage students to approximate the original track's starting height, hills, and other features as closely as the simulation allows. Then turn on the energy bar graph to display potential, kinetic, thermal, and total energy.
- Give groups the challenge: Systematically vary starting height, rider mass, and friction, changing only one variable at a time while keeping the others constant.
- Have students predict how each change might affect the energy displayed in the graphs before conducting their trials.
- For every trial, have students record the variable changed, their observations of potential, kinetic, thermal, and total energy, and locations where the rider speeds up, slows down, or stops in their PhET Roller Coaster Simulation Worksheet (PDF).
- As groups work, circulate and prompt students with questions such as:
- What happens to potential and kinetic energy as the rider moves downhill or uphill?
- What happens to the total-energy bar as potential and kinetic energy change?
- Does increasing the rider's mass affect the amounts of potential and kinetic energy? Does changing mass alone affect the rider's speed?
- When friction is introduced, what happens to the thermal-energy bar? What happens to the total-energy bar?
- Have each group take a screenshot of one of their trials showing their simulated roller coaster and the energy bar graph. Have students include the screenshot in their PhET Roller Coaster Simulation Worksheet or save it for use in the culminating Roller Coaster Final Model activity.
- Have students compare their simulation observations with their initial roller coaster system models.
- Ask them to identify at least one similarity or difference between their original predictions and the energy transformations shown in the simulation.
A roller coaster recreated in PhET Energy Skate Park, with the energy bar graph showing potential, kinetic, thermal, and total energy.Copyright Original screenshot created by the author using the free PhET Energy Skate Park simulation (PhET Interactive Simulations, University of Colorado Boulder), used under a Creative Commons CC-BY 4.0 license; https://phet.colorado.edu/en/simulations/energy-skate-park.Part 3: Make Sense of the Data (10 minutes; to be completed individually)
- Working on their PhET Roller Coaster Simulation Worksheet (PDF), have students use their trial data to complete the pattern frame “As the ______ increases, the ______ energy ______” for each variable they changed (height, mass, and friction). Encourage students to use evidence from their graphs to support each statement. For example, "As the height increases, the potential energy increases" and "As friction increases, the thermal energy increases."
- Instruct students to then use the data and the graphs to complete these sentence frames:
- The kinetic energy increases when … (Expected answer: the rider moves faster / reaches the lowest points of the track).
- The potential energy decreases when … (Expected answer: the rider drops to a lower height / moves faster).
- The thermal energy increases when … (Expected answer: there is more friction on the track).
- The total amount of energy stays the … (Expected answer: same).
- Have each student write an individual claim, supported by evidence from their trial data and energy graphs, answering the driving questions:
- What happens to energy as the rider moves, slows down, or stops?
- How does evidence from the simulation support the claim that total energy is conserved?
Part 4: Connect Evidence to the Final Model (5 minutes)
- Have students review their initial roller coaster system models and the evidence collected from the PhET simulation.
- Ask students to identify at least two findings from the simulation that could strengthen their original models, such as how potential and kinetic energy change as the rider moves, how friction transforms mechanical energy into thermal energy, or how total energy remains conserved.
- Have students record these findings in their worksheets and save their simulation screenshots and data for use in the culminating Roller Coaster Final Model activity.
- conservation of energy
- The principle that the total energy of a closed system stays constant; energy is never created or destroyed, only transformed from one form into another.
- energy transformation
- The process of energy changing from one form into another.
- friction
- A force that resists motion when two surfaces rub together, transforming kinetic energy into thermal energy.
- kinetic energy
- The energy an object possesses because of its motion.
- potential energy
- The stored energy an object has because of its position or condition.
- thermal energy
- The energy produced by the motion of particles, often generated by friction and felt as heat.
- variable
- A factor that can be changed in an investigation; in this activity, the starting height, the rider's mass, and the friction.
Pre-Activity Assessment
Prior-Knowledge Recap: During the Part 1 revisit, listen for whether students can identify where their marble appeared to move fastest and slowest and explain how changes in height relate to potential and kinetic energy. Students are ready to proceed if they can qualitatively describe potential and kinetic energy from the earlier activities.
Review students' initial roller coaster system models to assess their understanding of energy transformations. Look for whether students can identify where potential and kinetic energy change as the marble moves through the track and recognize questions their models cannot yet fully explain, particularly what happens to energy when the marble slows down or stops.
Activity Embedded (Formative) Assessment
Trial Data Table: Review each pair's recorded trials to confirm they are changing one variable at a time and correctly interpreting the energy bars for each change. Look for evidence that students recognize how starting height, rider mass, and friction affect potential, kinetic, thermal, and total energy.
Pattern Frame (Individual): Review each student's completed "As the ______ increases, the ______ energy ______" statements. Students demonstrate pattern-finding when they correctly link each variable to changes in energy—height and mass to potential and kinetic energy, and friction to thermal energy. Check that students support their statements with evidence from their simulation trials.
Sentence Frames (Individual): Check the four completed conservation statements on each student's worksheet. Students demonstrate understanding when they connect increasing kinetic energy to higher speed, decreasing potential energy to lower height, and increasing thermal energy to friction, and recognize that total energy remains constant.
Post-Activity (Summative) Assessment
Individual Conservation Claim: Evaluate each student's written claim answering the driving question: "What happens to energy as the rider moves, slows down, or stops, and how does the simulation provide evidence that total energy is conserved?" Assess using the following three performance levels:
- Highly Proficient: The student uses specific simulation data and graphical evidence to thoroughly explain transformations among potential, kinetic, and thermal energy, demonstrates that total energy remains conserved under different conditions, and connects these findings to observations from their physical roller coaster and improvements needed in their final system model.
- Proficient: The student uses specific simulation data and graphical evidence to explain how potential and kinetic energy transform into one another, how friction transforms mechanical energy into thermal energy, and why total energy remains conserved even when the rider slows down or stops.
- Developing: The student describes the rider's motion or changes in the energy graphs but does not accurately explain how energy transforms among potential, kinetic, and thermal forms or how the evidence supports conservation of total energy.
- This is a web-based simulation, so physical safety risks are minimal. Follow standard device- and screen-time expectations and monitor for off-task browsing.
- Simulation will not load: Use an up-to-date browser (Chrome, Edge, or Safari); the HTML5 simulation needs no plug-ins. Refresh the page, and confirm the school network filter allows phet.colorado.edu.
- Skater flies off the track: The drawn track likely has a gap or a curve that is too sharp. Have students drag the track control points to smooth the path and make sure the track ends connect. Click the green return-skater button to place the skater back at the start.
- No energy graph appears: Make sure the bar-graph (energy) option is toggled on in the control panel so the potential, kinetic-, thermal-, and total-energy bars are visible.
- Skater never slows down, or stops instantly: Check the friction slider. Full left is frictionless (mechanical energy is conserved and the rider keeps going); sliding right adds friction so thermal energy grows and the rider slows and stops.
- Track disappears when resetting: Remind students to use the return-skater button, which only moves the skater, rather than the full Reset All, which clears the custom track.
Have students change the gravity setting (for example, to the Moon) or the rider's mass, predict the effect on top speed and on the energy bars, and then test their prediction, linking this simulation back to the variables they explored in the physical can-crusher and car-ramp challenges.
For Lower Grades (6th–7th): Use the simulation's preset Intro or Friction tracks instead of drawing a custom track. Have students simply watch the potential- and kinetic-energy bars rise and fall and describe in words what they see, rather than manipulating multiple variables.
For Older / Advanced Students (8th Grade Extension): Use the grid, speedometer, and measure tools to record the rider's height and speed at several points, then compute PE = m × h × g and KE = ½ × m × v² to numerically confirm that total mechanical energy is conserved on a frictionless track.
NGSS Lead States. Next Generation Science Standards: For States, By States. National Academies Press, 2013. https://www.nextgenscience.org.
PhET Interactive Simulations. “Energy Skate Park.” University of Colorado Boulder, 2026. https://phet.colorado.edu/en/simulations/energy-skate-park.
“Conservation of Energy.” Wiktionary, Wikimedia Foundation, 2026. https://en.wiktionary.org.
Utah State Board of Education. Utah Science with Engineering Education (SEEd) Standards, Grade 8. 2019. https://www.schools.utah.gov.
Contributors
Rachel Kenning, Spring Creek Middle School, Cache District, Utah (Advice from: Karen Merritt, Hillary Swanson, Idris Solola)
Supporting Program
Engineering Research Center for Advancing Sustainability through Powered Infrastructure for Roadway Electrification (ASPIRE) in the College of Engineering, Utah State University
Acknowledgements
This material was developed based upon work supported by the National Science Foundation under grant no. EEC 1941524—Engineering Research Center for Advancing Sustainability through Powered Infrastructure for Roadway Electrification (ASPIRE) in the College of Engineering, Utah State University. Any opinions, findings, and conclusions or recommendations expressed in this material are those of the authors and do not necessarily reflect the views of the National Science Foundation.
Copyright
2026 by Regents of the University of Colorado; original © 2025 Utah State University