
Searching for Bigfoot and Others Like Him
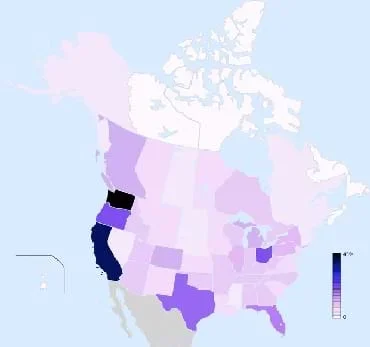 Figure 1. Reported sightings of bigfoot in the US and Canada by state/province. Though bigfoot, as a cryptid, is not taken seriously by most of the scientific community, much anecdotal and testimonial evidence exists.Copyright 2008 Bigfoot Field Researchers Organization (BFRO), Wiikipedia Commons {PD} http://en.wikipedia.org/wiki/File:Bigfoot_Sightings_in_USA.png
Cryptids, creatures of questionable existence, are used as a source of data to guide students into the creation of their own GIS data layer in Google Earth. The activity serves the purpose of a tutorial to teach students how to make data layers with a simple subject. Then they use that skill on other topics such as plastics in their neighborhood.
Engineers that employ GIS as a tool often create their own spatial data layers in order to analyze data collected in the field or generated in a model. In this activity, students get an opportunity to make their own simple data layers. This teaches them the value of good coordinate gathering and information organization to be placed into a spatial context.
After this activity, students should be able to:
- Pull spatial coordinates from Google Earth from any location in the world.
- Find corresponding spatial locations in Google Earth using descriptions external to anything in Google Earth.
- Manipulate basic bit of information in Microsoft Excel® and in Google Documents.
- Search for images and websites related to a topic of information for the purposes of presentation in an interactive map.
- STEL-1J Develop innovative products and systems that solve problems and extend capabilities based on individual or collective needs and wants.
Grades 6-8
Do you agree with this alignment? - STEL-8J Use devices to control technological systems.
Grades 6-8
Do you agree with this alignment?
- 6.1.C select tools, including real objects, manipulatives, paper and pencil, and technology as appropriate, and techniques, including mental math, estimation, and number sense as appropriate, to solve problems;
Grade 6
Do you agree with this alignment?
- design and implement experimental investigations by making observations, asking well-defined questions, formulating testable hypotheses, and using appropriate equipment and technology;
Grades 6-8
Do you agree with this alignment?
Each group needs:
- computer installed with Google Earth and Microsoft Excel® and an Internet access
- personal student account in iGoogle [1], which enables them to save a spreadsheet to Google Documents
- Crypids Map Starter Spreadsheet (XLSX)
Cryptids are creatures that are thought to exist, have witnesses that attest to their existence, but do not have scientific consensus as to their existence or non-existence. It would seem like a strange topic to discuss in a school classroom, especially one that relates in any way to a science-based subject. However, people today know much about cryptids such as bigfoot, the Loch Ness Monster, El Chupacabra, the Yeti, and the Giant Anaconda. They are popularized in movies and in many documentary-style television shows that purport to be "investigating the truth" or "bringing to light the facts that are hidden" concerning these creatures. Cryptids are not themselves new. For example, reports of the Jersey Devil stretch back to the 18th century [2], but you may find them an interesting topic precisely because the scientific world shuns any serious discussion of them. The fact that they are so linked to particular locations makes them a good source of subject matter to learn how to make GIS layers in Google Earth.
GIS layers are spatial layers that contain information and may be displayed on a digital map within a computer. They can be of virtually anything that has some kind of spatial nature to it—bird migrations, disease patterns or road development plans. The level of information in the layer is entirely up to the creator. In many ways, GIS data layers can be seen as just another form of a database. A database has tables that are related to each other by common fields. A GIS layer is like one of the tables in a database. If, for example, the layer was a point type describing houses in a neighborhood, a unique point would exist for every address. Stored with each address might be the owner of the house, the year it was built, the style of the house, and perhaps the expected mineral resources under the house property. When an entire data layer is viewed as a simple table that has a column for each one of these fields, that table is often referred to as an attribute table. Each field is an attribute of whatever the feature is in the data layer. In the case of the home addresses, each feature is a point. One could use a symbol for house type, and then that one attribute would be displayed on the map in the form of symbology. What if someone wanted to know more than just what type of house but they also wanted to know the year the house was built, the current owner of the house, and even how many times the house has been sold and at what price each time? In a neighborhood of 75 houses, it would be nearly impossible to put all of this information on a paper map, static and unchanging, because the amount of information would be very small as text and overwhelming to the viewer. Regular Internet users encounter the solution to this problem every day. Any popular online mapping program such as Google Maps, Yahoo Maps or MapQuest allows the map user to interactively view great amount of information by clicking on a single location. All of the detailed information is available, but just as one or two locations at a time. It is not overwhelming as was the case in the static paper map, and it is not devoid of the spatial value as is the case in simply viewing a table that lists all of the attributes.
In this activity, we will design a map like what is seen in online mapping programs in Google Earth. The engineering challenge is that we need to organize information about where seven different cryptids believed to exist in different parts of the world. The end product will be a layer in Google Earth. At each cryptid location will be a point marker of some sort that can be accessed by clicking. As the point marker opens, the map user will be able to see an image of the cryptid, information about its history and sightings, and links to more information.
Google has created a tool to make it much easier for the average Internet use to do this; it is called Google Spreadsheet Mapper. All that is needed to use the tool is to first create an Excel spreadsheet that has all of the information about the cryptids: name, location, coordinates, description, history of sighting, a link for a picture and a link to website for more information. That information is entered into Google Spreadsheet Mapper and published online, so that anyone with Google Earth and an Internet connection can access it. Once we have learned how to effectively map cryptids, you will use your own data on plastics in the environment to make an informative map of their locations.
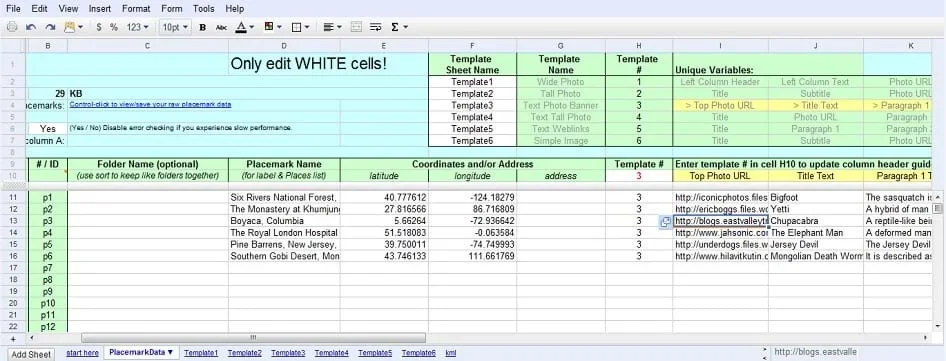 Figure 2. Screen capture of placemarker storage information in Google Spreadsheet Mapper.Copyright 2010 Nathan L. Howell, GK-12 Program, College of Engineering, University of Houston; screen capture from Google Spreadsheet Mapper as used in Google Documents.
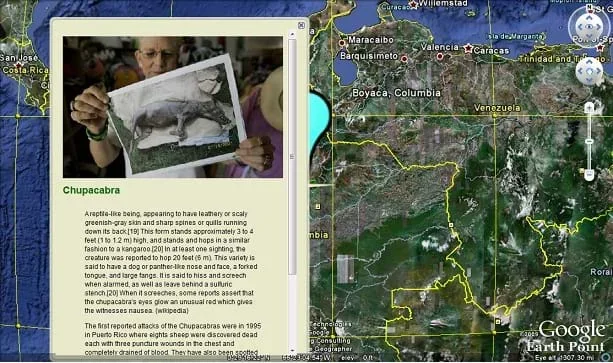 Figure 3. A screen capture of what the cryptids map could look like when examining El Chupacabra. (using Google Earth) In the image, there is blue placemark that was centered in Boyaca, Colombia. The callout box appeared upon clicking. The picture is stored online and linked by the Google Spreadsheet Mapper tool. The text was written and then stored online in that same Google Spreadsheet Mapper document.Copyright 2010 Nathan L. Howell, GK-12 Program, College of Engineering, University of Houston; screen capture from Google Earth.
Before the Activity
- Find a simple way to distribute the Crypids Map Starter Spreadsheet (XLSX) (such as a central server).
- Get the class set up with individual iGoogle accounts, and make certain that they remember their passwords.
- Create a cryptids map on your own from start to finish using the same procedure that is intended for the students. This also serves as as demo example for students to examine.
- Read and thoroughly understand how to run the Google Spreadsheet Mapper tool using the Google created tutorial. See instructions at http://earth.google.com/outreach/tutorial_spreadsheet.html.
- (optional) Show an interesting cryptids-related video to get the class into the topic. Many short videos on various specific cryptids are available for viewing on The History Channel website.
With the Students
- Show students the cryptids interactive Google Earth map that you have already created. It may be helpful to let a student explore it in demonstration in front of the entire class to get more of the "unbiased user" effect.
- Explain in general what the cryptids engineering challenge is, and that it is meant to be a communication tool of spatial information. Cryptid coordinates must be gathered and matched with background information, photographs, and website that relate to each location in the final GIS layer.
- Have students first complete the starter spreadsheet. All information needs to be filled in. The easiest method to get a coordinate for each of the locations is to use the Placemark tool (looks like a yellow pushpin). Put the placemark at whatever location will ultimately be used for the cryptid, and then open the properties window for that placemark. The coordinates in latitude and longitude will be displayed. Make certain that coordinates are recorded in decimal degrees and without the degrees symbol or Google Spreadsheet Mapper will not plot them correctly. (For example, 41.836010, -111.380991 is correct while 41°50'42.75"N, 111°22'28.13"W is NOT correct.)
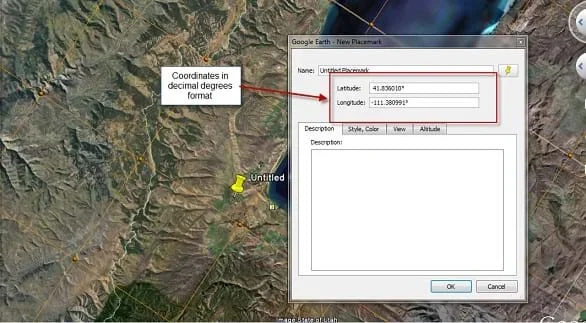 Figure 4. Demonstration image of how to take coordinates from Google Earth using the placemarker (yellow pushpin tool). The location used is near Bear Lake State Park, UT.Copyright 2010 Screen capture from Google Earth
- Demonstrate some of the steps for taking the starter spreadsheet and putting it into the Google Spreadsheet Mapper tool.
- Give students time to finish creating their Google Earth layers.
- cryptid
- A creature that is thought to exist, has witnesses that attest to its existence, but do not currently have scientific consensus as to its existence or non-existence.
- geographic layer
- A set of spatial information that may be displayed in a GIS. Usually the information bits have a common theme to them.
- attribute table
- A table that contains all of the information about every feature in a geographic layer.
- symbology
- The symbol scheme used to indicate different attributes of a geographic layer. Usually a symbology can only indicate 2-3 attributes at one time effectively.
Activity Embedded Assessment
Cryptids Starter Spreadsheet: Examine the students' Excel spreadsheets before allowing them to go on to the second phase of the activity. Test their understanding by asking them questions about how they got the coordinates, why they chose particular links, and what they want their final map to tell others.
Post-Activity Assessment
Map Grading: Grade students' individual maps for functionality (do links work, do location display in the correct place on the map?) and originality (usefulness of the links, creativity of the chosen images, use of their own information instead of the information provided in the spreadsheet).
If students have trouble getting their place markers to display, check the error handling in Google Spreadsheet Mapper. Errors are given in various cells as red text.
A Better Topic: If a spatially related topic exists that is more relevant to current class material, it is not that difficult to develop a starter spreadsheet in a similar fashion to what is used in the Cryptids Starter Spreadsheet. Just make sure to make a full working Google Earth layer file before it is used with the entire class.
- For lower grades, take some of the cryptids out of the sheet so they have less to do. Also, do some portions of the process as a class to be certain that students are not confused.
- For upper grades, remove some of the filled in sections of the Cryptids Starter Spreadsheet so that students are required to fill them in. The teacher can also require students to add one or two cryptids to the spreadsheet that are not already there. Another alternative is to pick a cryptid and have students make a map that incorporates many sightings of that one cryptid rather than displaying several cryptids. For example, bigfoot has reported sightings all over the U.S.
It may be interesting to show some examples of how spreadsheet data is mapped using a video created by Google for demonstration of the program; see https://www.youtube.com/watch?v=DjKrsN66Udw.
Some very interesting map layers were created by David Tryse. They are far more advanced than what students will likely be able to create, but they are readily downloadable and can stimulate more ideas and excitement for creating Google Earth layers. The map content relates to environment and has much good information to teach about environment in a geospatial way even without students thinking about how the maps are actually made. See http://david.tryse.net/googleearth/#KML_files.
iGoogle. Accessed March 29, 2010. http://www.google.com/ig
Pinelands Preservation Alliance. Accessed March 29, 2010. http://www.pinelandsalliance.org/history/places/
Contributors
Nathan Howell; Andrey Koptelov
Supporting Program
National Science Foundation GK-12 and Research Experience for Teachers (RET) Programs, University of Houston
Acknowledgements
This digital library content was developed by the University of Houston's College of Engineering under National Science Foundation GK-12 grant number DGE 0840889. However, these contents do not necessarily represent the policies of the NSF and you should not assume endorsement by the federal government.
Copyright
2013 by Regents of the University of Colorado; original © 2010 University of Houston