
Quick Look
Grade Level: 4 (3-5)
Time Required: 45 minutes
Expendable Cost/Group: US $0.00
Group Size: 3
Activity Dependency: None
Subject Areas: Data Analysis and Probability, Earth and Space, Number and Operations, Physical Science, Science and Technology
NGSS Performance Expectations:

| 3-5-ETS1-1 |
| 4-ESS3-1 |
| 5-ESS3-1 |
Quick Look
- Grade Level:
- 4 (3 – 5)
- Time Required:
- 45 minutes
- Group Size:
- 3
- Subject Areas:
-
Data Analysis and Probability Earth and Space Number and Operations Physical Science Science and Technology -
NGSS Performance Expectations:
3-5-ETS1-1 4-ESS3-1 5-ESS3-1

Summary
Introduce students to the concepts of climate change and how cars can contribute to it. In this activity, students work together to understand how various forms of transportation have costs and benefits, and which modes of transportation are better for the environment by making decisions for a commuter.Engineering Connection
Understanding the negative impact gas-powered cars have on the environment is key to designing cars that produce little to none carbon emissions. Chemical engineers develop and test new car batteries, electrical engineers design the electrical circuitry to charge the battery and distribute the electricity from the battery to the electric motor. Mechanical engineers design, develop, and test electric motors, transmissions, drivetrains, steering systems, and more. Many electric vehicles are made of newer materials that are lighter and stronger and may incorporate environmentally-friendly materials, which materials engineers develop, process, and test.
Learning Objectives
After this activity, students should be able to:
- Describe the greenhouse effect.
- Recall the role carbon dioxide plays in the greenhouse effect.
- Recognize how transportation can affect the greenhouse effect.
Educational Standards
Each Teach Engineering lesson or activity is correlated to one or more K-12 science,
technology, engineering or math (STEM) educational standards.
All 100,000+ K-12 STEM standards covered in Teach Engineering are collected, maintained and packaged by the Achievement Standards Network (ASN),
a project of D2L (www.achievementstandards.org).
In the ASN, standards are hierarchically structured: first by source; e.g., by state; within source by type; e.g., science or mathematics;
within type by subtype, then by grade, etc.
Each Teach Engineering lesson or activity is correlated to one or more K-12 science, technology, engineering or math (STEM) educational standards.
All 100,000+ K-12 STEM standards covered in Teach Engineering are collected, maintained and packaged by the Achievement Standards Network (ASN), a project of D2L (www.achievementstandards.org).
In the ASN, standards are hierarchically structured: first by source; e.g., by state; within source by type; e.g., science or mathematics; within type by subtype, then by grade, etc.
NGSS: Next Generation Science Standards - Science
| NGSS Performance Expectation | ||
|---|---|---|
|
3-5-ETS1-1. Define a simple design problem reflecting a need or a want that includes specified criteria for success and constraints on materials, time, or cost. (Grades 3 - 5) Do you agree with this alignment? |
||
| Click to view other curriculum aligned to this Performance Expectation | ||
| This activity focuses on the following Three Dimensional Learning aspects of NGSS: | ||
| Science & Engineering Practices | Disciplinary Core Ideas | Crosscutting Concepts |
| Define a simple design problem that can be solved through the development of an object, tool, process, or system and includes several criteria for success and constraints on materials, time, or cost. Alignment agreement: | Possible solutions to a problem are limited by available materials and resources (constraints). The success of a designed solution is determined by considering the desired features of a solution (criteria). Different proposals for solutions can be compared on the basis of how well each one meets the specified criteria for success or how well each takes the constraints into account. Alignment agreement: | People's needs and wants change over time, as do their demands for new and improved technologies. Alignment agreement: |
| NGSS Performance Expectation | ||
|---|---|---|
|
4-ESS3-1. Obtain and combine information to describe that energy and fuels are derived from natural resources and their uses affect the environment. (Grade 4) Do you agree with this alignment? |
||
| Click to view other curriculum aligned to this Performance Expectation | ||
| This activity focuses on the following Three Dimensional Learning aspects of NGSS: | ||
| Science & Engineering Practices | Disciplinary Core Ideas | Crosscutting Concepts |
| Obtain and combine information from books and other reliable media to explain phenomena. Alignment agreement: | Energy and fuels that humans use are derived from natural sources, and their use affects the environment in multiple ways. Some resources are renewable over time, and others are not. Alignment agreement: | Cause and effect relationships are routinely identified and used to explain change. Alignment agreement: Knowledge of relevant scientific concepts and research findings is important in engineering.Alignment agreement: Over time, people's needs and wants change, as do their demands for new and improved technologies.Alignment agreement: |
| NGSS Performance Expectation | ||
|---|---|---|
|
5-ESS3-1. Obtain and combine information about ways individual communities use science ideas to protect the Earth's resources and environment. (Grade 5) Do you agree with this alignment? |
||
| Click to view other curriculum aligned to this Performance Expectation | ||
| This activity focuses on the following Three Dimensional Learning aspects of NGSS: | ||
| Science & Engineering Practices | Disciplinary Core Ideas | Crosscutting Concepts |
| Obtain and combine information from books and/or other reliable media to explain phenomena or solutions to a design problem. Alignment agreement: | Human activities in agriculture, industry, and everyday life have had major effects on the land, vegetation, streams, ocean, air, and even outer space. But individuals and communities are doing things to help protect Earth's resources and environments. Alignment agreement: | A system can be described in terms of its components and their interactions. Alignment agreement: Science findings are limited to questions that can be answered with empirical evidence.Alignment agreement: |
Materials List
Each student needs:
For entire class
- computer, laptop, or table with internet access
- projector
Worksheets and Attachments
Visit [www.teachengineering.org/activities/view/cub-2636-carbon-emissions-3-5-activity] to print or download.Pre-Req Knowledge
A basic understanding of interpreting simple graphs with keys and numeracy (ones, tens, hundreds, and greater than/less than between values), a basic idea of the atmosphere and gases.
Introduction/Motivation
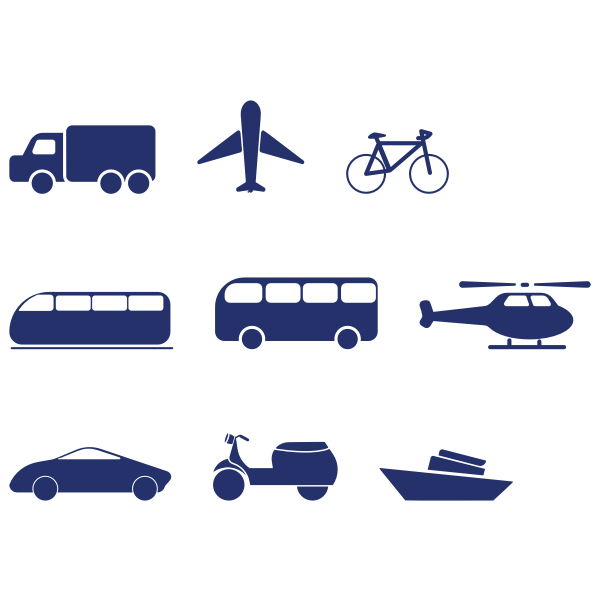
Transportation is a way of getting from one place to another. What are some examples? [Ask students to volunteer answers in an open discussion. Use Google images to show various images of cars, trains, buses, planes, bikes, etc.] The most basic mode of transportation is walking.
What modes of transportation do you use to get to school? [Students may offer the following or similar answers: buses, walking, cars, carpooling, etc.]
Carbon emissions are the carbon dioxide released into the atmosphere by transportation. Carbon emissions are a result of burning fossil fuels for energy. What modes of transportation emit carbon dioxide? [Students should answer with any vehicle that emits gas—cars, steam-powered trains, airplanes, buses, motorcycles, etc.]
What modes of transportation do not emit carbon dioxide? [Possible answers: walking, biking, skateboarding, rollerblading.]
Why might it be harder to walk to school instead of driving a car? [Students should mention things like the time it takes for each, walking might be more tiring, the weather might be too bad for a walk, etc.]
How can we solve these problems? [Ask students to volunteer solutions for any of the answers they gave to the previous question. They might mention carpooling, using bikes instead of walking, using the bus on days with bad weather, etc.]
The kind of transportation we choose can have a big impact on the environment. As engineers work to create more energy-efficient vehicles, we need to consider why it may be hard for people to switch over to the current options available to them.
When we make one choice, we must consider the “tradeoffs”. What do you think a tradeoff is? [Let students offer their ideas.] A tradeoff is a choice you make that benefits you in one way, but at the same time results in you losing another quality. For example, if you spend your allowance on a video game, you gain the video game but you “lose” (by spending) your allowance and no longer have that money to buy something else.
Here’s another example: we might choose to drive a car because it is easier for us than to walk, but cars emit carbon dioxide. And carbon dioxide is not good for the environment.
Let’s get started and work together to learn which modes of transportation are better for our environment!
Procedure
Background
There are many alternatives to using cars to get from one place to another, such as buses, trains, bikes, and even walking. However, future engineers are looking to electric vehicles. This is because many current modes of transportation involve trade-offs. This activity should introduce students to the idea of trade-offs as well as help them recognize the best mode of transportation for our environment.
The kind of transportation we choose can have a big impact on the environment. As engineers work to create more energy-efficient vehicles, students should consider why it may be hard for people to switch over to the current options available to them.
In this activity, students are introduced to the idea of trade-offs and why the choices we make every day can be significant. Students should recognize how many different modes of transportation exist and why we may choose one over the other.
Before the Activity
- Gather materials and make copies of the Carbon Emissions: Pardon My Carbon Worksheet.
With the Students
- Read the Introduction / Motivation section aloud to the class.
- Review concepts from the previous lesson as needed. Note: this activity highlights carbon emissions (carbon that is released into the air from burning fossil fuels for transportations).
- Explain that student teams are going to explore how transportation can affect the amount of CO2 in the atmosphere.
- Tell the students: Carbon dioxide is an important greenhouse gas. Carbon dioxide is released into the atmosphere through human activities and natural processes.
- Ask the students: What are some human activities that release carbon dioxide into the atmosphere? [Possible answers include: deforestation, cars, factories.]
- Visit the website: https://climate.nasa.gov/vital-signs/carbon-dioxide/. Share the screen with the students or ask them to access the website on their own laptop. Have students look at the first image on the right-hand side of the website.

- Tell the students: This image shows the amount of CO2 in the atmosphere measured at the Mauna Loa Observatory on the island of Hawai’i from 2005 until the present.
- Ask the students: About how many parts per million were measured in 2005? About how many parts per million were measured the most recently, in the present? [Answer: Students should say around 378 ppm and 416ppm.] Hover the mouse over the image on the website to see all of the values throughout the years.
- Have students look at the second image on the right-hand side of the website.

Ask students the following:
- How much CO2 was observed in 1950? (Answer: Any number between 300-320 ppm)
- How much CO2 is being observed now? (Answer: Any number between 400-420 ppm)
- What is the difference between those two numbers? (Answer: ~100 ppm)
- Show students the time series on the right-hand side of the website. Ask students the following: What color was the map at the beginning of the time series? What color was it at the end? [Answer: Gray/green and orange/red.]
- Have students discuss the following as a class: How do you see the effects of climate change in your everyday life? [Answers include wildfires, global warming, etc. The idea is to get them thinking about the effects of climate change.]
- Divide the class into groups or pairs. Explain that students will work together to complete the datasheet.
- As a class, read and discuss the “Problem”, “Constraints (limits)”, and “Transportation Trade-offs” sections in the worksheet.
- Next, in the “Imagine” section of the worksheet, have students describe their thoughts on the best and worst forms of transportation and why.
- Have students share their ideas as a class.
- For the “Design” section Part 1, have students refer to the table in the “Transportation Trade-offs” section to get Carlota to work on time each day by not using the same transportation choice more than two times during the week. Ask students to share their decisions as a class.
- In Part 2, have teams work together to go through Carlota’s Trip Tracker table day by day to determine the best solution for Carlota to get to work on time with the limits (constraints) she is facing.
- After teams have finished, have a class discussion to determine the key constraint each day that Carlota has to overcome related to weather, cost, travel time, available money, and any health bonus considerations.
- Ask teams to share their decisions on travel choices each day. Listen for similarities and differences in how travel choices were made and the process of how the decisions were made. Highlight key points that come up during the class discussion.
- For the “Test” section, calculate Carlota’s total carbon cost for the week by adding each day’s carbon cost for the week. Circle Carlota’s Carbon Footprint amount based on her travel decisions during the week.
- Reflect on the process students used for making Carlota’s transportation decisions based on the constraints she faced each day. Ask students if their thoughts on the best and worst forms of transportation have changed from their initial thoughts in the “Imagine” section.
Conclusion
When you have more people in the car or bus, the amount of pollution per person is less, that's why carpooling or taking the bus reduces your carbon footprint. Walking or using your bike is even better for the environment because there is no exhaust full of carbon dioxide. As the climate crisis grows bigger, engineers are trying to reduce the carbon footprints left by their designs. For example, more and more electric cars are being sold as engineers figure out ways to make them more efficient. Along with the growth in electric vehicles, many engineers are finding solutions to make it easier to switch over, like creating electrically charged roads. Now that you have learned how transportation can affect the greenhouse effect, would you try any of the transportation modes in the activity?
Vocabulary/Definitions
carbon emissions: Carbon emissions are the carbon dioxide released into the atmosphere due to the activities from humans.
carbon footprint: The amount of CO2 released into the atmosphere because of one's own energy needs.
parts per million: Expresses the smallest possible unit.
transportation: The movement of humans, animals, and goods from one place to another.
Assessment
Pre-Activity Assessment
Discussion Questions: Ask the students and discuss as a class:
- Why might it be hard to switch over to electric vehicles?
- What are trade-offs?
- Are there trade-offs we should think about as we try to pick better transportation?
Activity Embedded (Formative) Assessment
Guided Worksheet: Have students work together in small groups or individually on the Carbon Emissions: Pardon My Carbon Worksheet. Once they are finished, have them volunteer to share their answers with the class.
Post-Activity (Summative) Assessment
Real-Life Application: Have the students create their own table similar to the one provided in the worksheet by using local weather, bus fare and gas rates, average travel times, and more!
Making Sense: Have students reflect on the science concepts they explored and/or the science and engineering skills they used, plus questions or ideas they have by completing a modified Making Sense Assessment.
Activity Extensions
Activity Scaling
Subscribe
Get the inside scoop on all things Teach Engineering such as new site features, curriculum updates, video releases, and more by signing up for our newsletter!More Curriculum Like This

This activity introduces students to the concepts of climate change and what affects it. Students work together to understand how various forms of transportation have costs and benefits, and which modes of transportation are better for the environment.
Students learn the concepts of climate change and how cars can contribute to climate change. Students learn the basics of the greenhouse effect and the carbon cycle. They also learn how transportation affects our atmosphere. Students work together to understand how various forms of transportation ha...

Students learn about climate change and what affects it. Students learn a basic understanding of the greenhouse effect, the carbon cycle, global warming, and how transportation can contribute to global warming. Students work together to understand how various forms of transportation have costs and b...
Looking at transportation and the environment, students learn that some human-made creations, such as vehicles, can harm the natural environment. They also learn about alternative fuels and vehicles designed by engineers to minimize pollution. The associated hands-on activity gives students a chance...

References
“Carbon Dioxide.” NASA, NASA, 13 Sep. 2021, https://climate.nasa.gov/vital-signs/carbon-dioxide/.
Copyright
© 2022 by Regents of the University of Colorado BoulderContributors
Niharika Kunapuli; Jennifer TaylorSupporting Program
Pre-College Engineering Education, Integrated Teaching and Learning Program, University of Colorado BoulderAcknowledgements
This curriculum was developed under National Science Foundation grant number 1941524. Any opinions, findings, and conclusions, or recommendations expressed in this material are those of the authors and do not necessarily reflect the views of the National Science Foundation.
This curriculum was developed with support from the AEROKATS and ROVER Education Network (AREN) (Henry/NNX16AB95A). AREN is a NASA Science Mission Directorate Science Activation (SciAct) Program.
Last modified: July 1, 2022
User Comments & Tips