Quick Look
Grade Level: 4 (3-5)
Time Required: 45 minutes
Expendable Cost/Group: US $1.00
Group Size: 1
Activity Dependency: None
NGSS Performance Expectations:

| 5-ESS3-1 |

Summary
In this activity, students review and evaluate the ways land is covered and used in their local community. They also consider the environmental effects of the different types of land use. Students act as community planning engineers to determine where to place a new structure that will have the least effect on the environment.Engineering Connection
When developing a new community, engineers design the growing area, ensuring minimal impact on the existing natural environment. Civil, transportation and architectural engineers concentrate on the safety, design and cost of new buildings, bridges, dams and roads.
Learning Objectives
After this activity, students should be able to:
- Understand and identify the different ways that land is covered and used.
- Students predict land usage amounts in their community.
- Describe the involvement of engineers in community planning.
Educational Standards
Each Teach Engineering lesson or activity is correlated to one or more K-12 science,
technology, engineering or math (STEM) educational standards.
All 100,000+ K-12 STEM standards covered in Teach Engineering are collected, maintained and packaged by the Achievement Standards Network (ASN),
a project of D2L (www.achievementstandards.org).
In the ASN, standards are hierarchically structured: first by source; e.g., by state; within source by type; e.g., science or mathematics;
within type by subtype, then by grade, etc.
Each Teach Engineering lesson or activity is correlated to one or more K-12 science, technology, engineering or math (STEM) educational standards.
All 100,000+ K-12 STEM standards covered in Teach Engineering are collected, maintained and packaged by the Achievement Standards Network (ASN), a project of D2L (www.achievementstandards.org).
In the ASN, standards are hierarchically structured: first by source; e.g., by state; within source by type; e.g., science or mathematics; within type by subtype, then by grade, etc.
NGSS: Next Generation Science Standards - Science
| NGSS Performance Expectation | ||
|---|---|---|
|
5-ESS3-1. Obtain and combine information about ways individual communities use science ideas to protect the Earth's resources and environment. (Grade 5) Do you agree with this alignment? |
||
| Click to view other curriculum aligned to this Performance Expectation | ||
| This activity focuses on the following Three Dimensional Learning aspects of NGSS: | ||
| Science & Engineering Practices | Disciplinary Core Ideas | Crosscutting Concepts |
| Obtain and combine information from books and/or other reliable media to explain phenomena or solutions to a design problem. Alignment agreement: | Human activities in agriculture, industry, and everyday life have had major effects on the land, vegetation, streams, ocean, air, and even outer space. But individuals and communities are doing things to help protect Earth's resources and environments. Alignment agreement: | A system can be described in terms of its components and their interactions. Alignment agreement: Cause and effect relationships are routinely identified and used to explain change.Alignment agreement: |
Common Core State Standards - Math
-
Represent and interpret data.
(Grade
4)
More Details
Do you agree with this alignment?
International Technology and Engineering Educators Association - Technology
-
Students will develop an understanding of the role of society in the development and use of technology.
(Grades
K -
12)
More Details
Do you agree with this alignment?
-
Students will develop an understanding of the effects of technology on the environment.
(Grades
K -
12)
More Details
Do you agree with this alignment?
-
Modern communities are usually planned according to guidelines.
(Grades
3 -
5)
More Details
Do you agree with this alignment?
-
Determine factors that influence changes in a society's technological systems or infrastructure.
(Grades
3 -
5)
More Details
Do you agree with this alignment?
State Standards
Colorado - Math
-
Represent and interpret data.
(Grade
3)
More Details
Do you agree with this alignment?
Colorado - Science
-
Make a plan to positively impact a local ecosystem
(Grade
4)
More Details
Do you agree with this alignment?
Materials List
Each student should have:
- A map of the local community showing the location of the school
- 1 sheet of grid paper (100 squares – 10x10)
- 1 set of colored pencils
Worksheets and Attachments
Visit [www.teachengineering.org/activities/view/cub_environ_lesson08_activity1] to print or download.Introduction/Motivation
Communities make land-use decisions every day; in fact, look around you and you will see the result of these decisions. A major challenge facing most communities, both rural and urban, is how to plan for continued growth given the impact that humans have already had and continue to have on the land. Can you think of an area near you where you can see community growth? How about a new neighborhood or apartment building that is being built? How does a community plan for this growth?
Engineers of many types play big roles in figuring out the best ways to develop a growing area or community without harming the existing community and natural environment. Architectural, civil and transportation engineers all focus on the safety, cost and design of new buildings, bridges, dams, roads and other structures. To work on new community projects, engineers must understand the land use that already exists in an area. With this information, they can recommend the best place to build a structure that will have the least negative effect on the environment. Essentially, this means choosing the area and/or design that will affect the least amount of animals, plants and people already living in the area and protect them from pollution and loss of food or habitat. We are going to try this today by acting as community planning engineers in our own community.
Background
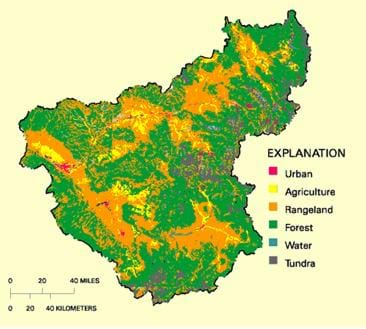
The terms land use and land cover (also known as the acronym LULC) are often used simultaneously to describe those maps that provide information about the types of features found on the Earth's surface (land cover) and the human activity that is associated with them (land use). For example, a place that is forested may be used for low-density housing, logging and/or recreation.
In some cases, both land cover and land use are mapped together. These maps are produced from remotely sensed data (satellite images and aerial photography) at scales that are amenable to planning, environmental assessment and development studies.
LULC Classification System
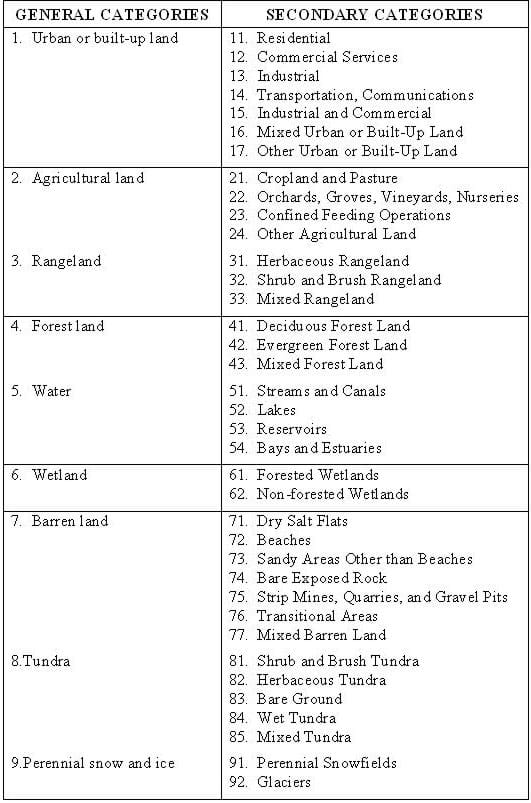
The USGS has developed a land cover classification system in cooperation with the National Aeronautics and Space Administration (NASA), the Natural Resource Conservation Service (NRCS), the Association of American Geographers (AAG), and the International Geographical Union (IGU). This system is commonly referred to as the "Anderson Classification." The Anderson Classification system has nine general categories, and each category is divided into subcategories that convey additional information about the cover type. This standardization allows comparisons of land cover and land use to be made between different parts of the country/world.


Procedure
Before the Activity
- Obtain a map that includes your school and nearby streets.
- On a copy machine, enlarge the area on the map that surrounds your school.
- Copy the 100-square grid onto a transparency.
With the Students
- Display the enlarged map transparency with your school in a center square of a piece of grid paper and clip the two together so they will not move. (Reminder: If you copy it like this, the map will be transposed onto the grid.)
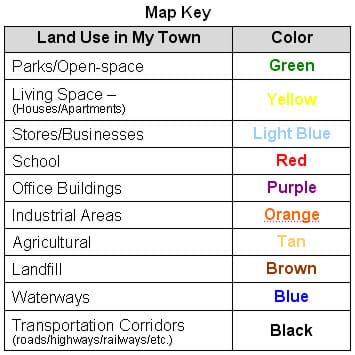
- Take a short walking tour around the area that is represented on the map with the students to make a key before you begin. This will help the students get an idea of what type of buildings and land cover exist around the neighborhood.
- Announce to the class that they work for Green Communities Engineering Firm, which deals with community planning. The citizens have voted to add a new structure to their community to bring in more business. (Note: Have students pick a new structure: a new strip mall, apartment/housing development, airport, landfill, etc.) The engineering firm needs to figure out where to build this structure that will have the least effect on the environment.
- Distribute a grid-map to each student.
- Have each student make a key for their map. You may need to add more descriptions and colors.

- Ask students to predict what percentage of the land represented on the map will fall into each category. Have them record their predictions on the This Land is Your Land, This Land is My Land Worksheet.
- Ask the students to use colored pencils to color the squares on the grid using the color-coding system shown in the key. The students do not need to color any one square the same color; they can color it half of one type and half of another type. They should not get any more detailed than that or else it will get too confusing and lengthy to count the squares. (Reminder: You may even want to take a short walking fieldtrip around the neighborhood to begin filling in some of the areas.) Help the students get started by doing a couple of areas together. For example, if you know that there are businesses all along Main Street from 1st to 4th Avenues, you can color those areas blue.
- You may have to discuss some of the areas as a class if students are not familiar with them.
- Once the students are finished coloring, ask them to count up all the boxes of each type and record it in the table on the activity sheet. They should round to ½ a square and they should get a total of 100 squares.
- Ask the students to convert all these numbers to percentages. This should be fairly easy since it is based on 100 squares (so 37 squares is 37%). You may want them to go through the calculations anyway.
- Ask the students to answer the questions at the end of the This Land is Your Land, This Land is My Land Worksheet. Be sure to provide them with the suggested addition/change to their maps (a new strip mall, apartment/housing development, airport, landfill, etc.) so they can complete the questions.
Assessment
Pre-Activity Assessment
Cause and Effect: Have students discuss causes of creating new buildings, bridges, dams, etc. in the community and the effects they have on the land and environment.
Prediction: Ask students to predict what percentage of the land represented on the map will fall into each category. Have them record their predictions on the This Land is Your Land, This Land is My Land Worksheet.
Activity Embedded Assessment
Activity Sheet: Have students follow along on the attached activity worksheet.
- Once the students are finished coloring, ask them to count up all the boxes of each type and record it in the table on the activity sheet. They should round to ½ a square and they should get a total of 100 squares.
- Ask the students to convert all these numbers to percentages. This should be fairly easy since it is based on 100 squares (so 37 squares is 37%). You may want them to go through the calculations anyway.
Post-Activity Assessment
Community Planning Engineer: Ask the students to answer the questions at the end of the This Land is Your Land, This Land is My Land Worksheet. Remind students that they work for Green Communities Engineering Firm, which deals with community planning. They have been working to figure out where to build a new structure that will have the least effect on the environment. Have students consider where the best place to put the addition and mark it with a red X on their maps. They should explain why they chose to put it there.
Numbered Heads: Break the class up into teams of three to five. Students on the team should pick numbers so each member has a different number. Ask the students a question from the activity worksheet (give them a time frame for solving it, if desired). The members of each team should work together on the question. Everyone on the team must know the answer. Call a number at random. Students with that number should raise their hands to answer the question. If not all the students with that number raise their hands, allow the teams to work on the question a little longer.
Safety Issues
If students go on a walking tour of the neighborhood, be sure to enlist the help of volunteers. Assign groups to an appropriate number of adult chaperones, and remind students to stay with their groups.
Troubleshooting Tips
It will take some trial and error to get the map and the transposed grid just the way you want it, but it will be worth it.
Be prepared to help students understand that some squares may contain more than one color. For example, ½ may be yellow and the other ½ could be green. This will depend on the scale of your map and the type of area you live in.
Activity Extensions
Obtain a map of your area from 50-100 years ago. Ask ½ of the students to do a land use description of this map. Then pair the students (one with a historic land use plot and one with a modern land use plot). Ask them to compare and contrast the two. Ask them to describe what effects they think the development has had on the environment? Do they think the land was used wisely? Why or why not?
Instead of asking all students to do the same land area, divide the local map into sections and have each student plot and evaluate the land use for that map section. Place all the final land use diagrams together (as a land use map of the area) and display in your school with a key and a short analysis. See if you can get a land use map of your area and compare it to the one the class made.
Ask students to design their own communities (either urban, suburban or rural). Discuss the different arrangement needs of each.
Activity Scaling
For 3rd grade students, use a smaller number of larger squares on the grid (maybe 25 – 5x5). Simplify the map for their level of understanding (consider placing pictures on the map). Ask the students to cut and paste small pictures of houses, parks, stores, etc. on the grid instead of color-coding it. They can count the squares of each and create a bar graph (using the same cut and paste squares) instead of calculating percents.
For 4th grade students, do the activity as is.
For 5th grade students, use the percent data to create a color-coded pie graph.
Subscribe
Get the inside scoop on all things Teach Engineering such as new site features, curriculum updates, video releases, and more by signing up for our newsletter!More Curriculum Like This

In this lesson, students learn about types of land use by humans and evaluate the ways land is used in their local community. Students will assume the role of community planning engineers and will create a future plan for their community.

Students learn to identify the common features of a map. Through the associated activities, students learn how to use a compass to find bearing to an object on a map and in the classroom.
References
Glencoe Science: An Introduction to the Life, Earth and Physical Sciences, Student Edition, Blacklick, Ohio: Glencoe/McGraw-Hill, 2002.
Copyright
© 2005 by Regents of the University of Colorado.Contributors
Amy Kolenbrander; Jessica Todd; Malinda Schaefer Zarske; Janet YowellSupporting Program
Integrated Teaching and Learning Program, College of Engineering, University of Colorado BoulderAcknowledgements
The contents of this digital library curriculum were developed under a grant from the Fund for the Improvement of Postsecondary Education (FIPSE), U.S. Department of Education and National Science Foundation GK-12 grant no. 0338326. However, these contents do not necessarily represent the policies of the Department of Education or National Science Foundation, and you should not assume endorsement by the federal government.
Last modified: June 1, 2021


User Comments & Tips