
Quick Look
Grade Level: 11 (10-11)
Time Required: 3 hours
(conducted over three days, and up to five)
Expendable Cost/Group: US $5.00
Group Size: 6
Activity Dependency: None
Subject Areas: Algebra, Geometry, Measurement, Number and Operations, Problem Solving
NGSS Performance Expectations:

| HS-ETS1-3 |
Quick Look
- Grade Level:
- 11 (10 – 11)
- Time Required:
- 3 hours
(conducted over three days, and up to five)
- Group Size:
- 6
- Subject Areas:
-
Algebra Geometry Measurement Number and Operations Problem Solving -
NGSS Performance Expectations:
HS-ETS1-3
Summary
Playing the role of engineers in collaborations with the marketing and production teams in a chocolate factory, students design a container for a jumbo chocolate bar. The projects constraints mean the container has to be a regular trapezoidal prism. The design has to optimize the material used to construct the container; that is, students have to find the dimensions of the container with the maximum volume possible. After students come up with their design, teams present a final version of the product that includes creative branding and presentation. The problem-solving portion of this project requires students to find a mathematical process to express the multiple variables in the prism’s volume formula as a single variable cubic polynomial function. Students then use technology to determine the value for which this function has a maximum and, with this value, find the prism’s optimal dimensions.
Engineering Connection
Engineers are required to understand the concept of optimization to produce efficient and low-cost designs. They also need to maximize available materials or resources and perform optimization processes through the analysis of mathematical functions. Additionally, engineers use math functions such as polynomials in calculus and algebra in order to perform numerical analyses.
Learning Objectives
After this activity, students should be able to:
- Explain an optimization process in engineering design.
- Use the geometric net to build a regular prism and to express the variable prism’s volume formula as a single variable cubic polynomial function.
- Solve the graph of this polynomial to determine the value for which this function reaches a maximum, and with this value find the dimensions of the geometric net for the maximum volume possible.
Educational Standards
Each Teach Engineering lesson or activity is correlated to one or more K-12 science,
technology, engineering or math (STEM) educational standards.
All 100,000+ K-12 STEM standards covered in Teach Engineering are collected, maintained and packaged by the Achievement Standards Network (ASN),
a project of D2L (www.achievementstandards.org).
In the ASN, standards are hierarchically structured: first by source; e.g., by state; within source by type; e.g., science or mathematics;
within type by subtype, then by grade, etc.
Each Teach Engineering lesson or activity is correlated to one or more K-12 science, technology, engineering or math (STEM) educational standards.
All 100,000+ K-12 STEM standards covered in Teach Engineering are collected, maintained and packaged by the Achievement Standards Network (ASN), a project of D2L (www.achievementstandards.org).
In the ASN, standards are hierarchically structured: first by source; e.g., by state; within source by type; e.g., science or mathematics; within type by subtype, then by grade, etc.
NGSS: Next Generation Science Standards - Science
| NGSS Performance Expectation | ||
|---|---|---|
|
HS-ETS1-3. Evaluate a solution to a complex real-world problem based on prioritized criteria and trade-offs that account for a range of constraints, including cost, safety, reliability, and aesthetics, as well as possible social, cultural, and environmental impacts. (Grades 9 - 12) Do you agree with this alignment? |
||
| Click to view other curriculum aligned to this Performance Expectation | ||
| This activity focuses on the following Three Dimensional Learning aspects of NGSS: | ||
| Science & Engineering Practices | Disciplinary Core Ideas | Crosscutting Concepts |
| Evaluate a solution to a complex real-world problem, based on scientific knowledge, student-generated sources of evidence, prioritized criteria, and tradeoff considerations. Alignment agreement: | When evaluating solutions it is important to take into account a range of constraints including cost, safety, reliability and aesthetics and to consider social, cultural and environmental impacts. Alignment agreement: | New technologies can have deep impacts on society and the environment, including some that were not anticipated. Analysis of costs and benefits is a critical aspect of decisions about technology. Alignment agreement: |
Common Core State Standards - Math
-
Understand that polynomials form a system analogous to the integers, namely, they are closed under the operations of addition, subtraction, and multiplication; add, subtract, and multiply polynomials.
(Grades
9 -
12)
More Details
Do you agree with this alignment?
-
For a function that models a relationship between two quantities, interpret key features of graphs and tables in terms of the quantities, and sketch graphs showing key features given a verbal description of the relationship.
(Grades
9 -
12)
More Details
Do you agree with this alignment?
-
Graph functions expressed symbolically and show key features of the graph, by hand in simple cases and using technology for more complicated cases.
(Grades
9 -
12)
More Details
Do you agree with this alignment?
-
Graph linear and quadratic functions and show intercepts, maxima, and minima.
(Grades
9 -
12)
More Details
Do you agree with this alignment?
-
Graph square root, cube root, and piecewise-defined functions, including step functions and absolute value functions.
(Grades
9 -
12)
More Details
Do you agree with this alignment?
-
Use trigonometric ratios and the Pythagorean Theorem to solve right triangles in applied problems.
(Grades
9 -
12)
More Details
Do you agree with this alignment?
-
Apply geometric methods to solve design problems (e.g., designing an object or structure to satisfy physical constraints or minimize cost; working with typographic grid systems based on ratios).
(Grades
9 -
12)
More Details
Do you agree with this alignment?
International Technology and Engineering Educators Association - Technology
-
Students will develop an understanding of the attributes of design.
(Grades
K -
12)
More Details
Do you agree with this alignment?
-
Students will develop an understanding of engineering design.
(Grades
K -
12)
More Details
Do you agree with this alignment?
-
Students will develop an understanding of the role of troubleshooting, research and development, invention and innovation, and experimentation in problem solving.
(Grades
K -
12)
More Details
Do you agree with this alignment?
State Standards
Texas - Math
-
apply mathematics to problems arising in everyday life, society, and the workplace;
(Grades
9 -
12)
More Details
Do you agree with this alignment?
-
use a problem-solving model that incorporates analyzing given information, formulating a plan or strategy, determining a solution, justifying the solution, and evaluating the problem-solving process and the reasonableness of the solution;
(Grades
9 -
12)
More Details
Do you agree with this alignment?
-
select tools, including real objects, manipulatives, paper and pencil, and technology as appropriate, and techniques, including mental math, estimation, and number sense as appropriate, to solve problems;
(Grades
9 -
12)
More Details
Do you agree with this alignment?
-
communicate mathematical ideas, reasoning, and their implications using multiple representations, including symbols, diagrams, graphs, and language as appropriate;
(Grades
9 -
12)
More Details
Do you agree with this alignment?
-
create and use representations to organize, record, and communicate mathematical ideas;
(Grades
9 -
12)
More Details
Do you agree with this alignment?
-
analyze mathematical relationships to connect and communicate mathematical ideas; and
(Grades
9 -
12)
More Details
Do you agree with this alignment?
-
display, explain, and justify mathematical ideas and arguments using precise mathematical language in written or oral communication.
(Grades
9 -
12)
More Details
Do you agree with this alignment?
-
Functions. The student uses process standards in mathematics to explore, describe, and analyze the attributes of functions. The student makes connections between multiple representations of functions and algebraically constructs new functions. The student analyzes and uses functions to model real-world problems. The student is expected to:
(Grades
9 -
12)
More Details
Do you agree with this alignment?
-
determine and analyze the key features of exponential, logarithmic, rational, polynomial, power, trigonometric, inverse trigonometric, and piecewise defined functions, including step functions such as domain, range, symmetry, relative maximum, relative minimum, zeros, asymptotes, and intervals over which the function is increasing or decreasing;
(Grades
9 -
12)
More Details
Do you agree with this alignment?
-
analyze situations modeled by functions, including exponential, logarithmic, rational, polynomial, and power functions, to solve real-world problems;
(Grades
9 -
12)
More Details
Do you agree with this alignment?
-
Number and measure. The student uses process standards in mathematics to apply appropriate techniques, tools, and formulas to calculate measures in mathematical and real-world problems. The student is expected to:
(Grades
9 -
12)
More Details
Do you agree with this alignment?
-
determine the value of trigonometric ratios of angles and solve problems involving trigonometric ratios in mathematical and real-world problems;
(Grades
9 -
12)
More Details
Do you agree with this alignment?
Materials List
Each group needs:
- two 56 cm x 71 cm (~22 in x 28 in) cardstock sheets (or poster board)
- meter stick (or yardstick)
- regular 30 cm ruler
- scissors
- pencils
- scotch tape
- glue stick
- wrapping paper (students can get creative here and bring in their own)
- computer with Google Sheets, PowerPoint, or other drawing and graphing software
- color pencils, pens, markers, or crayons; if students decide to decorate the bars by themselves
To share with the entire class:
- Students Activity Guide
- color printer
Worksheets and Attachments
Visit [www.teachengineering.org/activities/view/ind-2390-sweet-volume-polynomials-design-optimization] to print or download.Pre-Req Knowledge
Before undertaking this activity, students should have an understanding of regular prisms, volume computational formulas, right triangles, trigonometric ratios, polynomials multiplication, polynomials relative maximum and minimum, functions analysis with a graphing calculator, systems of equations solution by substitution method, and regular prisms construction from geometry nets.
Introduction/Motivation
What is the biggest candy bar you have ever seen? [Expect students to give several answers such as large Hershey Kisses, Toblerone or Hershey’s chocolate bars. You may want to bookmark a few webpages that show images of these chocolate bars and show them to the class.]
A common practice during the holiday season among confectioners is to produce jumbo candy bars— they make great gift ideas! Imagine that you are engineers working as part of the production team in a brand new chocolate factory. Your team received the instructions from CEO to produce a container for a jumbo chocolate bar. The company wants to produce these bars in order to compete with Hershey, Toblerone, and others. In a meeting with the CEO and the marketing team, you receive the specifications for your design: the container must be in the shape of a regular prism with isosceles trapezoids as bases. The angle between the non-parallel sides, or legs, and the longest base of the trapezoids must be 60 degrees. You also have constraints on your materials: you have to design your prism with a surplus of a packing material the company purchased a long time ago, but did not fully use. The CEO wants you optimize the design by using as much of this material as possible, which means that you must cut as large a volume as possible from a 56 cm x 71 cm (~22 in x 28 in) sheet of cardstock.
You will also work with the company’s marketing team to come up with a marketable name and decoration for your jumbo chocolate bar. One final constraint: you have a relatively short deadline, five days, to present your final prototype!
Procedure
Background
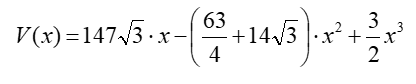
Draw two possible geometric nets on a 56 cm x 71 cm (~22 in x 28 in) sheet of cardstock. Once cut and folded, these nets create the required trapezoidal prism with maximum volume. One is the vertical configuration, with the bases of trapezoidal bases parallel to the poster board’s short side (Figure 1a), and the other is the horizontal configuration, with the bases of the trapezoidal bases parallel to the poster board’s long side, (Figure 1b). The first one will produce a regular bar while the second one makes a “fun-size” shaped bar.

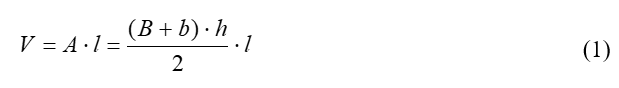
times the length l of the prism (Figure 2):

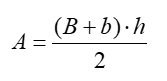
First, focus on the trapezoidal prism’s base. The angle between the trapezoid’s legs and its longest base must be 60 degrees. With this knowledge, the triangle formed by the trapezoid’s leg x, its height h and the longest base B is a special 30-60-90 right triangle (Figure 3). Using the standard relationships between the sides of this special right triangle (Figure 3) and the above geometric nets (Figure 1), it is possible to express the variables in the volume’s formula (1) in terms of the trapezoid’s leg x only. On the geometric nets, the length x represents the cut needed to create a prism with maximum volume.

(a). Vertical Configuration.

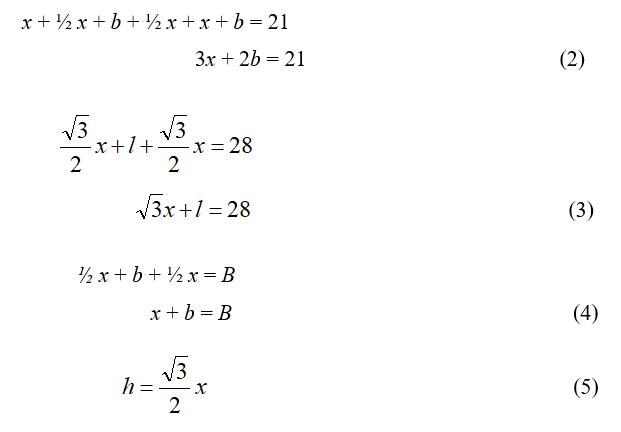
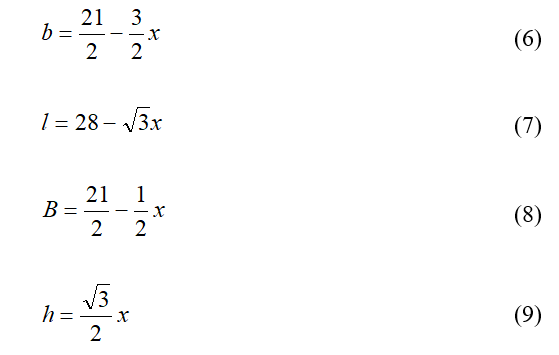
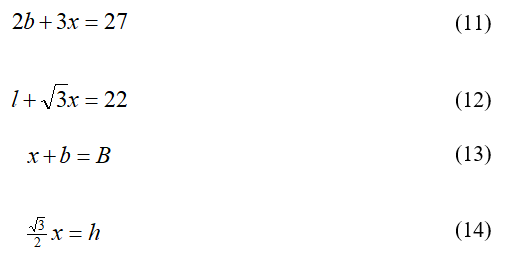
From the prism’s net in Figure 4, figuring in a subtraction of 2.5 cm (~1 in) for the prism’s tab (Figure 1), it is easy to see that the 30-60-90 special right triangle relationships between its sides (Figure 3) and the variables in formula (1) may be written in terms of the trapezoid length x and the cardstock sheet dimensions:
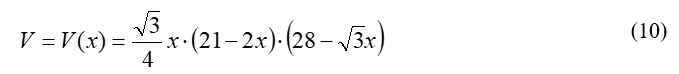
From the graph of equation (10), determine the x-value for which the volume of the trapezoidal prism is at its maximum (Figure 5):
Note: The graph in Figure 5 may lead students to think that any x-value between 0 and 10.5 is possible as a length for the trapezoid’s leg. However, this is not true: variable b will be negative for x-values greater than 7 in equations (6) through (9). In other words, 0 < x < 7.

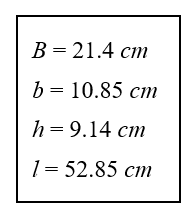
The trapezoidal prism has a maximum volume of 7.783 L (474.97 in3) for x = 10.5486 cm (4.153 in) Using equations (6) through (9), determine the dimensions of the prism.
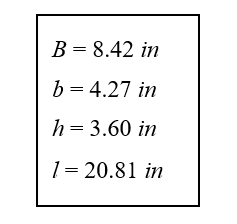
When constructing the prism, use centimeters with x = 10.5486 cm:
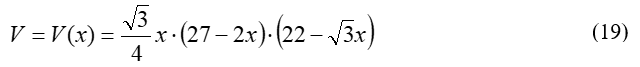
Following the same reasoning as in the vertical configuration, the trapezoidal prism’s volume can again be expressed in terms of the trapezoid’s length x. From the prism net in Figure 6:

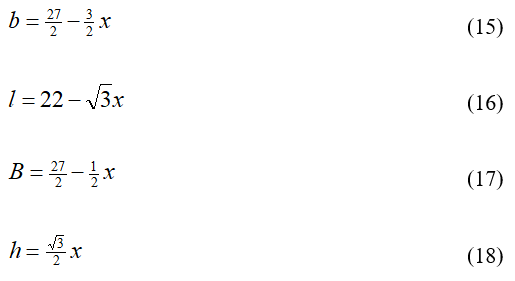

Note: Like the vertical configuration, the graph in Figure 7 could make students think that any x-value between 0 and 12.7, may be used as a length for the trapezoid’s leg. However, variable b will be negative for x-values greater than 9. Because all the dimensions of the prism must be positive, only x-values between 0 and 9 produce positive values for all equations (15) through (18).
Before the Activity
- Bookmark the following webpage: https://jerseykids.net/2015/10/26/review-hershey-chocolate-world-with-families-review/
- This page shows a giant Hershey’s chocolate bar. You can also do a Google search of “giant chocolate bars for sale”, and bookmark some of the results.
Use these bookmarks to engage the students. If you want to achieve a greater impact, present a real extra-large candy bar in class! (Because novelty-size candy bars can be expensive, this is an optional suggestion.)
- Have enough 56 cm x 71 cm (~22 in x 28 in) cardstock for all your groups; at least two per team.
- Ensure students have enough building and measuring material (yardsticks, rulers, scissors, glue stick, tape, etc.) to construct the prisms in class.
- Create a couple of small models before the activity to help students be aware of the possible problems they may encounter during the prism design and construction.
- Have enough copies of the Students Activity Guide available.
With the Students
Day 1
- Distribute the Students Activity Guide.
- Give the Area and Volume Pre-Quiz.
- Conduct the Introduction/Motivation.
- Allow students to select partners with whom to work as well as the chocolate bar configuration they want to optimize: a regular bar (vertical configuration) or a “fun-size” bar (horizontal configuration).
- Let students begin working on the geometric nets included in the Students Activity Guide (Figure 4 or Figure 6); tell them to discuss how they can solve the problem.
- If students struggle to set up the trapezoidal prism’s volume function (which may be likely), tell them check the solution of the simpler problem in the Students Activity Guide - Annex A: the rectangular prism with maximum volume that can be cut from a 56 cm x 71 cm (~22 in x 28) in cardstock. Help them to understand the strategy and the substitution method used to express the prism’s volume formula as a function of a single variable x. Remind them of the importance of the single variable function used to solve and graph this problem. Explain that all the conditions and constrictions of the problem translate into a system of equations. Students can obtain an expression for the prism’s volume, as a function of a single variable, by combining these equations (via the substitution method).
- Provide the following hint: using the 30-60-90 special right triangle relates to the two bases of the trapezoid. Allow students to continue or finish working on and outlining the geometric nets included in the Students Activity Guide.
Day 2
- Have students continue working in the Students Activity Guide. Once students obtain the prism’s volume function, a third degree polynomial, students may graph this polynomial with a graphing calculator or graphing software (such as Desmos) to locate the value x for which this function has a maximum.
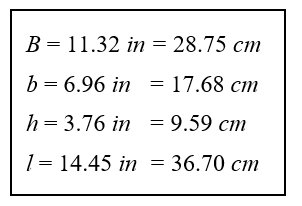
- Instruct students to find other dimensions, as well as the volume of the prism, using the other formulas.
- Using the dimensions they find, instruct students to draw the geometric net of the trapezoidal prism on the 56 cm x 71 cm (~22 in x 28 in) cardstock.
- Tell students to cut, fold, and glue their prism together.
Note: Decorating the prism is a task that students may work on at home and depends on the time available time in class. Students may opt to find and bring in materials for the exterior design of their prism.
Day 3
- Allow students additional time to finish their prism designs.
- Instruct students to begin working on their in-class or video presentations as outlined in the Students Activity Guide.
- Allow for time to students to present in Day 3 or extend into Day 4 and Day 5.

Vocabulary/Definitions
30-60-90 triangle: A special right triangle that always has angles of 30 degrees, 60 degrees, and 90 degrees. The measure of any of the three sides can be found simply by knowing the measure of at least one side in the triangle. The hypotenuse is equal to twice the length of the shorter leg, which is the side opposite the 30 degree angle.
chocolate: A food preparation in the form of a paste or solid block made from roasted and ground cacao seeds, typically sweetened.
cosine: The ratio of the side adjacent to a specified angle to the hypotenuse.
geometric net: A pattern that you can cut and fold to make a model of a solid shape.
isosceles trapezoid: A trapezoid with congruent legs.
polygon: A plane figure bounded by a finite chain of straight-line segments closing in a loop to form a closed chain or circuit.
polynomial: An expression consisting of variables (or indeterminates) and coefficients (or constants), that involve only the operations of addition, subtraction, multiplication, and non-negative integer exponents of variables. The highest power present determines the polynomial degree.
prism: A solid geometric figure whose two end faces are similar, equal, and parallel rectilinear figures, and whose sides are parallelograms.
regular polygon: A polygon that is equiangular (all angles are equal in measure) and equilateral (all sides have the same length).
regular prism : A prism with bases that are regular polygons. When the bases align (one exactly above the other one), the lateral faces are rectangles; when the bases do not align (one directly above the other), the faces are parallelograms.
relative maximum: The value of a function at a certain point in its domain that is greater than or equal to the values at all other points in the immediate vicinity of the point. Also known as local maximum.
relative minimum: The value of a function at a certain point in its domain that is less than or equal to the values at all other points in the immediate vicinity of the point. Also known as local minimum.
sine: The ratio of the side opposite to a specified angle to the hypotenuse.
tangent: The ratio of the side opposite and adjacent to the specified angle.
trapezoid: A quadrilateral with only one pair of parallel sides, called bases. The non-parallel sides are called legs.
trapezoidal prism: A prism with two congruent trapezoidal bases that are connected to each other by four rectangles.
trigonometric ratio: The ratios of the sides of a right triangle that are related with the non-right angles of the triangle. The sides of the triangle are labeled as opposite (in front of the angle) and adjacent (next to the angle) while the hypotenuse is always the side in front of the right angle.
volume: The amount of space occupied by a three-dimensional figure as measured in cubic units.
Assessment
Pre-Activity Assessment
Check in: Verify that students know the formulas to obtain the area of quadrilaterals; in particular, the area of a trapezoid. Check that they can find the volumes of right angle prisms. Give the Area and Volume Pre-Quiz.
Activity Embedded Assessment
Monitor: Monitor (and help) students to see if they are finding the right equations and doing algebra correctly to obtain the proper expression for volume function.
Post-Activity Assessment
Model: The first evaluation in this activity is to obtain the correct dimensions of the prism. The second one is to build a precise model; good models should not have more than a 0.5 cm error from the optimized prism’s dimensions. The teacher can decide on the point deduction for the final grade. The teacher should emphasize that significant errors (more than 0.5 cm) in the student calculations and in the cut-and-fold process will result in a score penalty as engineering design requires precision.
Poster: The teacher should decide the best way to evaluate student learning. Encourage students to summarize their results in a poster. Check for the following poster guidelines in the Students Activity Guide:
- activity title and students’ names
- project objective and a brief description of all the work completed
- selected net prism
- description of the math process, equations used, and polynomial function found
- polynomial function graph with the maximum point and its coordinates displayed
- dimensions of the optimized prism (in inches and in centimeters) and volume
- pictures of the construction process
- picture of the finished model
- references
Depending on the available class time, students may present their posters in-class and explain their work, results as well as present their model. Alternatively, they can record their findings and submit their presentation to the teacher as a video presentation.

Troubleshooting Tips
Feel free to contact the author by email: mramirez2@galenaparkisd.com or by phone: (832) 386-2888 to ask any questions related to this activity.
Activity Extensions
Surface Area
Ask your students the following question: As part of your presentation to the company’s CEO, you have to provide an estimation of the amount of wrapping material needed to cover your jumbo chocolate bar. Because you were required to optimize the available materials, prepare to answer this following question: Is this amount of material you used also an optimized value?
To answer the first question, students need to compute the surface area of the prism, which is the area of the two trapezoidal bases plus the area of the four lateral rectangles. From any of the nets in (Figure 4) or (Figure 6):
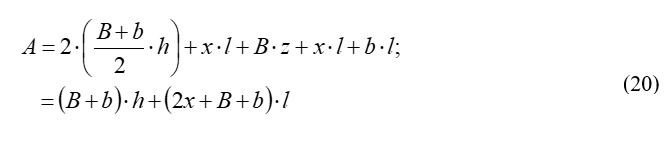
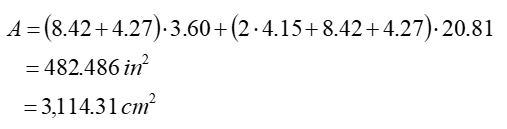
Using the following values (see 10.a above), the surface area for the vertical configuration using volume V = 474.97 in3 is:
As an ordered pair, write down the values for the volume and surface area for each of the configurations and ask the students this question: Do you see something peculiar or special in these values?

The expected answer: The prism with the more volume has less surface area, and vice versa; the prism with the less volume has more surface area. Ask the class: Is this reasonable? Is this what you were expecting? It is not reasonable to think that with more volume you will have more surface area? Should surface area be an optimized value?
To answer this question, ask this follow-up question: How did you find the optimal value for the volume? Their answer: By finding the maximum of the graph of the volume function. Now, ask the students: What you can do in this case? Their answer: Find the same value for the surface area. Have students organize themselves in groups of three, and instruct them to find an x-function for the surface area, graph it, and verify if the area of the prism with maximum volume is optimal or not. Have students summarize their analysis in a poster that includes a good sketch of the graph of their surface area function and that displays the point representing their prism’s area. The prism’s dimensions and its volume should also be in the poster. Students will use this poster to explain their analysis to the class:
For the vertical net: Combine equations (6) through (9) with (20) above to find the surface area function:
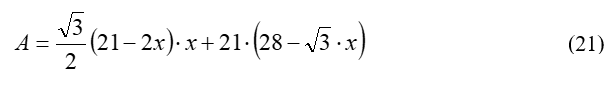
Graphing (21) and its value for x = 4.153, the point for which (10) has its maximum, shows the surface area for the trapezoid with maximum volume is not an optimized value (Figure 8):

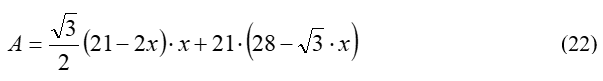
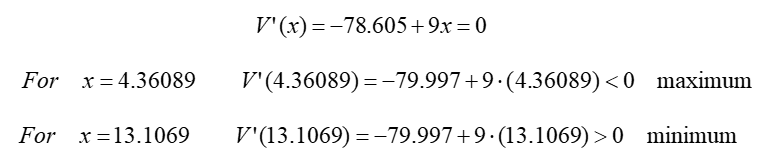
Graphing (22) and its value for x = 4.361, the point for which (19) has its maximum, shows that the surface area for the trapezoid with maximum volume is not an optimized value (Figure 9):

Students may use their posters to explain why the area of the prism is not an optimal value and why the maximum of the graph cannot be used.
Note: The restrictions on the x-values that could be taken as valid entries for the volume functions are also applicable to the surface area functions. Values x > 7 may produce a negative b, B or l, for the vertical net. In the same way, values x > 9 may produce negative dimensions for the horizontal net. Students may also include this in their analysis.
Activity Scaling
- For higher grades.
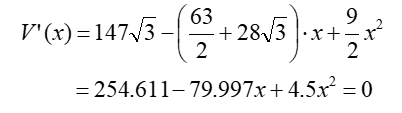
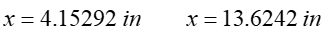
Students with a background in calculus can perform this activity by optimizing the cubic polynomial using its first and second derivatives. The function’s graph is not used here:
Vertical net. Using equation (10), and multiplying the terms:
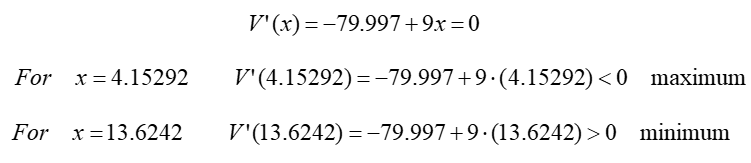
Next, find the derivative of this function and then the values that make this derivative equal to zero:
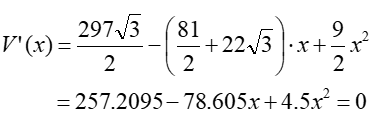
Vertical net. Using equation (19), multiply the terms:
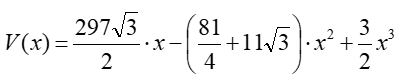
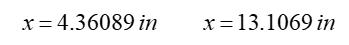
Next, find the derivative of this function, and then the values that make this derivative equal to zero:
Subscribe
Get the inside scoop on all things Teach Engineering such as new site features, curriculum updates, video releases, and more by signing up for our newsletter!More Curriculum Like This

Students learn about linear programming (also called linear optimization) to solve engineering design problems. They apply this information to solve two practice engineering design problems related to optimizing materials and cost by graphing inequalities, determining coordinates and equations from ...

References
“Analysis of Chocolate.” August 15, 2015. Nazish Bohkari. April 23, 2019. https://www.slideshare.net/NazishBokhari/chocolate-analysis-51676357
“Analysis on Chocolate Brands.” March 4, 2015. Yash Jaswani. April 23, 2019.https://www.slideshare.net/saurabh2somu/project-report-on-chocolate
Demana, et al. Precalculus, Graphical, Numerical algebraic (Texas Edition). London, UK. Pearson. 2016.
Larson, et al. Precalculus with Limits. Boston, MA. Houghton Mifflin. 2007.
Larson, et al: Calculus AP 11th Edition. Boston, MA. Cengage. 2018.
When it Comes Chocolate, Choose Dark. February 26, 2015. Clemson Cooperative Extension: Home and Garden Information Center. April 23, 2019. https://hgic.clemson.edu/factsheet/when-it-comes-to-chocolate-choose-dark/
Trapezoidal Prism Volume Calculator. N/A. EasyCalculation.com. April 23, 2019. https://www.easycalculation.com/area/volume-of-trapezoidal-prism.php
Trapezoidal Prism Volume. N/A. Tutorvista.com. April 23, 2019. https://math.tutorvista.com/geometry/volume-of-a-trapezoidal-prism.html
Copyright
© 2019 by Regents of the University of Colorado; original © 2018 Miguel R. RamirezContributors
Miguel R. Ramirez, Galena Park High SchoolSupporting Program
Miguel R. Ramirez, high school math teacher, Texas, USAAcknowledgements
The author expresses his thanks to Kimberly Martin, Galena Park High School Principal; Robert Derr, Galena Park High School Math Department Chair; Shamel Ali, Galena Park High School Math Specialist
Last modified: July 20, 2023
User Comments & Tips