
Quick Look
Grade Level: 11 (9-12)
Time Required: 45 minutes
Expendable Cost/Group: US $0.00
Group Size: 2
Activity Dependency: None
Subject Areas: Computer Science, Science and Technology
Quick Look 

- Grade Level:
- 11 (9 – 12)
- Time Required:
- 45 minutes
- Group Size:
- 2
- Subject Areas:
-
Computer Science Science and Technology

Summary
Using the Netlogo platform to run simulations of a basic neural network called the perceptron, students explore a basic, yet powerful, model of machine learning as they are challenged to understand the logic. Students engage in the perceptron model and discover a weakness of the model. The students then move on to run simulations on Netlogo with the multi-layer perceptron which overcomes the weakness in the original perceptron model.
Engineering Connection
Machine learning is the process by which a computer is able to improve its own performance by continuously incorporating new data into an existing statistical model.
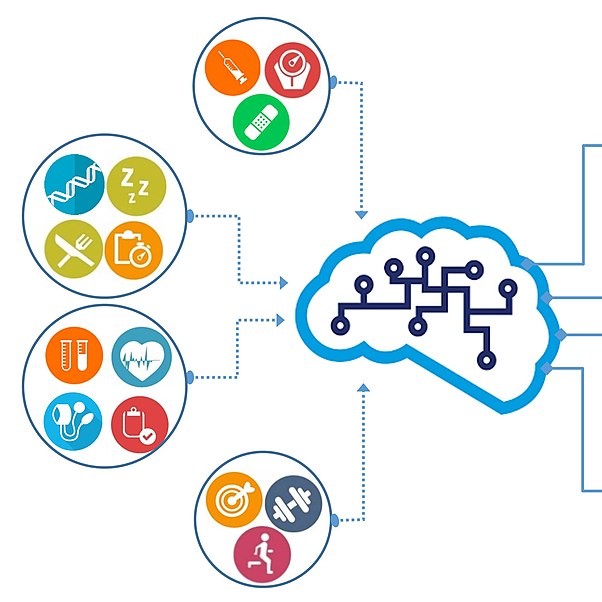
Computer scientists use machine learning to automate the process of data analysis in a variety of industries. In the financial sector, engineers apply principles of machine learning to engineer systems that can gain insights into complex data sets to prevent fraud. Healthcare professionals can use machine learning to help improve diagnoses and treatments. Computer scientists must understand the logic of the particular machine learning model and mathematics involved in machine learning in order to choose the appropriate model and parameters.
In this activity, students play the role of the computer scientist by comparing the logic of two machine learning models including their strengths and weaknesses.
Learning Objectives
After this activity, students should be able to:
- Identify the parameters used in the perceptron model.
- Describe the process the perceptron uses to learn a rule.
- Identify the major weakness of the single perceptron model.
Educational Standards
Each TeachEngineering lesson or activity is correlated to one or more K-12 science,
technology, engineering or math (STEM) educational standards.
All 100,000+ K-12 STEM standards covered in TeachEngineering are collected, maintained and packaged by the Achievement Standards Network (ASN),
a project of D2L (www.achievementstandards.org).
In the ASN, standards are hierarchically structured: first by source; e.g., by state; within source by type; e.g., science or mathematics;
within type by subtype, then by grade, etc.
Each TeachEngineering lesson or activity is correlated to one or more K-12 science, technology, engineering or math (STEM) educational standards.
All 100,000+ K-12 STEM standards covered in TeachEngineering are collected, maintained and packaged by the Achievement Standards Network (ASN), a project of D2L (www.achievementstandards.org).
In the ASN, standards are hierarchically structured: first by source; e.g., by state; within source by type; e.g., science or mathematics; within type by subtype, then by grade, etc.
NGSS: Next Generation Science Standards - Science
-
Analyze data using tools, technologies, and/or models (e.g., computational, mathematical) in order to make valid and reliable scientific claims or determine an optimal design solution.
(Grades 9 - 12)
More Details
Do you agree with this alignment?
-
Models (e.g., physical, mathematical, computer models) can be used to simulate systems and interactions—including energy, matter, and information flows—within and between systems at different scales.
(Grades 9 - 12)
More Details
Do you agree with this alignment?
-
Create a computational model or simulation of a phenomenon, designed device, process, or system.
(Grades 9 - 12)
More Details
Do you agree with this alignment?
-
Create or revise a simulation of a phenomenon, designed device, process, or system.
(Grades 9 - 12)
More Details
Do you agree with this alignment?
Common Core State Standards - Math
-
Model with mathematics.
(Grades
K -
12)
More Details
Do you agree with this alignment?
-
Summarize, represent, and interpret data on two categorical and quantitative variables
(Grades
9 -
12)
More Details
Do you agree with this alignment?
-
Interpret expressions that represent a quantity in terms of its context
(Grades
9 -
12)
More Details
Do you agree with this alignment?
International Technology and Engineering Educators Association - Technology
-
Students will develop an understanding of the characteristics and scope of technology.
(Grades
K -
12)
More Details
Do you agree with this alignment?
-
Students will develop an understanding of the attributes of design.
(Grades
K -
12)
More Details
Do you agree with this alignment?
-
Students will develop an understanding of and be able to select and use information and communication technologies.
(Grades
K -
12)
More Details
Do you agree with this alignment?
-
Information and communication systems can be used to inform, persuade, entertain, control, manage, and educate.
(Grades
9 -
12)
More Details
Do you agree with this alignment?
-
Analyze how technology transfer occurs when a user applies an existing innovation developed for one function to a different purpose.
(Grades
9 -
12)
More Details
Do you agree with this alignment?
State Standards
Michigan - Math
-
Model with mathematics.
(Grades
K -
12)
More Details
Do you agree with this alignment?
-
Summarize, represent, and interpret data on two categorical and quantitative variables
(Grades
9 -
12)
More Details
Do you agree with this alignment?
-
Interpret expressions that represent a quantity in terms of its context
(Grades
9 -
12)
More Details
Do you agree with this alignment?
Michigan - Technology
-
use digital resources (e.g., educational software, simulations, models) for problem solving and independent learning
(Grades
9 -
12)
More Details
Do you agree with this alignment?
Materials List
Each group needs:
- A computer or device with access to Netlogo via web or download (downloaded version is preferable; the Worksheet assumes students have downloaded the software)
- Electronic or hard copy of the PowerPoint Presentation to share with the entire class.
- Machine Learning Simulation Worksheet.
Worksheets and Attachments
Visit [www.teachengineering.org/activities/view/mis-2484-computer-simulation-artificial-neural-network-activity] to print or download.Pre-Req Knowledge
- Strong math skills and a familiarity with Boolean logic is helpful.
- The background information contained in the associated lesson, How Does Machine Learning Work?
Introduction/Motivation
(Prepare to show the class the PowerPoint Presentation. Though only a few slides are used in this activity, the entire presentation is identical to that shown in the associated lesson, for student reference.)
Has anyone heard of machine learning? What is it? Can anyone give a definition? (Expect answers to be “Artificial Intelligence” and have slides 2 and 3 ready showing the definition of machine learning and that Machine Learning is a subset of Artificial Intelligence.)
Do you have a smartphone? Do you use voice-to-text? Did you know that your smartphone uses machine learning to better understand your specific voice? Machine learning is also used in many other industries as well. (Show slide 4 showing uses of Machine Learning).
Does anyone know when machine learning was first designed? (expect 1990’s or 2000’s). Did you know that this was thought about in the 1940’s with one of the earliest designs coming in 1958?!
Just how does a machine “learn?” In today’s activity, we will be running simulations on the perceptron model and we will look at one other model after that.
Procedure
Background
Conduct the associated lesson, “How Does Machine Learning Work?” in order to set the students up for success. This lesson contains the necessary background information to be successful with this activity.
The Artificial Neural Net- Perceptron on the Netlogo Platform
The simulation allows inputs of 1 or -1 which will result in an output of 1 or -1. The perceptron tries to classify the correct output produced by a function, based on the inputs given. Take some time to familiarize yourself with the platform. See Figure 1.


The multi-layer simulation looks very similar to the single perceptron. Look over Figure 2 and take note of several key differences. The first obvious difference is the hidden layer. A weighted-sum of the input values are passed through a sigmoid function and passed forward just like the single-layered perceptron. The difference here is that the values are passed to the hidden layer and not the final output. This process is repeated at this hidden-layer level and passed to the final output node.
The sigmoid function is used in order to smooth out the values between output values and allows for values between 0 and 1.
Keep in mind, the original values of the inputs in the simulation are either 1 or -1. For purposes of explanation, this uses inputs of 0 and 1. See Figure 3.


A natural question in looking at this graph may be asked by noticing that the values represented by the red curve are less than 1 when the threshold value is between 0.5 and 1. Because the original input is being passed through the sigmoid function, the output no longer represents the usual output (a binary value of either 0 or 1), it is a real number between 0 and 1. This actually corresponds to a probability. The model uses this probability to decide whether the output should be 0 or 1.
Keep in mind, the original input values in this simulation are 1 or -1. The sigmoid function maps negative values (from the weighted sum) to values between 0 and 0.5, and maps positive values to values between 0.5 and 1. The output of the entire network is 1 if the output node is greater than 0.5.
Ultimately, students just need to be made aware that the purpose of the sigmoid function is to smooth out the transition between 0 and 1.
Before the Activity
- Ensure students have access to the Netlogo software.
- Have the PowerPoint and Worksheet handouts available electronically or on paper for students.
- Read through the descriptions of both models on the Netlogo website.
- Netlogo single Perceptron description
- Netlogo multi-layer description
- Run through the activity using the Netlogo simulations. Be sure to run simulations on both the perceptron and multi-layer perceptron.
With the Students
- Have the students work in pairs. One student can control the simulation while the other student can read through the steps and take notes using the Machine Learning Simulation Worksheet. The partners can switch when the activity switches to the multi-layer perceptron.
- The procedure is roughly outlined here and may differ a bit from the actual worksheet. There are some notes listed here about what to expect whereas the worksheet lets the students discover the answers for themselves, along with some help from the teacher.
- At the end of the worksheet there are some additional things to try with the multi-layered perceptron.
- Manipulate the learning-rate parameter. Can you speed up or slow down the training? (Answer: the speed of the training can be adjusted by adjusting the learning rate and examples per epoch.)
- Switch back and forth between OR and XOR several times during a run. Why does it take less time for the network to return to 0 error the longer the network runs? (Answer: The longer the model sits with a particular function the longer it will take to re-learn the next function.)
General overview of the procedure
- Have the students open Netlogo from their PC.
- Have the students go to File - Models Library and choose “Artificial Neural Net - Perceptron” from the “Computer Science” folder.
- Click Open at the bottom.
- Click on the drop-down under “Target function” and choose “or”.
- Click on the Setup button.
- Click “On” on the “show weights?” button.
- Adjust the learning rate to a value somewhere between 0 and 0.1
- Adjust the examples per epoch to 1. An epoch is one set of training data. By making these adjustments, you are giving the model one set of inputs and a very low learning rate.
- Notice the weights and thickness of the lines.
- Click the “train once” button.
Notice:
- The weights - You should have seen these values change from the initial weights.The rule learned - this is the Perceptron’s attempt at finding the boundary line and to divide true outputs and false outputs.
- You may not see anything in the “Error vs. Epochs” graph just yet but keep an eye on this. This is an indicator of how well the model is learning.
- Click on train once again. Notice what happened to each of the items listed above.
- Click on train once again. Note any changes.
- Click on the “train” button. This will continually train the model. Let this run for about 10-15 seconds and keep watching the “Error vs. Epochs” graph.
- The model eventually learns the correct rule as indicated by the boundary line settling down and not changing from epoch to epoch. Also, the “Error vs. Epoch” graph will settle into showing no error.
- On the right-hand side, you will see “3. Test” this area allows you to test the model after it has been trained. Click on this several times and note how many correct answers in a row.
- Click on the setup button again. Instead of training, go straight to the test section and try to test the model 5 times. Make a note of how many incorrect answers are obtained.
- Change the “target function” to “And” and repeat the same process as above.
- Change the “target function” to “XOR” and repeat the same process as above.
- You should notice something very interesting about XOR.
- Change the learning rate to around 0.5 and the examples per epoch to 500 (default values) and click on “train.”
- You will notice the XOR function cannot be learned by the perceptron model as indicated by the rule learned line and “Error vs. Epochs” graph never settling down.
Multi-layer
- Click on File, Models Library and choose artificial neural net-multi-layer.
- Choose “OR” under target function but do not make any adjustments to the learning rate.
- Click “On” in the “Show weights” box.
- Click on train and hit the train button once you see the “Error vs. Epochs” graph settle to no error. Notice how quickly this happens.
- Click test several times and note any incorrect answers.
- Click on setup to reset.
- Click on test several times and note any incorrect answers. Change the inputs in the test section and try each combination a few times.
- Choose “XOR” under the target function and repeat the above process.
Vocabulary/Definitions
algorithm: Process or set of rules to be followed in calculations.
artificial neural network: Type of machine learning inspired by the structure of the human brain. These systems learn, not by being given explicit instructions, but by looking at samples of information.
Boolean data type: Data type with one of two possible values, often noted as true or false.
epoch: Complete run through all the training instances
learning rate: Value used in machine learning to control how much of an adjustment is made to the parameters between attempts during the training phase.
linear separable: If two sets of points can be divided by a single line, these points are said to be linearly separable.
machine learning: Process by which a computer is able to improve its own performance by continuously incorporating new data into an existing statistical model
sigmoid function: Type of function with an s-shaped curve.
step function: Function that increases or decreases abruptly from one constant value to another
training data: In machine learning, training data is the data used to train the model. The outcome is known and used to check the model and calculate an error. This error is then used along with the learning rate to adjust the parameters of the model.
XOR: Exclusive, for example one or the other, but not both.
Assessment
Pre-Activity Assessment
Introduction/Motivation Discussion: Lead students through the Introduction/Motivation section, which contains various questions for a class discussion to get students thinking about machine learning and its applications.
Activity Embedded Assessment
Machine Learning Simulation: Have student pairs complete the Machine Learning Simulation Worksheet as they work through the Netlogo simulation. Ensure students are working together and that each student has a chance to control the simulation.
Post-Activity Assessment
Worksheet Completion: Collect students’ Machine Learning Simulation Worksheet. Check that students worked through the entire worksheet and carefully recorded their simulation results.
Troubleshooting Tips
If using the web version: In case there are connectivity issues, have the downloaded version of Netlogo available to provide a demonstration.
Activity Extensions
See attachment for additional questions.
Additional Multimedia Support
NetLogo Software: http://ccl.northwestern.edu/netlogo/download.shtml
Subscribe
Get the inside scoop on all things TeachEngineering such as new site features, curriculum updates, video releases, and more by signing up for our newsletter!More Curriculum Like This

Students learn about the first attempts at machine learning and specifically about the perceptron model—a simplified model of a biological neuron.
Students design a machine learning model that can predict whether a patient has diabetes. Students first learn about the diabetes epidemic and the relationship between machine learning and healthcare. They then create a simple program using machine learning that can predict whether a patient has dia...
References
Toward Data Science, Medium.com. https://towardsdatascience.com. Accessed 3/31/2020.
Rand, W. and Wilensky, U. NetLogo Artificial Neural Net - Perceptron model. Center for Connected Learning and Computer-Based Modeling, Northwestern University, 2006. http://ccl.northwestern.edu/netlogo/models/ArtificialNeuralNet-Perceptron. Accessed 3/31/2020.
Rand, W. and Wilensky, U. NetLogo Artificial Neural Net - Multilayer model. . Center for Connected Learning and Computer-Based Modeling, Northwestern University, 2006. http://ccl.northwestern.edu/netlogo/models/ArtificialNeuralNet-Multilayer. Accessed 3/31/2020.
Copyright
© 2020 by Regents of the University of Colorado; original © 2019 Michigan State University.Contributors
Chris Tyler, High School Math Teacher, Lansing, MISupporting Program
RET Program, College of Engineering, Michigan State UniversityAcknowledgements
This curriculum was developed under National Science Foundation 1854985. However, these contents do not necessarily represent the policies of the NSF, and you should not assume endorsement by the federal government.
Last modified: December 13, 2021
User Comments & Tips