
Using Data to Optimize Your Vending Machine
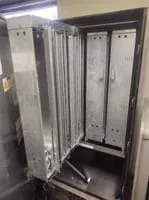 Engineers think about optimizing all their designs. How can we use a vending machine as a case study for optimization?Copyright Christina Hartman, Utah State University
Using concepts of optimization and trade-offs, students must stock a vending machine with popular drinks so they can earn maximum profits to fundraise for a club. Students collect data to determine the most popular drinks among their peers and are presented with a scenario where they need to make an adjustment to their selection. They’re given real-world examples of optimizing in engineering to illustrate the importance of collecting data to improve design-making.
Real-world engineers use optimization to ensure that they’re not wasting resources or time, which ultimately leads to wasted money. Optimization is an important real-world practice among all types of engineers, in the public and private sectors. Along these lines, trade-offs must be made in order to achieve the best possible results. Students are also introduced to the concept of criteria and constraints, which is key across engineering disciplines. Bonus – learn how a vending machine works!
After this activity, students should be able to:
- Understand and explain the concepts of optimizing, criteria, and constraints.
- Optimize simple processes.
- Evaluate data and improve data collection methodologies.
- Identify criteria and constraints for processes and devices.
- STEL-8Q Synthesize data and analyze trends to make decisions about technological products, systems, or processes.
Grades 9-12
Do you agree with this alignment?
- HS-ETS1-2 Design a solution to a complex real-world problem by breaking it down into smaller, more manageable problems that can be solved through engineering.
Grades 9-12
This resource focuses on the following Three Dimensional Learning aspects of NGSS:
Science & Engineering Practices- Design a solution to a complex real-world problem, based on scientific knowledge, student-generated sources of evidence, prioritized criteria, and tradeoff considerations.Do you agree with this alignment?
Disciplinary Core Ideas- Criteria may need to be broken down into simpler ones that can be approached systematically, and decisions about the priority of certain criteria over others (trade-offs) may be needed.Do you agree with this alignment?
Do you agree with this alignment? - Design a solution to a complex real-world problem, based on scientific knowledge, student-generated sources of evidence, prioritized criteria, and tradeoff considerations.
- HS-ETS1-3 Evaluate a solution to a complex real-world problem based on prioritized criteria and trade-offs that account for a range of constraints, including cost, safety, reliability, and aesthetics, as well as possible social, cultural, and environmental impacts.
Grades 9-12
This resource focuses on the following Three Dimensional Learning aspects of NGSS:
Science & Engineering Practices- Evaluate a solution to a complex real-world problem, based on scientific knowledge, student-generated sources of evidence, prioritized criteria, and tradeoff considerations.Do you agree with this alignment?
- Analyze data using tools, technologies, and/or models (e.g., computational, mathematical) in order to make valid and reliable scientific claims or determine an optimal design solution.Do you agree with this alignment?
Disciplinary Core Ideas- When evaluating solutions it is important to take into account a range of constraints including cost, safety, reliability and aesthetics and to consider social, cultural and environmental impacts.Do you agree with this alignment?
Crosscutting Concepts- New technologies can have deep impacts on society and the environment, including some that were not anticipated. Analysis of costs and benefits is a critical aspect of decisions about technology.Do you agree with this alignment?
Do you agree with this alignment? - Evaluate a solution to a complex real-world problem, based on scientific knowledge, student-generated sources of evidence, prioritized criteria, and tradeoff considerations.
The class needs:
- Laptop or tablet with access to PowerPoint, Word and Excel (or Google Docs equivalent)
- Using Data to Manage Your Vending Machine PowerPoint Presentation (PPTX)
- Popular Drink Information Chart Excel (XLSX)
- Access to Google Forms or another survey creation method
- Access to a computer or writing materials to complete the Final Assessment
Experience using vending machines.
An understanding of fundraising is also helpful.
Imagine you need to fundraise for your school. If you haven’t considered one, vending machines are a great option. They allow you to earn money without even being there! But in order to maximize your profits, you’ll need to optimize your vending machine. Optimization is the process of determining the most effective or favorable solution. To make this decision, often requires trade-offs. A trade-off is a decision that involves diminishing or losing one quality, quantity, or property of a solution in return for gaining other aspects. A trade-off occurs when you need to choose between two or more alternatives. It’s basically a compromise where one thing is gained while something else is given up.
In this case with our vending machine, we need to ensure we are offering the most popular drinks to our customers (other students). But we want to sell the drinks that make the most money. The example is similar to how real engineers optimize products and systems to save time and resources, while balancing trade-offs, so their companies can earn a profit while saving consumers money.
Background
Students don’t need much background in order to participate in this activity. Experience using a vending machine is a plus. This activity is optimized as an online/remote activity.
Best practices for survey creation and distribution
- Keep the survey short. If respondents see that that the questionnaire consists of multiple pages, they’ll be more inclined to leave several questions unanswered or not finish the survey.
- Ask clear and direct questions. Respondents won’t know how to fill out a survey if they don’t understand what’s being asked of them
- Focus on asking closed-ended questions. Open-ended questions (also known as free-response questions) require more effort and time to answer than closed-ended questions.
- Keep survey questions neutral. Do not put an opinion into survey questions (or ask a “leading question”) that can influence respondents to answer in a way that doesn’t reflect how they really feel. For example: “We think our customer service representatives are really awesome. How awesome do you think they are?” vs. “How helpful or unhelpful do you find our customer service representatives to be?”
- Keep a balanced set of answer choices – Give respondents a way to provide honest and thoughtful feedback. Writing good survey questions involve using an objective tone. This means adopting a balanced set of answer options, like the following:
- Very helpful
- Helpful
- Neither helpful nor unhelpful
- Unhelpful
- Very unhelpful
- Don’t ask for two things at once - Confusing respondents is equally as bad as influencing their answers. In both cases, they’ll choose an answer that doesn’t reflect their true opinions and preferences. Example: “How would you rate our customer service and product reliability?” Customer service and product reliability are two separate topics. Including both in the same question can push the respondent to either evaluate one or to skip the question altogether. A fix would be “How would you rate our customer service?” And… “How would you rate our product’s reliability?”
- Do a test drive - As a survey creator, there’s no worse feeling than finding mistakes in your survey once it’s already sent (https://www.surveymonkey.com/curiosity/fix-broken-survey-already-sent). Prevent the situation from happening to you by sharing your survey with colleagues, friends, and others in advance. (https://help.surveymonkey.com/articles/en_US/kb/Can-I-test-my-survey-before-it-goes-live) Remember: a pair of fresh eyes can be all it takes to spot mistakes in your survey.
Before the Activity
- Review the attached PowerPoint Presentation (PPTX)
- Decide what format the students should use for their survey (e.g., GoogleForms, Qualtrics, etc.) The class and use the following example to help guide their survey: Vending Machine Drinks Google Form Template
- Review the notes in the PowerPoint Presentation (PPTX) to prepare for discussion
With the Students
Part 1: One Class Period
- Use the Part I of the PowerPoint Presentation (PPTX) to walk through today’s activity. (Don’t move on to Part II.)
- Read each slide aloud and give students time to discuss the prompts on the slides.
- Work as a class to put together the survey. Take student suggestions and provide feedback as needed. For example: “Cans of water are very expensive. Will people be willing to pay more for water than soda?” “Do we really need three different flavors of La Croix?” “That drink only comes in bottles, it may not fit.”
- In class, outside of class or as homework, ask students to have their friends fill out the survey. Give each student a target that makes sense for your school’s population (for example, each student surveys three people.) Note: Make sure students know not to have the same people fill out the survey multiple times.
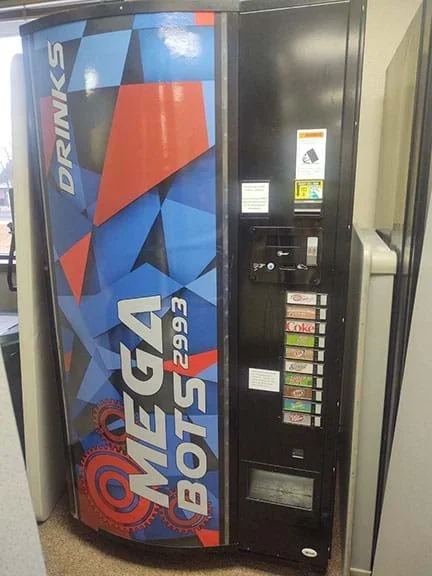 How could you optimize a vending machine?Copyright Christina Hartman, Utah State University
Part 2: ½-1 Class Period
- Compile student survey results and take a look at the survey results. Discuss the drinks that will be put in the machine – any surprises?
- Use the Part II of the PowerPoint Presentation (PPTX) Discuss ways the survey could be improved to produce more valid results.
- Examine the Popular Drink Information Chart (XLSX) to gain some insight into the factors you’ll need to consider to make a more ethical vending machine that the principal will approve of. Students are free to decide for themselves how to best balance profit with sustainability and nutrition. The class can also use copies of the chart to add and subtract data based on other food items or beverages, as needed.
- Either use the rest of class to have students work on their Final Assessment or have them take home as homework.
- constraints
- Limitations or framework a design must work around.
- criteria
- Elements a design must have.
- data
- Facts and statistics collected for reference or analysis.
- optimization
- Make the best or most effective use of (a situation, opportunity, or resource).
- trade-off
- A situational decision that involves diminishing or losing one quality, quantity, or property of a set or design in return for gains in other aspects.
Pre-Activity Assessment
Questions for the class:
- Do students understand the reason for fundraising for teams and clubs?
- Do they understand how a vending machine works?
Note: Asking these questions informally and gauging student response should be sufficient.
Activity Embedded (Formative) Assessment
Ensure that all students work to get responses to the survey the class designs, try to get students engaged in the class discussions prompted in the PowerPoint and gauge their responses. Be sure to see PowerPoint notes for possible discussion points.
Post-Activity (Summative) Assessment
Have students complete the essay outlined in the Final Assessment slide of the PowerPoint Presentation (PPTX) (Slide #14). Their individual responses will demonstrate what they learned from the activity as a whole.
If you choose not to use the Google Form for your survey, you’ll need to think of another method. This activity will work well with a paper survey that you print off yourself and hand out to students using the Google Form and PowerPoint as examples.
Optimizing and criteria/constraints are both broad engineering principles that will easily tie into future design units.
Provide more drink options such as cold coffee, Vitamin Water, Gatorade, etc. with their nutritional value, etc. in the Excel table.
Give each drink a price such that students must weigh earning maximum profit while serving healthier drinks that may or may not be recycled.
This activity should work as-is in the grades listed.
Please note: If distributing the survey to students outside the class isn’t possible, have students in the class take the survey on their own once they’ve created it.
Corporation., T. M. (0AD). Toyota Production System: Vision & Philosophy: Company. Toyota Motor Corporation Official Global Website. https://global.toyota/en/company/vision-and-philosophy/production-system/.
Leblanc, Rick. “The Decomposition of Waste in Landfills.” The Balance SMB, January 16, 2021. https://www.thebalancesmb.com/how-long-does-it-take-garbage-to-decompose-2878033
The Mag. “Frederick Winslow Taylor, the Patron Saint of the Shovel.” Mental Floss, April 27, 2015. https://www.mentalfloss.com/article/63341/frederick-winslow-taylor-patron-saint-shovel.
Contributors
Christina Hartman; Amy A. Wilson-Lopez; Angie Minichiello; Theresa Green; Landon Ashcroft
Supporting Program
Learning from Engineers to Develop a Model of Disciplinary Literacy, College of Engineering, Utah State University
Acknowledgements
This material was developed based upon work supported by the National Science Foundation under grant no. EEC 1664228—Learning from Engineers to Develop a Model of Disciplinary Literacy in the College of Engineering, Utah State University. Any opinions, findings, and conclusions or recommendations expressed in this material are those of the authors and do not necessarily reflect the views of the National Science Foundation.
Copyright
2021 by Regents of the University of Colorado; original © 2021 Utah State University