
What's Wrong with the Coordinates at the North Pole?
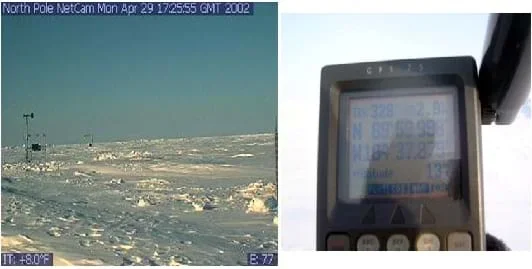 Figure 1. (left) A view from the NOAA North Pole camera. (right) A reading from the North Pole taken on a handheld GPS device. The North Pole is a region of the Earth where a conventional coordinate system such as Universal Trans Mercator (UTM), due to its design, is not as useful. Instead, the Universal Polar Stereographic (UPS) coordinate system is most often used at the North and South Poles.Copyright NOAA http://www.arctic.noaa.gov/npole/2002/images/enlarged/noaa-2002-0429-1724-big.jpg (right) (C) 2004 Vicaar International Projects and Expeditions. Used with permission. http://www.northpolextreme.com/coordinates-at-north-pole.htm
Students complete a self-guided exercise in worksheet format combined with Google Earth that helps them explore practical and observable differences between different projection and coordinate systems. The activity improves their skills in using various Google Earth features.
Coordinate systems and projections are used by many different kinds of engineers that need to understand a project in terms of spatial data. This activity asks students to examine and use known systems in terms of the quantities defined within those systems (for example, degrees, minutes, seconds, meters).
After this activity, students should be able to:
- Identify obvious differences in appearance and accuracy between different global projections.
- Explain the difference between spherical geographic coordinate systems and Cartesian geographic systems.
- Demonstrate basic skills in Google Earth such as zooming, locating new places using the search bar, measuring distance, and manipulating multiple GIS layers.
- Provide examples of how engineers use coordinate systems and projections to help solve real-world problems.
New products and systems can be developed to solve problems or to help do things that could not be done without the help of technology.
Grades 6-8
Do you agree with this alignment?STEL-8J Use devices to control technological systems.
Grades 6-8
Do you agree with this alignment?
select tools, including real objects, manipulatives, paper and pencil, and technology as appropriate, and techniques, including mental math, estimation, and number sense as appropriate, to solve problems;
Grades 6-8
Do you agree with this alignment?
design and implement experimental investigations by making observations, asking well-defined questions, formulating testable hypotheses, and using appropriate equipment and technology;
Grades 6-8
Do you agree with this alignment?
Each group needs:
- computer with a Google Earth installation
- grid files for latitude and longitude and UTM/UPS from www.earthpoint.us
- Projections and Coordinates Worksheet (DOC)
Students should have some familiarity with Cartesian coordinate systems and basic computer skills.
Projections are used in GIS in order to take the rounded ellipsoid Earth and make it flat so that it may be mapped. Different projections have different goals in mind. Some are conformal; these projections preserve local shape. Others preserve area (equal-area) or distance (equidistant). An example of a conformal projection is the Mercator projection established in 1569 by Gerardus Mercator, while a common equidistant projection is the Sinusoidal projection (Figures 2-3).
It is important in GIS and when looking at paper maps to know the source of these projections, what they claim to represent accurately, and what is known that they do NOT present accurately. In a GIS, one is often zoomed in on a city-size area or smaller. Thus it is not as simple as in Figure 2 to see what distortions of shape, line, area or angle might be present. Yet even if those distortions are not seen, that does NOT mean that they are not significant. When using a GIS to find the distance between neighboring houses or the exact location of a fire hydrant, it is valuable to know the exact location within 2-3 meters. More error than that may result if the account of the GIS projection is either not known or not examined fully as shown in Figure 3.
For more good information, see the article by ESRI. [3] listed in the Referenes section. Also see some very good visual methods to evaluate the level of distortion in a projection using Tissot's Indicatrix, which uses the distortion of a unit circle projected from the globe onto a flat surface, that may be found in Wikimedia Commons. [4] This is especially important to engineers who are trying to gather and analyze data to solve real-world problems, such as the rate at which oil is spreading during an oil spill.
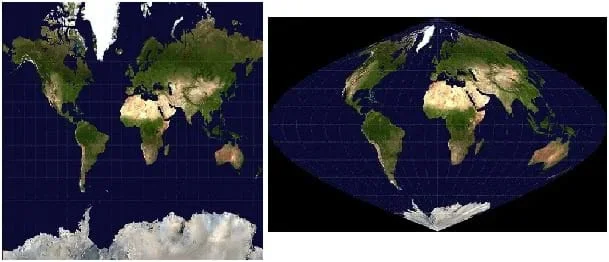 Figure 2. The Earth in two different global projections. The Mercator projection (left) is conformal preserving shape on a small local scale and the Sinusoidal projection (right) is equidistant preserving the accuracy of any linear distance.Copyright NASA Blue Marble series via Wikimedia Commons {PD} http://commons.wikimedia.org/wiki/File:Mercator-projection.jpg http://en.wikipedia.org/wiki/File:Sinusoid-projection.jpg.
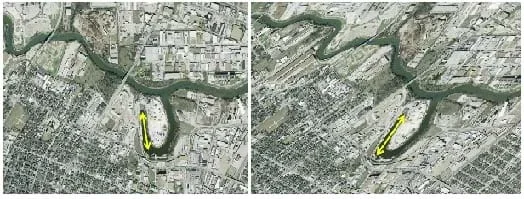 Figure 3. The Earth in two different global projections just east of downtown Houston, TX along Buffalo Bayou. On the left is a Mercator projection and the right is a Sinusoidal projection. The yellow arrow indicates the same oxbow lake-like feature being measured in both projections. In the Mercator projection this distance is 492 meters while it is 510 meters in the Sinusoidal projection.Copyright 2010 Nathan L. Howell, NSF GK-12 Program, College of Engineering, University of Houston. Screen capture and distance measurement done in ESRI ArcGIS® software.
Coordinate systems are important in both concept and practice for geographical information systems (GIS). They serve two main functions. The most important function is to provide a system to uniquely locate any point on the map. That map might describe the surface of the Earth, the lunar surface [5], or the celestial coordinate system[6].
The other important function that coordinate systems provide is that of regionalization. If coordinates have zones (such as UTM) or regions (such as hemispheres in latitude-longitude), then places within those zones can be grouped together for different geographic regions. Again, engineers use this information to gain a better understanding of a specific geographic region that is being studied. For example, an environmental engineering studying a crop field needs to use GIS to understand the layout of that field.
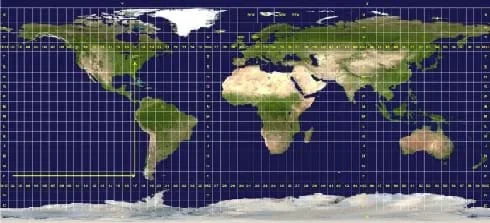 Figure 4. UTM zones across the world. Note that a different projection is used for each of the 60 zones such that the least amount of distortion is in that zone. Then the Cartesian coordinate system applied in the zone (slightly different for each) has the most accuracy.Copyright Wikimedia Commons http://en.wikipedia.org/wiki/File:Utm-zones.jpg.
Geographic coordinates generally fall into two major types of grid systems. Some grid according to the accurate representation of the Earth as a curved surface. These coordinates are like latitude and longitude; they assume that the Earth is a spheroid of some kind, and thus when they are projected onto a flat map, they show curvature and non-orthogonality.
Alternatively, coordinate systems such as UTM take the Earth as a projection and place perfectly orthogonal straight lines on top of that projection. In terms of accuracy, the methods that allow curves are better, but from a usability standpoint the orthogonal systems are better. A prime example of a historic use of regular orthogonal coordinates is that of township, range and section as used in the The Public Land Survey System. This system was developed to efficiently divide the American West into land cadastres that could easily be organized and sold to settlers who did not already know landmarks in the area by which to measure property boundaries. [7]
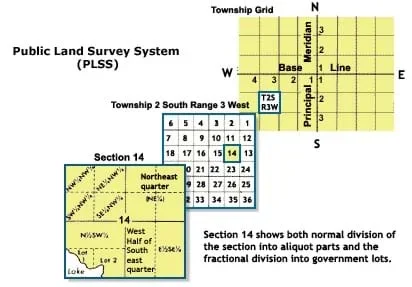 Figure 5. Subdivisions of the rectangular Public Land Survey System showing section, township, and range.Copyright National Atlas Online http://www.nationalatlas.gov/articles/boundaries/a_plss.html
Today we will explore coordinate systems and projections through Google Earth. First, you will look at some different map projections and determine what kind of compromise has been made in the projection to make it look the way it does. The projections are made by experts in GIS and cartography, but anyone who knows even a little about the Earth and its continents and can discern what is happening with these projections.
The second task is in Google Earth. You must open Google Earth and get some specific coordinate systems loaded into your viewer. The first is the standard latitude and longitude geographic system. You will recognize it because it looks like a bunch of lines that are drawn around an orange. The second coordinate system is the Universal Trans Mercator (UTM) system. It looks similar in Google Earth to the geographic lat-long system, but it has lines that are spaced more closely together in the standard UTM zones. Within each UTM zone, the coordinates have a different origin, but the lines are a right-angle orthogonal grid. You should be able to see the difference when you zoom in on the grids such that UTM lines are always right angle, and latitude-longitude lines are slightly off from 90˚ in many cases.
Before the Activity
- If desired, adjust the worksheet to involve places of significance to students, such as the location of their school. Then make copies of the worksheet.
- Make sure that Google Earth is working well on all computers and that the EarthPoint UTM and LatLong grids are working in all aspects (loading lines at different zooms, license issues, turning on and off).
- Run through the individual exercise completely once so that you are familiar with it on your computers and so that you are able to answer questions better.
With the Students
- Give a first time glance of coordinate systems and projections from what has been given in this write-up or review these concepts after having presented the associated lesson, Projections and Coordinate: Turning a 3D Earth into Flatlands.
- Demonstrate (with a computer on a projector if possible) some of the techniques that will be used in Google Earth (zooming, loading the coordinate layers, turning layers on and off, measuring distances) so that students are familiar with it. Consider having a student or two do these steps in front of the entire class with the teacher guiding them.
- Give students time to work on their own using Google Earth and the worksheet. Be sure that they understand that the record of their work is what they fill out on the worksheet. Move about among the students, making observations and answering questions.
- Continue with Step 3 until all students have finished or class time has expired. Depending on class period length, the exercise may require more than one period.
- cartesian coordinate system
- A coordinate system that describes a location based on paired values that correspond to the point's location in reference to a coordinate center. The coordinate center is the intersection of two perpendicular axes which are measured in the same spatial units.
- map projection
- The result of projecting a sphere or spheroid (for example, ellipsoid) onto a flat plane. Projections are sometimes created by mapping the spheroid or a piece of the spheroid onto a standard 3D object such as a cylinder or cone and then unrolling the 3D object so that it is flat.
- conformal
- A geographic projection that preserves only the local shape of a feature.
- equidistant projection
- A geographic projection that preserve the accuracy of point to point distances on the map but not necessarily shape, area or angle.
Activity Embedded Assessment
Student Engagement: Walk around to different students' workstations as they work through the exercise. As the opportunity presents itself, have them demonstrate that they can enter in coordinates in Google Earth (GE) and that they are checking to make sure that GE is giving them the correct location. (That is, does your location as displayed make sense as to where you think that you are going?) The questions that students ask you will indicate how well they understand. It is unlikely that they will be able to simply follow the exercise without at least some guidance from the instructor. Their questions about how to do certain parts provide a chance to ask deeper follow-up questions.
Post-Activity Assessment
Examine the Results: Grade the worksheet with written answers by comparison to the provided answer key. Be sure that the answer key was adjusted to reflect any changes you made to make the questions relate local places. Also, ask students to provide additional engineering examples of when GIS is important to help solve real-world problems.
Contributors
Nathan Howell; Andrey Koptelov
Supporting Program
National Science Foundation GK-12 and Research Experience for Teachers (RET) Programs, University of Houston
Acknowledgements
This digital library content was developed by the University of Houston's College of Engineering under National Science Foundation GK-12 grant number DGE 0840889. However, these contents do not necessarily represent the policies of the NSF and you should not assume endorsement by the federal government.
Copyright
2013 by Regents of the University of Colorado; original © 2010 University of Houston