
Quick Look

- Grade Level:
- 7 (6 – 8)
- Time Required:
- 1 hour
- Group Size:
- 2
- Subject Areas:
-
Measurement Physical Science Physics Problem Solving -
NGSS Performance Expectations:

MS-ETS1-1 MS-ETS1-2 MS-ETS1-4 MS-PS2-2 MS-PS2-4
Summary
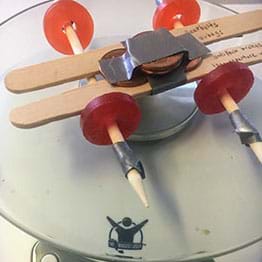
Mint candies aren’t just a tasty treat; they are useful in learning about science and engineering concepts! In this activity, students design, build, and test model race cars made from simple materials (lifesaver-shaped candies, plastic drinking straws, Popsicle sticks, index cards, tape) as a way to explore independent, dependent, and control variables. By investigating how added mass changes the distance traveled, students explore the relationship between force, mass, and motion, connecting their observations to Newton’s Second Law of Motion. They also examine how energy is transferred from potential energy (the raised ramp) to kinetic energy (the moving mint-mobile), and how friction and drag influence the motion of their vehicles. Throughout the activity, students practice the steps of the engineering design process—brainstorming, planning, building, testing, and improving their “mint-mobiles”—while making sense of the science behind motion and energy.
Engineering Connection
When developing a new product or device, engineers go through many iterations of the engineering design process. First, they imagine lots of ideas and share them with their teammates. Then, the team decides on one best design and plans its final materials, specifications, functionality, and aesthetics. Before building a full-scale prototype, they often create a small model to perform tests, varying independent variables such as mass, wheel type, or shape, to see how these changes affect motion and energy transfer. By observing how forces, friction, and energy impact performance, engineers can optimize their designs for speed, stability, and efficiency while keeping cost in mind. Once a model has been refined through testing and improvement, they build it at full scale. This mirrors the scientific process, helping students understand how Newton’s laws of motion, energy transfer, and forces apply in real-world engineering.
Learning Objectives
After this activity, students should be able to:
- Explain the steps of the engineering design process.
- Define criteria and constraints for a specific design problem, considering both performance and real-world limitations.
- Identify independent and dependent variables, and control variables, in experiments involving motion and forces.
- Predict how changes in mass, force, or ramp angle will affect the motion of their mint-mobile.
- Explain how forces (push/pull), friction, and energy transfer (potential to kinetic) influence the performance of their vehicles.
- Use collected data to predict future performance of a design, justifying predictions based on principles of motion and energy.
Educational Standards
Each Teach Engineering lesson or activity is correlated to one or more K-12 science,
technology, engineering or math (STEM) educational standards.
All 100,000+ K-12 STEM standards covered in Teach Engineering are collected, maintained and packaged by the Achievement Standards Network (ASN),
a project of D2L (www.achievementstandards.org).
In the ASN, standards are hierarchically structured: first by source; e.g., by state; within source by type; e.g., science or mathematics;
within type by subtype, then by grade, etc.
Each Teach Engineering lesson or activity is correlated to one or more K-12 science, technology, engineering or math (STEM) educational standards.
All 100,000+ K-12 STEM standards covered in Teach Engineering are collected, maintained and packaged by the Achievement Standards Network (ASN), a project of D2L (www.achievementstandards.org).
In the ASN, standards are hierarchically structured: first by source; e.g., by state; within source by type; e.g., science or mathematics; within type by subtype, then by grade, etc.
NGSS: Next Generation Science Standards - Science
| NGSS Performance Expectation | ||
|---|---|---|
|
MS-ETS1-1. Define the criteria and constraints of a design problem with sufficient precision to ensure a successful solution, taking into account relevant scientific principles and potential impacts on people and the natural environment that may limit possible solutions. (Grades 6 - 8) Do you agree with this alignment? |
||
| Click to view other curriculum aligned to this Performance Expectation | ||
| This activity focuses on the following Three Dimensional Learning aspects of NGSS: | ||
| Science & Engineering Practices | Disciplinary Core Ideas | Crosscutting Concepts |
| Define a design problem that can be solved through the development of an object, tool, process or system and includes multiple criteria and constraints, including scientific knowledge that may limit possible solutions. Alignment agreement: | The more precisely a design task's criteria and constraints can be defined, the more likely it is that the designed solution will be successful. Specification of constraints includes consideration of scientific principles and other relevant knowledge that is likely to limit possible solutions. Alignment agreement: | All human activity draws on natural resources and has both short and long-term consequences, positive as well as negative, for the health of people and the natural environment. Alignment agreement: The uses of technologies and any limitations on their use are driven by individual or societal needs, desires, and values; by the findings of scientific research; and by differences in such factors as climate, natural resources, and economic conditions.Alignment agreement: |
| NGSS Performance Expectation | ||
|---|---|---|
|
MS-ETS1-2. Evaluate competing design solutions using a systematic process to determine how well they meet the criteria and constraints of the problem. (Grades 6 - 8) Do you agree with this alignment? |
||
| Click to view other curriculum aligned to this Performance Expectation | ||
| This activity focuses on the following Three Dimensional Learning aspects of NGSS: | ||
| Science & Engineering Practices | Disciplinary Core Ideas | Crosscutting Concepts |
| Evaluate competing design solutions based on jointly developed and agreed-upon design criteria. Alignment agreement: | There are systematic processes for evaluating solutions with respect to how well they meet the criteria and constraints of a problem. Alignment agreement: | |
| NGSS Performance Expectation | ||
|---|---|---|
|
MS-ETS1-4. Develop a model to generate data for iterative testing and modification of a proposed object, tool, or process such that an optimal design can be achieved. (Grades 6 - 8) Do you agree with this alignment? |
||
| Click to view other curriculum aligned to this Performance Expectation | ||
| This activity focuses on the following Three Dimensional Learning aspects of NGSS: | ||
| Science & Engineering Practices | Disciplinary Core Ideas | Crosscutting Concepts |
| Develop a model to generate data to test ideas about designed systems, including those representing inputs and outputs. Alignment agreement: | Models of all kinds are important for testing solutions. Alignment agreement: The iterative process of testing the most promising solutions and modifying what is proposed on the basis of the test results leads to greater refinement and ultimately to an optimal solution.Alignment agreement: | |
| NGSS Performance Expectation | ||
|---|---|---|
|
MS-PS2-2. Plan an investigation to provide evidence that the change in an object's motion depends on the sum of the forces on the object and the mass of the object. (Grades 6 - 8) Do you agree with this alignment? |
||
| Click to view other curriculum aligned to this Performance Expectation | ||
| This activity focuses on the following Three Dimensional Learning aspects of NGSS: | ||
| Science & Engineering Practices | Disciplinary Core Ideas | Crosscutting Concepts |
| Plan an investigation individually and collaboratively, and in the design: identify independent and dependent variables and controls, what tools are needed to do the gathering, how measurements will be recorded, and how many data are needed to support a claim. Alignment agreement: Science knowledge is based upon logical and conceptual connections between evidence and explanations.Alignment agreement: | The motion of an object is determined by the sum of the forces acting on it; if the total force on the object is not zero, its motion will change. The greater the mass of the object, the greater the force needed to achieve the same change in motion. For any given object, a larger force causes a larger change in motion. Alignment agreement: All positions of objects and the directions of forces and motions must be described in an arbitrarily chosen reference frame and arbitrarily chosen units of size. In order to share information with other people, these choices must also be shared.Alignment agreement: | Explanations of stability and change in natural or designed systems can be constructed by examining the changes over time and forces at different scales. Alignment agreement: |
| NGSS Performance Expectation | ||
|---|---|---|
|
MS-PS2-4. Construct and present arguments using evidence to support the claim that gravitational interactions are attractive and depend on the masses of interacting objects. (Grades 6 - 8) Do you agree with this alignment? |
||
| Click to view other curriculum aligned to this Performance Expectation | ||
| This activity focuses on the following Three Dimensional Learning aspects of NGSS: | ||
| Science & Engineering Practices | Disciplinary Core Ideas | Crosscutting Concepts |
| Construct and present oral and written arguments supported by empirical evidence and scientific reasoning to support or refute an explanation or a model for a phenomenon or a solution to a problem. Alignment agreement: Science knowledge is based upon logical and conceptual connections between evidence and explanations.Alignment agreement: | Gravitational forces are always attractive. There is a gravitational force between any two masses, but it is very small except when one or both of the objects have large mass—e.g., Earth and the sun. Alignment agreement: | Models can be used to represent systems and their interactions—such as inputs, processes and outputs—and energy and matter flows within systems. Alignment agreement: |
Common Core State Standards - Math
-
Represent and analyze quantitative relationships between dependent and independent variables.
(Grade
6)
More Details
Do you agree with this alignment?
-
Summarize numerical data sets in relation to their context, such as by:
(Grade
6)
More Details
Do you agree with this alignment?
-
Construct and interpret scatter plots for bivariate measurement data to investigate patterns of association between two quantities. Describe patterns such as clustering, outliers, positive or negative association, linear association, and nonlinear association.
(Grade
8)
More Details
Do you agree with this alignment?
International Technology and Engineering Educators Association - Technology
-
Students will develop an understanding of the attributes of design.
(Grades
K -
12)
More Details
Do you agree with this alignment?
-
Students will develop an understanding of engineering design.
(Grades
K -
12)
More Details
Do you agree with this alignment?
-
Evaluate designs based on criteria, constraints, and standards.
(Grades
3 -
5)
More Details
Do you agree with this alignment?
-
Modeling, testing, evaluating, and modifying are used to transform ideas into practical solutions.
(Grades
6 -
8)
More Details
Do you agree with this alignment?
-
Troubleshooting is a problem-solving method used to identify the cause of a malfunction in a technological system.
(Grades
6 -
8)
More Details
Do you agree with this alignment?
State Standards
Colorado - Math
-
Summarize numerical data sets in relation to their context.
(Grade
6)
More Details
Do you agree with this alignment?
-
Use variables to represent two quantities in a real-world problem that change in relationship to one another.
(Grade
6)
More Details
Do you agree with this alignment?
-
Visual displays and summary statistics of two-variable data condense the information in data sets into usable knowledge.
(Grade
8)
More Details
Do you agree with this alignment?
-
Construct and interpret scatter plots for bivariate measurement data to investigate patterns of association between two quantities.
(Grade
8)
More Details
Do you agree with this alignment?
Materials List
Each group needs:
- Note: for mint-mobile construction supplies, the exact amounts required depend on the team's vehicle design; rough estimates are provided
- plastic drinking straws (estimated 4-6; make sure the straw diameter is smaller than the mint candy's hole diameter)
- Popsicle sticks (estimated 2-4)
- lifesaver-shaped candies, such as Lifesaver® mints (estimated 3-6)
- index cards (estimated 1-2; or thin cardboard or poster board scraps)
- tape, any type; duct or masking preferred
- scissors
- paper and pencil
- Design Worksheet, one per student
For the entire class to share:
- ramp, for testing, made from sturdy poster board, rigid cardboard or thin wood
- Gather two pieces of poster board, rigid cardboard, or thin wood of different lengths, for testing the independent variable of ramp length
- meter stick, for measuring the distance traveled
- pennies, for added mass during testing (estimated 10-30 pennies; depending on robustness of mint-mobiles, individually tape pennies on vehicles, or tape a little baggie of pennies to the design
- tape, for securing the ramp, meter stick and pennies
- (optional) hot glue gun and glue sticks
Worksheets and Attachments
Visit [www.teachengineering.org/activities/view/cub-2537-exploring-variables-mint-mobiles-middle-school] to print or download.Pre-Req Knowledge
Ability to make measurements using a meter stick.
Introduction/Motivation
(Write Figure 1 on the board as each step is discussed. Start by drawing an arrow in the shape of a circle.)

What do you think engineers do first when they begin to create a new product, say a new type of race car, a new style of backpack, or a new type of skis? That's right, the first thing engineers do is ask; that is, they ask what the product will do, what need they are addressing and what others have done. This also requires conducting research of the problem. Then, an engineer imagines all the possible features and qualities of the product. This takes a lot of creative brainstorming! After an engineer has made a list and some sketches of her/his ideas, all of the engineers in a team get together and share what they have come up with. As a team, they plan on one design by working with the best ideas. Once the details of the design have been decided, the team creates the product; then they get to test it out!
Tests are made on models of the product or device, which are often at a smaller than full-scale size. In the testing phase, the team pays attention to what needs to be changed to the model to make the product work better. The last step of the engineering design process is to improve the design.
While the engineering team designs the product, they first think about the criteria and constraints of their design problem. The criteria are all the things required of their product, or what the product must look like or be able to do in order to be considered successful. The constraints are all the things that limit the design. To help explain these terms, let’s apply them to an example.
Say I am an engineer designing a track for a roller coaster. What are some criteria that my design must meet if my goal is to design an exciting and fast roller coaster? (Allow three minutes for a group discussion. Student may say: include a large drop, lots of loops, long stretch so the cart can go fast, etc.) What are some constraints that limit my design? (Allow three minutes for a group discussion. Students may say: cost, amount of space available to build the coaster, other similar coasters nearby, safety requirements, etc.)
Engineers must also consider forces, motion, and energy as part of their designs. Forces such as pushes and pulls, friction between surfaces, and the conversion of potential energy to kinetic energy affect how a design performs.
While the engineering team tests the product, they pay close attention to all the variables associated with their design. Two important types of variables are: independent and dependent variables. An independent variable is something that an engineer decides to change during each test to see how the results differ. A dependent variable is something that changes as a result of varying the independent variable. In testing, we also have what is called a control. A control is the part of the experiment that is neither changed by the engineer nor is affected by the independent variable. To help explain these new terms let's return to our roller coaster example.
Say I am an engineer testing a roller coaster. I want the cart to go as fast as possible on a track that I have already built. I can change some things to make the cart go as fast as possible—such as its mass, its length, or the type of wheels I use. Can anyone tell me what the independent and dependent variables are in this example? (The independent variables are the mass, length, and types of wheels that the engineer chooses. The dependent variable is the speed of the cart.) Control variables are independent variables that are held constant in an experiment. If you were testing variables that that influence a dependent variable, like speed, you would not test all the variables at the same time because then you would not know which variable(s) influenced the results. So, for example, if you were testing the influence of mass, you would hold the other variables (like length and type of wheels) constant, and test varying masses. So, length and type of wheels would be the control variables. On the contrary, if you were testing length, then you would hold mass constant and it would be a control variable. Thus, control variables are the variables you do not change in an experiment.
Today, working as engineers, we are going to follow the engineering design process and design and build mint-mobiles! After identifying the criteria and constraints of your designs, you will get to choose an independent variable and investigate how changing that variable changes the distance your race cars travel. We'll send the cars down a ramp and measure the distance they travel, using a meter stick. As you test, observe how forces, friction, and energy influence your car’s motion. Think for a moment: what are the independent and dependent variables in this activity and what is the control? (Allow about 10 seconds for students to individually think about this.) Now, share what you think is the correct answer with the person next to you. (Allow three minutes for a group discussion.) Now—are you ready to brainstorm? Great! Let's get started!
Procedure
Background
This activity allows students to explore fundamental concepts of forces and motion. When an object moves, it experiences forces that can cause it to accelerate, slow down, or change direction. Gravity is a key force in this activity, pulling objects down an inclined surface and converting potential energy into kinetic energy. The steeper the incline, the more potential energy is converted, which affects the speed and distance traveled.
Mass plays an important role in motion. According to Newton’s Second Law, the acceleration of an object depends on the net force applied and the object’s mass. Adding mass to a vehicle can influence how it accelerates and how far it travels under the same force.
Friction is another crucial concept. Friction is a force that opposes motion between surfaces in contact. Different design choices—such as wheel material, wheel alignment, and surface texture—can increase or decrease friction, affecting how smoothly and efficiently a vehicle moves.
Newton’s Laws of Motion provide a framework for understanding these interactions:
- First Law: An object will remain at rest or in motion unless acted upon by an external force. In this activity, a mint-mobile will not move until gravity pulls it down the ramp.
- Second Law: The acceleration of an object is directly proportional to the net force and inversely proportional to its mass. Changes in mass or ramp angle illustrate this relationship.
- Third Law: For every action, there is an equal and opposite reaction. The wheels push against the ramp, and the ramp pushes back, propelling the vehicle forward.
Students also see the relationship between energy and motion. At the top of the ramp, the mint-mobile has maximum potential energy. As it rolls down, this energy is converted into kinetic energy, driving motion. Energy can be lost to friction and air resistance, which affects how far the car travels.
Engineers use the engineering design process when they are creating new devices. The main seven steps of the engineering design process are: ask, imagine, research, plan, create, test, and improve. The improving step involves starting over again at the beginning of the design process with "ask," that is, "Where does this device need improvement? How can it be made to perform better?" Once a device has been built the first time, it is never complete! Engineers are always improving what they design. Imagine if the cellular phone had never been improved. Or cars, or computers.
Before the Activity
- Gather materials and list them on the board: plastic drinking straws, Popsicle sticks, lifesaver-shaped mint candies, index cards (or your own modified list of what's available).
- Set up the testing ramps by placing sturdy poster boards or a thin wooden board at an angle over a smooth surface (such as a tabletop). Use tape to secure the ramp; however, ensure that the ramp angle can be modified. Tape a meter stick from the bottom of the ramp along the table, so students can measure the distances traveled.
- Divide the class into teams of two students each.
With the Students
- Distribute copies of the Design Worksheet to students. Ask students to define the criteria and constraints of their mint-mobile design problem. Record student ideas on the board, and have students record their ideas in the Design Worksheet. Criteria include: must be roll down the ramp smoothly, must travel in a straight line (not fall off the ramp), mustn’t fall apart, etc. Constraints include: can only use given materials, car must be small enough to fit on the ramp, etc. Discuss how criteria and constraints relate to real-world engineering and how forces, energy, and motion might affect the design.
- Ask students to list different independent, dependent, and control variables that they discussed with their partner during the activity Introduction/Motivation. List the variables on the board. Have students select one independent variable to test, discuss which independent variables would require the easiest modification to their race cars. Have students record their independent variable on the Design Worksheet. Encourage each group to select a different variable from the group next to them. Discuss how these variables relate to Newton’s Laws and energy transfer (e.g., heavier cars have more inertia, steeper ramps increase gravitational potential energy).
Independent variables include: mass of the mint-mobile, number of wheels, width and height of the mint-mobile, angle of the ramp, height of the ramp.
- To begin planning their mint-mobile designs, give the class three minutes for students to individually brainstorm what their designs might look like on their Design Worksheets. Point out the list of available materials listed on the board, and remind students of the criteria and constraints of their design.
- Next, working with their partners, direct students to share their ideas and make drawings of their final, agreed-upon designs on their Design Worksheets. Require the drawings to list the materials and amounts needed to build their mint-mobiles. Remind them that their designs must be able to test the effects of the independent variable they chose on the depended variable: the distance their mint-mobile travels. Discuss how design choices might affect motion, stability, and energy efficiency.
- Once teams have finished their designs, distribute materials and give them time to build. Encourage students to pay attention to wheel alignment, structural stability, and smooth surfaces to reduce friction and maximize distance.
- Test the mint-mobiles by sending them down the ramp. Have students record their measurements of distance traveled. Allow students to make modifications to their designs to ensure quality results. Discuss how friction, gravity, and mass influence motion. Ask: What can be improved? Does it roll smoothly? Does it roll straight? Can it successfully test their independent variable? Record modifications on the Design Worksheet.
- Now, have the students begin testing their independent variables (see Figure 2). Have students sent their mint-mobiles down the ramp and record the independent variable they chose and their measurements of distance traveled (the dependent variable). Compare results and discuss how changes in mass, ramp angle, or car dimensions affect acceleration, forces, and energy transfer.

- Have students change their independent variable. For example: increase the length of the ramp, add mass to the car, decrease the angle of the ramp, etc. See Figure 3. Have students test their mint-mobiles again and record new measurements for the independent variable and distance traveled.
- Before they test their cars for a third time by changing the independent variable again, ask each group to predict which trial will travel the furthest and why they believe this. Have groups write their predictions and justifications on their Design Worksheets. Encourage them to use Newton’s Laws and energy concepts to explain their reasoning.

- Retest the mint-mobiles and record the new distances traveled after changing the independent variable again.
- In the table on their Design Worksheets, have students record the independent variable measurements and distanced traveled. Students then use these data to determine the effect of changing their independent variable on the distance their mint-mobile traveled. Ask each group which independent variable they chose and how that variable affected the distance their mint-mobile traveled. Record student conclusions on the board.
- As a class, review the collection of results on the board. Conclude with a class discussion (using questions provided in the Assessment section) about the experiment variables, how changing different independent variables impacted the distance traveled by the cars, and the design process. During this discussion, address any misconceptions and reinforce concepts, including Newton’s Laws, energy transfer, friction, and the relationship between mass, force, and acceleration.
Vocabulary/Definitions
brainstorming: A technique of solving specific problems, stimulating creative thinking and developing new ideas by unrestrained and spontaneous discussion.
control variable : A variable that is neither changed by the engineer/tester nor affected by the independent variable.
dependent variable: A variable that changes as a result of changing the independent variable.
engineering design process: The cycle engineers go through while creating a new device: Ask; Research; Imagine; Plan; Create Test; Improve.
friction: A force that resists motion between two surfaces in contact. More friction slows down the mint-mobile.
independent variable: A variable that is intentionally changed by the engineer or tester.
kinetic energy: The energy an object has because of its motion. The faster the mint-mobile moves, the more kinetic energy it has.
mass: The amount of matter in an object. A heavier mint-mobile may travel differently than a lighter one.
Newton’s First Law (Law of Inertia): An object will remain at rest or in uniform motion unless acted upon by an external force.
Newton’s Second Law: The acceleration of an object depends on the net force applied and the object’s mass (F = ma).
Newton’s Third Law: For every action, there is an equal and opposite reaction. For example, the wheels push back on the ramp while the ramp pushes the wheels forward.
potential energy: The stored energy of an object due to its position. A mint-mobile at the top of a ramp has maximum potential energy.
variable : Something that changes while testing an idea, device or system.
Assessment
Pre-Activity Assessment
Identifying Criteria, Constraints & Variables: Have students identify criteria and constraints from different examples of engineering design (such as the roller coaster example in the Introduction/Motivation). Discuss how forces, motion, and energy might affect the design. Next, have students categorize variables from different examples as independent, dependent, or control variables. For instance, in the roller coaster example, the independent variable might be the height of the drop, the dependent variable the speed of the cart, and the controls could include the track length and wheel type. Then, have students discuss in groups the different variables involved in their mint-mobile design activity and how changing them could affect motion.
Activity Embedded Assessment
Brainstorming Design Work: Have students follow the engineering design process by brainstorming different designs on their Design Worksheet; then have them share these ideas with their teammate(s). Have them draw their final group design, listing the exact materials they plan to use. Encourage students to explain how design choices relate to forces, friction, and energy transfer.
Theory to Practice: While researching their designs, have students identify (and list) the independent variables they will be testing, as well as the dependent, and control variables. (Note: Regardless of which independent variable a group selects, the dependent variable is the distance the cart travels, and the controls are the independent variables that students do not change during testing.) Discuss how Newton’s Laws explain why changing mass, ramp angle, or car dimensions affects motion.
Prediction: Before testing the cars in Run 3, ask each group to predict which trial will travel the furthest and justify their reasoning based on scientific concepts such as gravity, inertia, friction, and energy. Have groups write their predictions and justifications on their Design Worksheets.
Graphing: Have students plot the distances the cars go for the three different runs (or tests) of their mint-mobile. Allow students to interpret results graphically and relate their independent variable to distance traveled. Connect findings to Newton’s Laws, energy conservation, and motion principles.
Post-Activity Assessment
Class Discussion: Ask students the following questions and discuss as a class.
- What were the independent, dependent and control variables in this test? (Possible answer: The independent variable was the angle of the ramp, the dependent variable was the distance the cart travels, and the controls included the length of the ramp and mass of the car.)
- Looking at everyone's results, how did changing each independent variable affect the distance traveled by the mint-mobile? Did it travel a shorter or greater distance? (Answers will vary. Expect students to provide a statement on the effect of their independent variable on distance traveled and begin to explain why they think the distance traveled changed. For example, mass as the independent variable: Adding mass caused the cars to travel greater distances; the greater the mass, the further the cars travel.)
- How could you design a mint-mobile to travel a longer distance than any of the mint-mobiles you made or saw today? (Have students combine results from theirs and other groups. Possible answers: Increase the mass of the mint-mobile by using heavier materials and improve the design to reduce drag and friction.)
- What sorts of things did you do at each step of the design process? (Have students share their own experiences, in their own words, that describe the repeating seven-step-loop of the engineering design process: ask, research, imagine, plan, create, test, improve.)
Investigating Questions
- What independent variables could affect the distance traveled by the mint-mobiles? (Possible answers: The material used on the ramp, the mass of the cart, the type of materials used to build the cart, the slope and length of the ramp, the number of wheels, the stability of the cart.)
- What is another dependent variable in this activity that might be of interest to an engineer designing a real race car or roller coaster cart? (Possible answers: Speed, stability.)
- What are the dependent variables that would be affected by these changes? (Possible answers: Speed, distance traveled, and stability.)
Troubleshooting Tips
If students use the straws as axles and find that the straws are bigger than the candy hole diameter, they can use scissors to slit the straws lengthwise, then curl and tape them tighter (so they are narrower) to make straws that spin better in the candy holes.
The mint-mobiles roll best on smooth surfaces rather than the textured surfaces of carpets, so build the testing ramp on a tabletop and place a thin poster board at the bottom of the ramp.
If students' mint-mobiles are quite small, they may not be able to hold many pennies. If so, tape on a few pennies at a time to determine a reasonable maximum amount.
Activity Extensions
Team Test Your Instructions: In addition to each team designing a mint-mobile with a sketch and list of materials (see the Design Worksheet), have them write instructions on how to build the mint-mobile and exchange designs with another group. Tell the students to build the other team's mint-mobile following the instructions using only the supplies listed. This exercise sharpens students' awareness of the importance of accuracy and clear communication in their engineering plans. Or similarly, conduct The Universal Language of Engineering Drawings activity, in which students practice the ability to produce clear, complete, accurate and detailed design drawings for a mint-mobile-type model car, using only specified materials. Teams trade drawings and attempt to construct the model cars in order to determine how successfully the original design intentions were communicated through sketches, dimensions and instructions.
Activity Scaling
- For lower grades, select mass as the independent variable for all groups to test. See Exploring Variables While Testing & Improving Mint-Mobiles (for Elementary School).
- For upper grades, have students focus on following the engineering design process to build and test their mint-mobiles while balancing tradeoffs between safety, design materials, and cost. Then, students test how changing the mass of their mint-mobile mass affects distance traveled. See Exploring Variables While Testing & Improving Mint-Mobiles (for High School).
Subscribe
Get the inside scoop on all things Teach Engineering such as new site features, curriculum updates, video releases, and more by signing up for our newsletter!More Curriculum Like This

Build a model race car out of lifesaver candies, popsicle sticks, straws, and other fun materials! Have students learn about independent, dependent, and control variables, and find out who can make the fastest car given their new knowledge.

High school students design, build, and test model race cars made from simple materials (lifesaver-shaped candies, plastic drinking straws, Popsicle sticks, index cards, tape) as a way to explore independent, dependent and control variables.
High school students learn how engineers mathematically design roller coaster paths using the approach that a curved path can be approximated by a sequence of many short inclines. They apply basic calculus and the work-energy theorem for non-conservative forces to quantify the friction along a curve...

Learn the basics of the analysis of forces engineers perform at the truss joints to calculate the strength of a truss bridge known as the “method of joints.” Find the tensions and compressions to solve systems of linear equations where the size depends on the number of elements and nodes in the trus...
Copyright
© 2020 by Regents of the University of ColoradoContributors
Lesley Herrmann; Stephanie Rivale; Denise W. Carlson; Sabina SchillSupporting Program
Integrated Teaching and Learning Program, College of Engineering, University of Colorado BoulderAcknowledgements
The contents of this digital library curriculum were developed under grants from the Fund for the Improvement of Postsecondary Education (FIPSE), U.S. Department of Education, and National Science Foundation (GK-12 grant no 0338326). However, these contents do not necessarily represent the policies of the Department of Education or National Science Foundation, and you should not assume endorsement by the federal government.
This curriculum was revised and adapted in 2020 from its original to serve middle school students by TeachEngineering.org.
Last modified: September 4, 2025
User Comments & Tips