Quick Look
Grade Level: 12 (10-12)
Time Required: 3 hours
(two block classes)
Expendable Cost/Group: US $2.00
Group Size: 3
Activity Dependency:
Subject Areas: Biology, Chemistry, Physical Science, Physics, Science and Technology
Summary
Students build and use a very basic Coulter electric sensing zone particle counter to count an unknown number of particles in a sample of "paint" to determine if enough particles per ml of "paint" exist to meet a quality standard. In a lab experiment, student teams each build an apparatus and circuit, set up data acquisition equipment, make a salt-soap solution, test liquid flow in the apparatus, take data, and make graphs to count particles.Engineering Connection
The electrical sensing zone method of particle characterization, also known as the Coulter principle, was proposed by electrical engineers and brothers Wallace and Joseph Coulter in the 1940s. Their Coulter Counter Model A instrument automated the counting of red blood cells and ushered in modern hematology. Today, many industries use modern versions of their instrument to analyze and measure samples of particulate material that can be suspended in an electrolyte solution, such as medicines, pigments, fillers, toners, foods, abrasives, explosives, clay, minerals, construction materials, coating materials, metals, and filter materials.
Learning Objectives
After this activity, students should be able to:
- Describe qualitatively how a particle changes the resistance between two electrodes as it moves through an aperture and how that resistance is measured.
- Describe the basic functioning of a Coulter counter, how the original Coulter counters improved blood cell counts, and how these improvements benefited patients and medical staff.
- Explain a number of ways that the Coulter counter is used in science and industry today.
Educational Standards
Each TeachEngineering lesson or activity is correlated to one or more K-12 science,
technology, engineering or math (STEM) educational standards.
All 100,000+ K-12 STEM standards covered in TeachEngineering are collected, maintained and packaged by the Achievement Standards Network (ASN),
a project of D2L (www.achievementstandards.org).
In the ASN, standards are hierarchically structured: first by source; e.g., by state; within source by type; e.g., science or mathematics;
within type by subtype, then by grade, etc.
Each TeachEngineering lesson or activity is correlated to one or more K-12 science, technology, engineering or math (STEM) educational standards.
All 100,000+ K-12 STEM standards covered in TeachEngineering are collected, maintained and packaged by the Achievement Standards Network (ASN), a project of D2L (www.achievementstandards.org).
In the ASN, standards are hierarchically structured: first by source; e.g., by state; within source by type; e.g., science or mathematics; within type by subtype, then by grade, etc.
Common Core State Standards - Math
-
Solve quadratic equations by inspection (e.g., for x² = 49), taking square roots, completing the square, the quadratic formula and factoring, as appropriate to the initial form of the equation. Recognize when the quadratic formula gives complex solutions and write them as a ± bi for real numbers a and b.
(Grades
9 -
12)
More Details
Do you agree with this alignment?
-
For a function that models a relationship between two quantities, interpret key features of graphs and tables in terms of the quantities, and sketch graphs showing key features given a verbal description of the relationship.
(Grades
9 -
12)
More Details
Do you agree with this alignment?
-
Use units as a way to understand problems and to guide the solution of multi-step problems; choose and interpret units consistently in formulas; choose and interpret the scale and the origin in graphs and data displays.
(Grades
9 -
12)
More Details
Do you agree with this alignment?
-
Graph linear and quadratic functions and show intercepts, maxima, and minima.
(Grades
9 -
12)
More Details
Do you agree with this alignment?
International Technology and Engineering Educators Association - Technology
-
Test and evaluate the solutions for the design problem.
(Grades
3 -
5)
More Details
Do you agree with this alignment?
-
Evaluate designs based on criteria, constraints, and standards.
(Grades
3 -
5)
More Details
Do you agree with this alignment?
-
Modeling, testing, evaluating, and modifying are used to transform ideas into practical solutions.
(Grades
6 -
8)
More Details
Do you agree with this alignment?
-
Use instruments to gather data on the performance of everyday products.
(Grades
6 -
8)
More Details
Do you agree with this alignment?
-
Interpret the accuracy of information collected.
(Grades
6 -
8)
More Details
Do you agree with this alignment?
State Standards
North Carolina - Math
-
Use units as a way to understand problems and to guide the solution of multi-step problems; choose and interpret units consistently in formulas; choose and interpret the scale and the origin in graphs and data displays.
(Grades
9 -
12)
More Details
Do you agree with this alignment?
-
Graph linear and quadratic functions and show intercepts, maxima, and minima.
(Grades
9 -
12)
More Details
Do you agree with this alignment?
-
For a function that models a relationship between two quantities, interpret key features of graphs and tables in terms of the quantities, and sketch graphs showing key features given a verbal description of the relationship.
(Grades
9 -
12)
More Details
Do you agree with this alignment?
-
Solve quadratic equations by inspection (e.g., for x² = 49), taking square roots, completing the square, the quadratic formula and factoring, as appropriate to the initial form of the equation. Recognize when the quadratic formula gives complex solutions and write them as a ± bi for real numbers a and b.
(Grades
9 -
12)
More Details
Do you agree with this alignment?
North Carolina - Science
-
Analyze systems with multiple potential differences and resistors connected in series and parallel circuits, both conceptually and mathematically, in terms of voltage, current and resistance.
(Grades
9 -
12)
More Details
Do you agree with this alignment?
-
Analyze the nature of moving charges and electric circuits.
(Grades
9 -
12)
More Details
Do you agree with this alignment?
Materials List
For Part 1, each group needs:
- plastic bottle with 1.5 mm hole drilled into cap
- 2 plastic cable ties
- ring stand with clamp holder and ~10 cm rod
- scissors
- Simple Coulter Counter Lab Handout, one per person
For Part 2, each group needs:
- 1 kΩ resistor
- 9V battery
- insulated wire
- 9V battery snap connector
For Part 3, each group needs:
- computer with data-acquisition and Microsoft Excel® software applications
- data-acquisition equipment (see note below; also see Troubleshooting Tips section)
- voltage probes
For Part 4, each group needs:
- 600 ml beaker
- stirrer
For Part 5, each group needs:
- a second 600 ml beaker
For Part 6, each group needs:
- Vial of "paint sample" with 1 mm diameter particles to be counted. (Make sample as described in Procedure section, by putting ~0.5 ml of grinding media plastic particles in a vial and filling with salt water solution [the same solution used elsewhere in the lab].) One source for plastic particles is Grinding Media Depot® at http://www.norstoneinc.com/our-products/beads/grinding-media-depot/; the grinding media come in a range of sizes; we suggest ~1mm-sized particles of PMMA, which has the density closest to water. Note: When we ordered the grinding media, a minimum order of $50 was required, which was far more than you would use for multiple years worth of classes.
For Part 1, to share with the entire class:
- hole punch
For Part 2, to share with the entire class:
- electrical tape
- wire strippers
For Part 4, to share with the entire class:
- liquid soap (enough for 2-3 drops per group)
- NaCl salt (enough for 0.3 g per group)
- scale (to measure salt in grams)
- water
For Part 5, to share with the entire class:
- printer
For teacher:
- drill and bit (to create 1.5 mm holes in plastic bottle caps)
A note on data acquisition equipment: The sample data provided for this lab was obtained using the following two different pieces of equipment.
- The Vernier LabQuest® Mini ($149) comes with the LoggerPro Lite® software and has a maximum sampling rate around 1000 samples/second when taking data for 30 seconds. A separate voltage probe ($12) must also be purchased for this lab.
- The DATAQ® DI-148U ($50) has a sampling rate of 240 samples/second when using the software provided and does not require a separate probe.
Worksheets and Attachments
Visit [www.teachengineering.org/activities/view/duk_retcoulter_act1] to print or download.Pre-Req Knowledge
Students must be familiar with data taking and storage using Vernier or other data acquisition equipment. Students must also be able to use a computer to graph data and adjust graph axes to view specific portions of their data.
Introduction/Motivation
Today our class has been asked to analyze the quality of a sample of "paint." Most paints contain at least three different substances — a pigment, a binder and a solvent. The pigment gives the paint its color while the binder holds the paint layer together and binds it to the surface being painted. The solvent dilutes the pigment and binder so they spread evenly on the surface. The solvent is volatile — it evaporates after the paint has been applied. For a paint to form a layer thick enough to hide the underlying surface, it must contain a minimum concentration of pigment particles compared to the binder and solvent.
Riverside Paint & Supply has asked us to check the quality of a batch of paint. Your assignment today is to build a simple Coulter particle counter similar to the ones we have discussed. You will use your Coulter counter to analyze a sample of "paint" (that I provide) to determine if the concentration of pigment particles meets the company's standards.
Procedure
Background
Below are suggested procedures, which you may need to alter, depending on student level, time constraints and material availability.
Before the Activity
- Drill 1.5 mm holes into bottle caps.
- Fill vials with ~0.5 ml of grinding media plastic particles and then fill with salt water solution (use same solution as is used in the lab, as described in Procedure section, below).
- Make copies of the Simple Coulter Counter Lab Handout.
- Gather materials and organize lab stations.
- Divide the class into groups of two to four students each.
With the Students – Part 1: Build Coulter Counter
- Cut off the bottom of a plastic beverage bottle about 5 cm from the bottom.
- Punch two holes 4-5 cm away from each other near the cut end of the bottle.
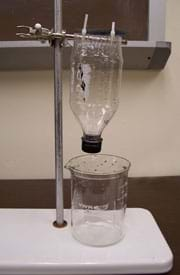
- Attach a metal rod to a ring stand using a clamp holder (see Figure 1).
- Attach the bottle to the metal rod by running the cable ties through the punched holes and securing them around the metal rod. Tip: Pull the cable ties snug enough to that it does not rotate, but loose enough that you can pull the bottle off the rod and put it back, as needed.
With the Students – Part 2: Build Circuit
(Note: It is difficult to measure the change in resistance of the aperture directly. Instead, we use the current in the circuit. When a particle passes through the aperture, the resistance in the circuit increases and the current decreases. We can monitor the change in current by monitoring the voltage over a resistor in series with the aperture. When the current decreases due to the passage of a particle, the voltage over the resistor also decreases and this change in voltage can be recorded by our data acquisition equipment.)
- Attach snap connector to a 9V battery.
- Cut two lengths of 30 cm insulated wire.
- Strip the ends of the wire.
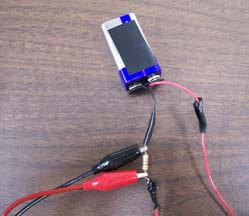
- Attach the battery, 1kΩ resistor, and wires as shown in Figure 2. Secure connections with electrical tape.
- When the counter is ready to run, place one wire end in the beaker beneath the bottle acting as a reservoir and the other in the bottle itself.
With the Students – Part 3: Set Up Data Acquisition Equipment
- Connect the measurement devices to the computer and open the data-acquisition software. These specific instructions may differ, depending on what data-acquisition products are used.
- Connect the voltage probe to the data-taking equipment and attach the probe leads as shown in Figure 2. Note where the positive (red) and ground (black) leads are attached relative to each other.
- Change data-acquisition settings, as needed. These may include the sampling rate (at least 200 samples/s), length of measurement (30s). (Note: If you are using the DATAQ DI-148U, students also must specify that only one channel is taking data.)
- Record a trial run. Adjust the horizontal scale to focus on data taken from 10s to 11s and adjust the vertical scale so that the waveform fills at least one-third of the entire screen.
- Before proceeding, have the teacher check your setup and test measurement. (Checkpoint assessment: At this point, verify students' understanding of the first half of the lab and that they are prepared for the second half.)
With the Students – Part 4: Make Salt Solution
- Fill a 600 ml beaker with 500 ml water.
- Mix 0.3 g NaCl into water.
- Add 2-3 small drops of liquid soap.
- Stir.
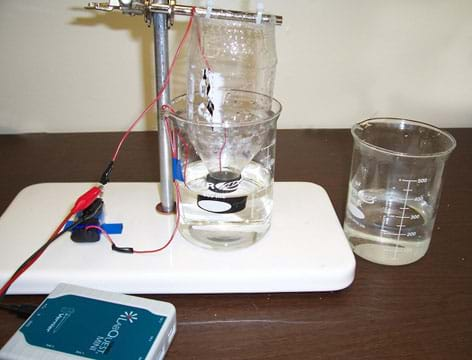
With the Students – Part 5: Test Liquid Flow in Apparatus
- Place a second 600 ml beaker beneath bottle. Lower the bottle until its cap is a few centimeters above the bottom of the beaker (see Figure 3.)
- Fill the beaker until its cap is covered.
- Place one wire end in the beaker below water level and secure it with tape. Place the other wire end in the bottle so that it is also covered in water. (see Figure 3)
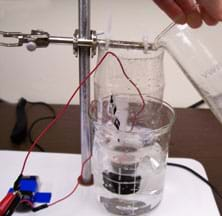
- Pour 100-150 ml of the remaining salt solution into the end of the bottle. The water will slowly flow through the aperture at the bottom to equalize the water height inside the bottle and in the beaker. (Figure 4)
- Record data for 30 seconds as the water flows with the settings you adjusted above.
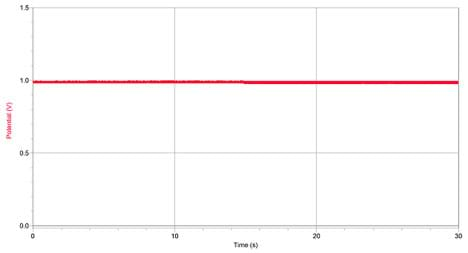
- Save the data file as "flowing_no_particles." Print and label the graph. (Expect the graph to show some "noise," but no obvious peaks or dips, similar to the graph in Figure 5.)
With the Students – Part 6: Take Data with Particles
- Repeat steps 1-5 from Part 5.
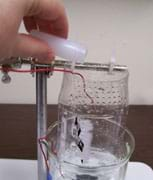
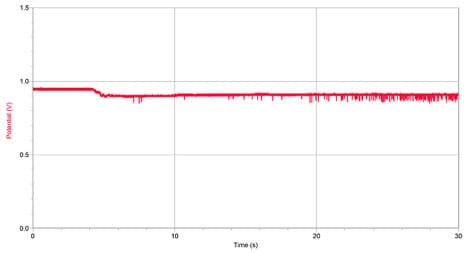
- Immediately after beginning the 30 s run, pour the vial of the particle solution ("paint sample") into the end of the bottle (see Figure 6). As each particle passes through the aperture, the change in resistance appears as a dip in your data (see Figure 7).
- Save the file as "flowing_with_particles" or "paint_sample." Print and label the graph.
With the Students – Part 7: Count Particles
- Have students answer questions on the handout.
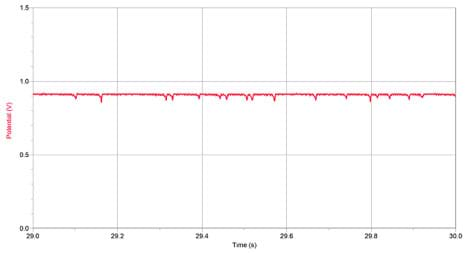
- Count and record how many particles your counter registered. Depending on your equipment and how many particles were in the vial, you may need look at smaller time intervals and then add the number of particles in each interval together for the total count. For example, many of the particles in Figure 7 are too clustered to count when looking at the entire 30 s. However, if the horizontal axis is changed to show only the interval between 29.0 and 30.0 s, the particles become clear (see Figure 8).
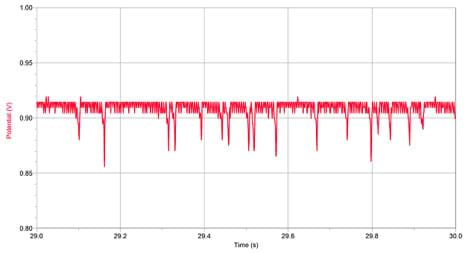
- If the dips due to the particles are too small to see, change the vertical axis to make the dips easier to see and count (see Figure 9).
With the Students – Part 8: Analysis
- After students have completed the lab experiment, printed out graphs and cleaned up, have them answer the four analysis questions at the end of the handout.
- Lead a class discussion to review and discuss their answers. Have students hand in their completed handouts and graphs for individual grading.
- As a homework research/writing assignment, ask students to investigate real-world applications of the Coulter method. See the Assessment section for assignment details.
Assessment
Pre-Activity Assessment
Lab Preparation: Before beginning the lab, have students do the following:
- Use a classroom projector to display a photograph of a complete lab setup (Figure 3). On blank paper, have students sketch the lab setup and label all components. If it helps, give students a list of tags (electrodes, battery, resistor, wires, data acquisition equipment, etc.).
- Have students read the lab handout looking for two or three places in which a careless error might easily occur. Have them write on the same paper (as the sketch) the location of these places. As a class, or in small groups or pairs, invite students to share these possible errors to increase their awareness of the importance of attention to detail.
Activity Embedded Assessment
Checkpoint: Embedded in the activity is a point (at the end of Part 3) at which students must have the teacher review their work up until this point and receive the teacher's initials. Take this opportunity to check for students' understanding of the first half of the lab and ensure they are prepared for the second half.
Post-Activity Assessment
Concluding Analysis: After students have completed the lab experiment, printed graphs and cleaned up, have them answer the four analysis questions at the end of the Simple Coulter Counter Lab Handout. Review their answers to gauge their comprehension of the material. Review/discuss answers as a class and/or grade individually.
Homework
Going Further: Have students research the Coulter method (also called the "electric sensing zone method") and find at least five applications in which this method is being used. For each application, have students write short paragraphs that answer the following questions: What is the application? What particles are being counted? Where are the particles found? Are any other properties of the particles measured? For what industry is this application beneficial?
Safety Issues
- Be careful to keep the salt solution away from the oscilloscope and Vernier equipment.
- Be careful when cutting the bottoms off the plastic bottles. The teacher may want to make these cuts in advance of the activity.
Troubleshooting Tips
Adding a few drops of liquid soap to the salt solution lowers the surface tension, helping the particles to sink in the water rather than becoming "stuck" on the surface.

Of the three data acquisition devices used, the Vernier LabQuest Mini® and the DATAQ DI-148U® were comparable. See Figure 10 for example data made with the Vernier LabQuest Mini® (left) and the DATAQ DI-148U® (right). Both are shown on the same scale The DI-148U was less expensive and provided less noisy data. However, be prepared to spend some time learning how to use the software and the different functions of the DI-148U itself.
Although data taken on the LabQuest Mini was "noisier" and the device itself is more expensive, the software is more user-friendly and Vernier provides support, especially for teachers. Also, additional probes for various measurements can be purchased for the Vernier equipment, which makes the LabQuest Mini more versatile for most classrooms
Activity Extensions
For advanced students, expand on this activity with the following extensions.
- Have students "calibrate" their Coulter counters by measuring the dips created by known particles, and then trying to determine the size of unknown particles.
- Have students calculate the theoretical speed of the particles coming out of the aperture using Bernoulli's equation and compare that to the time it takes for the particle to move through the aperture from the oscilloscope data. Bernoulli's equation:

- Have students estimate the difference in resistance between an open aperture and an aperture blocked by a particle and comparing this to the change in voltage in the oscilloscope data.
- By measuring the voltage over the 100 Ω resistor, which is 1/10 of the resistance of the aperture, the oscilloscope is essentially being used as an ammeter. Expand the lab into a discussion of ammeters and why the 100 Ω resistor was chosen.
Activity Scaling
- For more advanced students, see suggestions in the Activity Extensions section.
Subscribe
Get the inside scoop on all things Teach Engineering such as new site features, curriculum updates, video releases, and more by signing up for our newsletter!More Curriculum Like This

Students are presented with a short lesson on the Coulter principle—an electronic method to detect microscopic particles and determine their concentration in fluid. Depending on the focus of study, students can investigate the industrial and medical applications of particle detection, the physics of...
References
The Coulter Counter Model A Showcases at Chemical Heritage Foundation Exhibit. Beckman Coulter, Inc. Accessed August 31, 2010. http://www.beckmancoulter.com/resourcecenter/diagtoday/articles/DTO_Issue5_08/DTO_Issue5_08_ModelA.asp.
The Coulter Particle Counter/Sizer. Science-Projects.com. Accessed August 31, 2010. http://www.science-projects.com/Coulter/Coulter.htm
Graham, M. D. "The Coulter Principle: Foundation of an Industry." Journal of the Association for Laboratory Automation. December 2003: 72-81. Accessed January 8, 2014. http://jla.sagepub.com/content/8/6/72.full.pdf+html
Houwen, Berend. "Fifty years of hematology innovation: the Coulter Principle—Retrospective." Published November 2003. Medical Laboratory Observer, CBS Business Network. Accessed February 2011. http://findarticles.com/p/articles/mi_m3230/is_11_35/ai_111351102/
The ingredients of paint and their impact on paint properties. Published November 2005. Buildings.com. Accessed September 1, 2010. http://www.buildings.com/ArticleDetails/tabid/3321/ArticleID/2846/Default.aspx
Our Heritage—Wallace H. Coulter. Beckman Coulter, Inc. Accessed August 2009. http://www.beckmancoulter.com/hr/ourcompany/oc_WHCoulter_bio.asp.
U.S. Patent 2656508.Means for counting particles suspended in a fluid, October 20, 1953, Wallace H. Coulter.
Wallace H. Coulter (1913-1998) Automated Blood Analysis. Updated August 2000. Lemelson-MIT Program. Accessed August 31, 2010. http://web.mit.edu/invent/iow/coulter.html
Graham, Marshall. "The Coulter Principle: For the Good Of Humankind." Published December 2020. UKnowledge, Master's Thesis, College of Arts and Sciences, University of Kentucky. https://doi.org/10.13023/etd.2020.495 - Accessed May 7, 2021.
Copyright
© 2013 by Regents of the University of Colorado; original © 2010 Duke UniversityContributors
Jean Stave, Durham Public Schools, NC; Chuan-Hua Chen, Mechanical Engineering and Material ScienceSupporting Program
NSF CAREER Award and RET Program, Mechanical Engineering and Material Science, Pratt School of Engineering, Duke UniversityAcknowledgements
This digital library content was developed under an NSF CAREER Award (CBET- 08-46705) and an RET supplement (CBET-10-09869). However, these contents do not necessarily represent the policies of the National Science Foundation, and you should not assume endorsement by the federal government.
Last modified: May 7, 2021


User Comments & Tips