Quick Look
Grade Level: 12 (10-12)
Time Required: 30 minutes
Lesson Dependency: None
Subject Areas: Biology, Chemistry, Physical Science, Physics, Science and Technology
Summary
Students are presented with a short lesson on the Coulter principle—an electronic method to detect microscopic particles and determine their concentration in fluid. Depending on the focus of study, students can investigate the industrial and medical applications of particle detection, the physics of fluid flow and electric current through the apparatus, or the chemistry of the electrolytes used in the apparatus.Engineering Connection
The electrical sensing zone method of particle characterization, also known as the Coulter principle, was first proposed by electrical engineers Wallace and Joseph Coulter in the 1940s. This method was used to create a machine, the Coulter Counter Model A, that automated the counting of red blood cells and ushered in modern hematology. Today, many industries use similar machines to study particle number and size, including agriculture, biotechnology, environmental testing, food and beverage production, mining, paints and coatings, petrochemicals and pharmaceuticals.
Learning Objectives
After this lesson, students should be able to:
- Describe qualitatively how a particle changes the resistance between two electrodes as it moves through an aperture and how that resistance is measured.
- Describe the basic functioning of a Coulter counter, how the original Coulter counters improved blood cell counts, and how these improvements benefited patients and medical staff.
Educational Standards
Each TeachEngineering lesson or activity is correlated to one or more K-12 science,
technology, engineering or math (STEM) educational standards.
All 100,000+ K-12 STEM standards covered in TeachEngineering are collected, maintained and packaged by the Achievement Standards Network (ASN),
a project of D2L (www.achievementstandards.org).
In the ASN, standards are hierarchically structured: first by source; e.g., by state; within source by type; e.g., science or mathematics;
within type by subtype, then by grade, etc.
Each TeachEngineering lesson or activity is correlated to one or more K-12 science, technology, engineering or math (STEM) educational standards.
All 100,000+ K-12 STEM standards covered in TeachEngineering are collected, maintained and packaged by the Achievement Standards Network (ASN), a project of D2L (www.achievementstandards.org).
In the ASN, standards are hierarchically structured: first by source; e.g., by state; within source by type; e.g., science or mathematics; within type by subtype, then by grade, etc.
Common Core State Standards - Math
-
Use units as a way to understand problems and to guide the solution of multi-step problems; choose and interpret units consistently in formulas; choose and interpret the scale and the origin in graphs and data displays.
(Grades
9 -
12)
More Details
Do you agree with this alignment?
-
Graph linear and quadratic functions and show intercepts, maxima, and minima.
(Grades
9 -
12)
More Details
Do you agree with this alignment?
International Technology and Engineering Educators Association - Technology
-
Many tools and devices have been designed to help provide clues about health and to provide a safe environment.
(Grades
3 -
5)
More Details
Do you agree with this alignment?
State Standards
North Carolina - Math
-
Use units as a way to understand problems and to guide the solution of multi-step problems; choose and interpret units consistently in formulas; choose and interpret the scale and the origin in graphs and data displays.
(Grades
9 -
12)
More Details
Do you agree with this alignment?
-
Graph linear and quadratic functions and show intercepts, maxima, and minima.
(Grades
9 -
12)
More Details
Do you agree with this alignment?
North Carolina - Science
-
Analyze systems with multiple potential differences and resistors connected in series and parallel circuits, both conceptually and mathematically, in terms of voltage, current and resistance.
(Grades
9 -
12)
More Details
Do you agree with this alignment?
-
Analyze the nature of moving charges and electric circuits.
(Grades
9 -
12)
More Details
Do you agree with this alignment?
Pre-Req Knowledge
A basic understanding of circuits and the relationship between voltage, current and resistance (Ohm's Law); see the Assessment section for a few review questions/answers.
Introduction/Motivation
How many of you have had a blood sample taken by a nurse or doctor? Do you know why a blood sample is taken? (Give students time to brainstorm, either as a class or in small groups, and share stories about having blood drawn.)
One way to analyze blood is to count the number of red and white blood cells and platelets in a sample. (Depending on the focus of your course, you may wish to expand to include more in-depth information at this point.) An illness or other physical ailment can alter the number of cells in your blood from normal counts. A low red blood count, for example, might indicate that a person has anemia, and a high red blood count may be an indication of heart disease. A high white cell count could be caused by an infection, while a low count might be a sign of a serious diseases, including cancer. So, the ability to accurately and quickly count the different blood cells in a sample is an important diagnostic tool.
The original method for counting cells was to place a drop of blood on a glass slide and count the number of cells by eye while looking through a microscope. (Show Figure 1, a photograph of a microscopic blood smear slide.) This method took around 30 minutes to complete and was prone to error. Why do you think this might be the case? (Give students time to discuss this idea. You might remind them that a single slide could only show a very small sample of blood.) 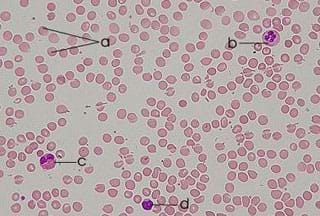
Today we are going to learn about the first commercially-available machine built by engineers to automate this procedure. This machine, called a Coulter counter, produced red blood cell counts that were 10 times more accurate in one-third of the time it took for technicians to perform blood counts through microscopes. Similar machines are used today, not only to automate blood cell counts, but to measure particle sizes and numbers in a wide variety of applications.
Following the lesson, students can apply their learning by building their own Coulter counters using simple materials and data acquisition equipment in the associated activity Lab Experiment: Build Simple Coulter Counters to Count Particles.
Lesson Background and Concepts for Teachers
Coulter Electric Sensing Zone Method
In 1953, engineer Wallace H. Coulter submitted a patent that proposed a deceptively simple method to count and measure the size of particles suspended in a fluid. This method, called the "electric sensing zone" method, uses the difference in resistance between a particle and surrounding fluid. The Coulter counter uses the concept of the resistivity to count particles.
Figure 2 shows a very basic Coulter counter. A test tube containing a conducting liquid is placed in a beaker also containing conducting liquid. A small aperture in the test tube connects the two. Two electrodes are placed in the beaker and in the test tube, and a voltage is applied between them through the aperture.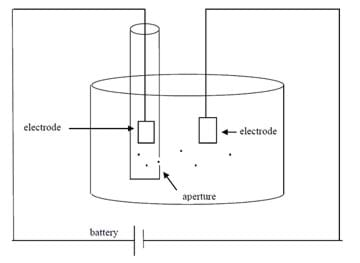
The particles to be counted, such as blood cells, are present in the liquid in the test tube. If the liquid level in the test tube is greater than that in the beaker, or if the test tube is pressurized, the fluid in the test tube flows into the beaker carrying the particles with it. The resistance between the two electrodes increases every time a non-conducting particle passes through the aperture. If the current between the two electrodes is being monitored, each drop in the current can be noted and the particles "counted."
Resistance Calculation
We can assume that the resistance of the conducting solution in the beaker and in the test tube is negligible compared to the resistance through the aperture. The resistance between the two electrodes is then determined by the resistance of a cylinder of conducting solution and given by the relation: 
In this equation, 


Now, if a particle blocks part of the cylinder, the resistance will change (see Figure 3). 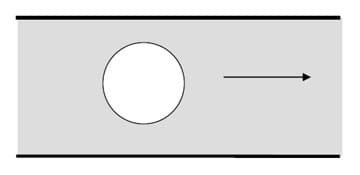
If the particle is an appreciable size compared to the width of the cylinder, the resistance of the cylinder, and hence the current flowing through the circuit, changes a measurable amount. If the particle is more conductive than the fluid, then the resistance of the aperture decreases. On the other hand, if the particle is less conductive than the fluid, the resistance of the aperture increases. (See Figure 4.) As the fluid being studied flows from one reservoir to the other through the cylinder, the number of particles can be monitored by counting how many times the current changes.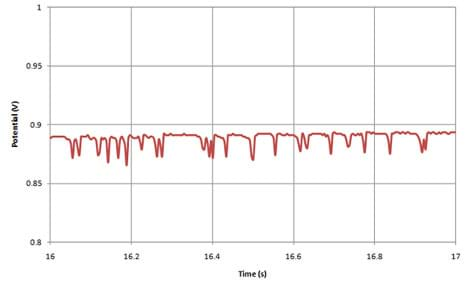
Associated Activities
- Lab Experiment: Build Simple Coulter Counters to Count Particles - Student teams build their own Coulter counters using simple materials and data acquisition equipment. They take data, make graphs and count particles in prepared "paint samples."
Assessment
Physics Review: At the beginning of the lesson, ask students these questions to refresh their memories of basic circuits knowledge and the underlying scientific principles of the lesson:
- What is the relationship between current and voltage? If the voltage over a circuit is increased, what happens to the current? (Answer: The voltage is the electrical potential difference between two points that cause charged particles, the current, to move through a circuit. You can visualize the voltage difference as a height difference of a hill, and the current as water flowing downhill. A battery or other electrical energy source can be visualized similar to a pump in a fountain to cause a continuous flow. If the voltage is increased, the water moves faster.)
- What is the relationship between current and resistance? If the resistance over a circuit is increased, what happens to the current? (Answer: Resistance is a measure of how difficult it is for current to move through the circuit. If the resistance in a circuit is increased, the current decreases.)
- How do the length, cross-sectional area, and material composition of a resistor affect its resistance? (Answer: You can visualize this question by thinking of a school hallway. A long, skinny hallway is harder to move students through than a wide, short hallway. [Think of examples in your school building.] The material composition can be thought of as the obstacles in the hallway. A room filled with desks is harder to move a lot of students through than an empty hallway. Length of a resistor increases resistance, cross-sectional area decreases resistance and conducting materials have less resistance than insulating materials.)
Lesson Summary Assessment Homework
Summarize: In three to four paragraphs, summarize your findings during the Simple Coulter Counter Lab (the associated activity). Include in your discussion an explanation of how the review questions at the beginning of class are related to the lab.
Additional Multimedia Support
Good description of "The Coulter Principle" at the Beckman Coulter website at www.beckmancoulter.com. There is also a video on YouTube produced by Beckman Coulter at https://www.youtube.com/watch?v=IaaOTrdK8z4.
Subscribe
Get the inside scoop on all things Teach Engineering such as new site features, curriculum updates, video releases, and more by signing up for our newsletter!More Curriculum Like This

Students build and use a very basic Coulter electric sensing zone particle counter to count an unknown number of particles in a sample of "paint" to determine if enough particles per ml of "paint" exist to meet a quality standard. In a lab experiment, student teams each build an apparatus and circui...

Students are presented with a short lesson on the difference between cohesive forces (the forces that hold water molecules together and create surface tension) and adhesive forces (the forces that causes water to "stick" to solid surfaces. Students are also introduced to examples of capillary action...

tudents are introduced to the similarities and differences in the behaviors of elastic solids and viscous fluids. In addition, fluid material properties such as viscosity are introduced, along with the methods that engineers use to determine those physical properties.
References
The Coulter Counter Model A Showcases at Chemical Heritage Foundation Exhibit. Beckman Coulter, Inc. Accessed August 31, 2010. http://www.beckmancoulter.com/resourcecenter/diagtoday/articles/DTO_Issue5_08/DTO_Issue5_08_ModelA.asp.
The Coulter Particle Counter/Sizer. Science-Projects.com. Accessed August 31, 2010. https://www.science-projects.com/Coulter/Coulter.htm
Graham, M. D. "The Coulter Principle: Foundation of an Industry." Journal of the Association for Laboratory Automation. December 2003: 72-81. Accessed January 8, 2014. https://jla.sagepub.com/content/8/6/72.full.pdf+html
Houwen, Berend. "Fifty years of hematology innovation: the Coulter Principle—Retrospective." Published November 2003. Medical Laboratory Observer, CBS Business Network. Accessed February 2011. https://findarticles.com/p/articles/mi_m3230/is_11_35/ai_111351102/
The ingredients of paint and their impact on paint properties. Published November 2005. Buildings.com. Accessed September 1, 2010. http://www.buildings.com/ArticleDetails/tabid/3321/ArticleID/2846/Default.aspx
Our Heritage—Wallace H. Coulter. Beckman Coulter, Inc. Accessed August 2009. http://www.beckmancoulter.com/hr/ourcompany/oc_WHCoulter_bio.asp.
U.S. Patent 2656508. Means for counting particles suspended in a fluid, October 20, 1953, Wallace H. Coulter.
Wallace H. Coulter (1913-1998) – Automated Blood Analysis. Updated August 2000. Lemelson—MIT Program. Accessed August 31, 2010. http://web.mit.edu/invent/iow/coulter.html
Copyright
© 2013 by Regents of the University of Colorado; original © 2010 Duke UniversityContributors
Jean Stave, Durham Public Schools, NC; Chuan-Hua Chen, Mechanical Engineering and Material Science, Duke UniversitySupporting Program
NSF CAREER Award and RET Program, Mechanical Engineering and Material Science, Pratt School of Engineering, Duke UniversityAcknowledgements
This digital library content was developed under an NSF CAREER Award (CBET- 08-46705) and an RET supplement (CBET-10-09869). However, these contents do not necessarily represent the policies of the National Science Foundation, and you should not assume endorsement by the federal government.
Last modified: June 27, 2019


User Comments & Tips