
Build an Earthquake City
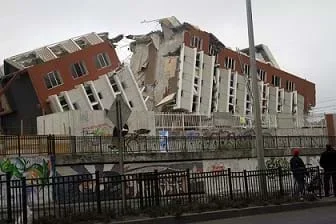 The damage left behind on a building after an earthquakeCopyright Claudio Núñez. Wikimedia Commons. http://commons.wikimedia.org/wiki/File:2010_Chile_earthquake_-_Building_destroyed_in_Concepci%C3%B3n.jpg
Students build miniature model cities using sugar, bouillon and gelatin cubes. The cities are put through simulated earthquakes to see which cube structures withstand the shaking movements the best.
In many areas of the world, earthquakes cause buildings to fall and many lives to be lost. Civil engineers design structures to be able to withstand the force of earthquakes. To do this, they must understand how the movement of the Earth affects structures, and what types of materials are best to use in earthquake zone construction.
- The effect of earthquakes on structures.
- The importance of strong buildings to prevent destruction by earthquakes.
- How the epicenter of an earthquake affects buildings.
- Different materials used in the construction of buildings.
- CCSS.Math.Content.6.SP.B.4 Display numerical data in plots on a number line, including dot plots, histograms, and box plots.
Grade 6
Do you agree with this alignment? - CCSS.Math.Content.6.SP.B.5 Summarize numerical data sets in relation to their context, such as by:
Grade 6
Do you agree with this alignment? - CCSS.Math.Practice.MP2 Reason abstractly and quantitatively.
Grades K-12
Do you agree with this alignment?
- Students will develop an understanding of the attributes of design.
Grades K-12
Do you agree with this alignment? - Students will develop an understanding of engineering design.
Grades K-12
Do you agree with this alignment? - The selection of designs for structures is based on factors such as building laws and codes, style, convenience, cost, climate, and function.
Grades 6-8
Do you agree with this alignment? - STEL-7Q Apply the technology and engineering design process.
Grades 6-8
Do you agree with this alignment? - STEL-7S Create solutions to problems by identifying and applying human factors in design.
Grades 6-8
Do you agree with this alignment?
- 6.SP.B.4 Display numerical data in plots on a number line, including dot plots, histograms, and box plots.
Grade 6
Do you agree with this alignment? - 6.SP.B.5 Summarize numerical data sets in relation to their context, such as by:
Grade 6
Do you agree with this alignment? - MP.2 Reason abstractly and quantitatively.
Grades -1-12
Do you agree with this alignment?
- 7.MS-ETS1-4 Generate and analyze data from iterative testing and modification of a proposed object, tool, or process to optimize the object, tool, or process for its intended purpose.
Grade 7
Do you agree with this alignment?
- MS-ETS1-4 Develop a model to generate data for iterative testing and modification of a proposed object, tool, or process such that an optimal design can be achieved.
Grades 6-8
This resource focuses on the following Three Dimensional Learning aspects of NGSS:
Science & Engineering Practices- Develop a model to generate data to test ideas about designed systems, including those representing inputs and outputs.Do you agree with this alignment?
- Analyze and interpret data to provide evidence for phenomena.Do you agree with this alignment?
- Use mathematical representations to describe and/or support scientific conclusions and design solutions.Do you agree with this alignment?
Disciplinary Core Ideas- Models of all kinds are important for testing solutions.Do you agree with this alignment?
- The iterative process of testing the most promising solutions and modifying what is proposed on the basis of the test results leads to greater refinement and ultimately to an optimal solution.Do you agree with this alignment?
Crosscutting Concepts- Models can be used to represent systems and their interactions.Do you agree with this alignment?
Do you agree with this alignment? - Develop a model to generate data to test ideas about designed systems, including those representing inputs and outputs.
- box with a smooth bottom, at least 25-cm wide X 20-cm long
- sugar cubes
- bouillon cubes
- gelatin cubes (Follow instructions on the box, but use 1/3 as much water as the recipe calls for. Use a pan or ice cube tray. Chill until very firm and cut into small cubes, about the size of sugar and bouillon cubes.)
- pencil
- ruler
- Testing Worksheet (PDF), one per group
- (optional) wood and plastic cubes, as additional building materials
Have you ever been in an earthquake? What happens during an earthquake? (Listen to student stories and explanations. If students are unfamiliar with earthquakes, show them YouTube videos taken during earthquakes.)
During an earthquake, energy travels through the Earth and can cause damage to buildings and other structures. The amount of damage caused by an earthquake depends on several factors, such as the strength of the earthquake, how long it lasts, and where it happens.
What is an epicenter? (Listen to student ideas.) The epicenter of an earthquake is the point on the Earth's surface directly above where an earthquake starts, or where the shaking begins. Damage is typically greatest at the epicenter.
What can we do to keep people from being hurt in earthquakes? (Listen to student ideas.) Well, we cannot prevent earthquakes; they're a natural phenomenon of the Earth. But engineers have lots of ideas about how we might make our buildings more safe so they don't fail during earthquakes. For example, the most modern skyscrapers are made of more flexible materials so that they bend and sway during earthquakes and do not fall down easily.
Let's do a little experiment today and learn more about designing structures to be more earthquake resistant.
Before the Activity
- Buy or assemble the materials.
- Make copies of the Testing Worksheet (PDF).
- Prepare the gelatin cubes.
With the Students
- Discuss with the class what an earthquake is and what the epicenter of an earthquake is. Divide the class into small groups or pairs of students. Give each group a box bottom and a worksheet.
- Using the pencil and ruler, have students create grids on their box bottoms by drawing 4 vertical lines and 5 horizontal lines, with each line about 5-cm apart. Label the vertical lines 1st Avenue, 2nd Avenue, 3rd Avenue, etc., and the horizontal lines A Street, B Street, C Street, etc. This is our Earthquake City.
 Copyright 2004 Center for Engineering Educational Outreach, Tufts University
 - Save student teams build three sugar cube skyscrapers, each five sugar cubes tall. Place these skyscrapers at the following corners: A and 1st , B and 2nd , C and 3rd.
- To show that earthquakes can cause damage to buildings, have each team simulate an earthquake by tapping on the corner of E and 4th with the eraser of a pencil. Have them continue to tap until at least one cube from each skyscraper falls. Ask: Which skyscraper falls first? In a real earthquake, do you think damage happens more in one place than another? Where would the most damage happen?
- Have students repeat step 4 again (earthquake simulation), but use different strength taps, representing hard vibrations and soft vibrations. Determine how many hard or soft vibrations it takes to knock over buildings that are different distances away from the epicenter.
- Have students record results in the chart on the worksheet, noting the skyscraper locations and when they fell.
- Now give students time to experiment with different types of cubes. Encourage them to create skyscrapers of different heights and from a mix blocks.
- After they have had time to experiment with the different types of blocks, have each group build a city of skyscrapers. The cities may be as large as they wish, but must have at least five skyscrapers of different heights.
- Once the cities are completed, go around to each group and tap with your pencil at a corner in the city to test how earthquake resistant they are.
- After the cities have been tested, and students have put away materials, lead a class discussion to share results and discoveries.
Rubric: Use the attached Rubric for Performance Assessment (PDF) to evaluate students for performance, teamwork and understanding.
Graphing: Have students create two bar graphs - one showing the amount of taps necessary to cause each type of building to fall, and one showing the distance each type of building was from the tapping point. Then use these graphs to discuss how the type of building and its distance from the tapping point affect how the building reacts during an earthquake.
Adapted with permission from The Best of Wonderscience, Copyright 1997, American Chemical Society Published by Wadsworth Publishing, Inc.. If you enjoyed this activity check out www.chemistry.org/wondernet, Your Science Place in Cyberspace, for free elementary physical science activities. Kessler, James H. and Andrea Bennett. The Best of Wonderscience: Elementary Science Activities. Boston, MA: Delmar Publishers, 1997. pp. 322-324. ISBN: 0827380941
Supporting Program
Center for Engineering Educational Outreach, Tufts University
Copyright
2013 by Regents of the University of Colorado; original © 2004 Worcester Polytechnic Institute